
Gold Lost $4,000. Here’s Why.
Gold closed Friday at $3,875.84, its lowest since October 2025, with a war in the Gulf that should have lifted it. A hawkish Fed, a tech sell-off with margin calls, and a real-yield story that does not quite add up. Here is what happened and where the levels are.
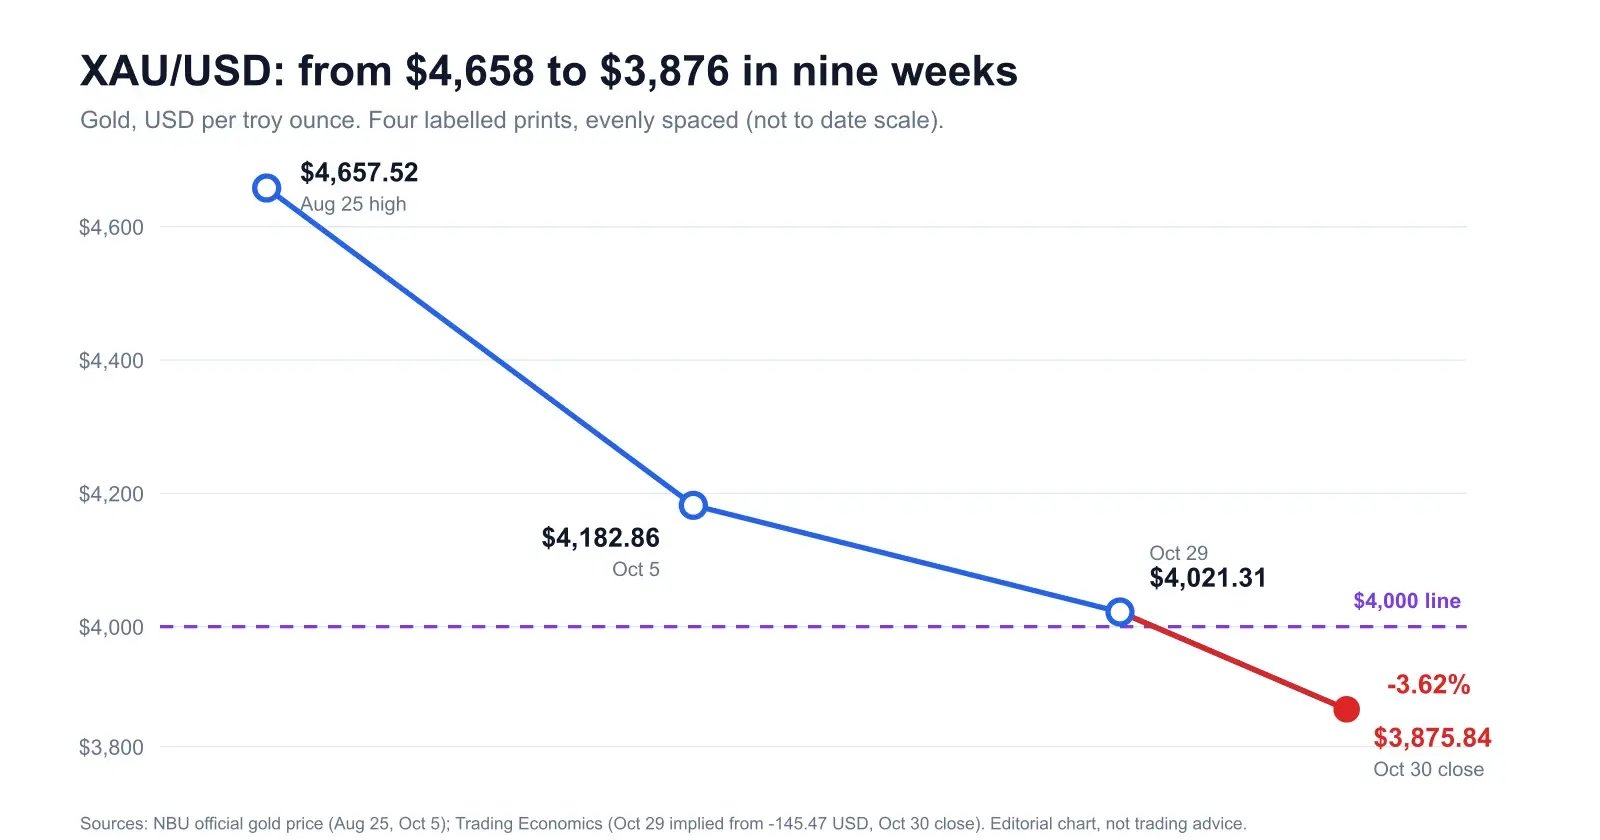
On Friday, October 30, gold fell 3.62% to $3,875.84 an ounce, according to Trading Economics. That is the lowest print since October 2025 and it sits below the $4,000 line that held through the summer. Some feeds show the low a few dollars either side, and FXEmpire’s page was quoting $3,936 mid-session, so the safest wording is the one most sources agree on: gold went below $3,900 for the first time in a year.
What makes it uncomfortable is the backdrop. Brent was around $117 after a tanker attack in the Strait of Hormuz, there was a war in the Gulf, and gold, the instrument every war-trade playbook puts first, went down hard. If you have been following our Iran conflict gold and oil playbook, this is the exception that playbook warned about. It deserves a closer look, because the lesson is bigger than one Friday.
Key Takeaways
- →Gold closed Friday, October 30 at $3,875.84, down 3.62% on the day and about 7.2% on the month (Trading Economics). XTB puts the October loss near 6%, so treat the exact month figure as source-dependent.
- →Hike odds did the damage. A December hike was above 70% in CME FedWatch per XTB, after hot September PCE and a strong Q3 GDP, with oil keeping inflation fear alive.
- →The simple real-yield story is only half true. The 10-year TIPS yield fell from 2.95% on October 5 to 2.63% on October 29, and gold fell anyway. Commerzbank said as much on October 27.
- →Friday looks like liquidation. Nasdaq 100 down about 2.2%, margin calls, and investors selling whatever is liquid and has gone up. Treasuries, not gold, took the haven money.
- →The levels: $3,850 to $3,880 support, $3,800 below it, $4,000 as the line to reclaim, then $4,100.
1. The path to $3,876
This was not a one-day accident. Gold printed its summer high of $4,657.52 on August 25 on the National Bank of Ukraine’s official price series, roughly where XTB places the peak, “near $4,700.” By October 5 it was $4,182.86, already 10% off that high. Then it spent the back half of October pressing on the $4,000 floor it had defended in June and July (the NBU print for June 26 was $3,981.04).
Commerzbank’s Thu Lan Nguyen and Carsten Fritsch wrote on October 27 that gold had “fallen back below $4,000.” It did not stay down for long. December COMEX gold settled at $4,031.40 on October 29, per the CME bulletin quoted by FXEmpire, and spot was around $4,021 by our arithmetic. Then Friday took out the floor with a 3.62% drop. For context, the January record was near $5,400, which we covered in Can Gold Climb Back to $5,000? That July piece was the bull case. This is the other branch.
2. The Fed did it, mostly
Start with the policy backdrop, because it explains the whole autumn. The Fed hiked on September 16 to 3.75% to 4.00%, which we broke down in the September hike post. On October 28 it held at that range, but with two dissenters who wanted a quarter-point hike, per the FXEmpire write-up of the decision. Our read of that meeting is in the October hawkish hold analysis. The FOMC statement and vote record are on the Fed’s site.
A hold with hawkish dissent is not neutral for gold. It tells the market the committee’s centre of gravity is still tightening-biased, and it leaves December live. Then the data landed. XTB reports September PCE up 0.5% on the month and 3.6% on the year, core at 3.1%, and Q3 GDP at 3.4% annualised against a 3.2% forecast. CME FedWatch had December hike odds above 70% by Friday. Compare that with Commerzbank on Tuesday, who said a December hike was no longer fully priced. In four sessions the market went from relief to a hike.
Oil is the link that makes this a gold story rather than only a dollar story. Brent rose as much as 2.5% on Friday to about $117.76, its highest since April, after the Hormuz tanker attack. A war premium in crude is an inflation impulse, and an inflation impulse is a hike impulse. This is the same mechanism we walk through in the oil shock and forex pairs piece. The war that should have helped gold was feeding the thing that hurts it.
3. The real-yield problem
The textbook line is that gold trades inversely to the 10-year TIPS yield, because gold pays nothing and real yields are the opportunity cost. Higher hike odds, higher real yield, lower gold. It fits the first half of the autumn well. The 10-year TIPS yield closed at 2.95% on October 5, its highest close since November 2008, and gold slid from $4,407 on September 10 to $4,183 on October 5.
Now look at the end of the month. The FRED DFII10 series shows the 10-year real yield at 2.66% on October 23 and 26, 2.64% on the 27th, 2.67% on the 28th, and 2.63% on the 29th. That is about 32 basis points below the October 5 peak, and gold fell another 7% or so over the same stretch. Commerzbank called this out directly: the move was “surprising given easing US rate expectations and lower real yields,” and the decline was not triggered by the adjustment in rate expectations.
| Date (2026) | 10y TIPS real yield | Gold |
|---|---|---|
| Oct 5 | 2.95% (highest close since Nov 2008) | $4,182.86 (NBU official) |
| Oct 28 | 2.67% | Fed holds; gold down about 0.6% on the day |
| Oct 29 | 2.63% | About $4,021 (implied); Dec COMEX settle $4,031.40 |
| Oct 30 | Not yet published at time of writing (FRED next update Nov 2) | $3,875.84, -3.62% |
Reconciling it takes more than one channel. Real yields describe one, and the autumn had at least three. First, the level matters, not just the direction: 2.6% is still a very high real yield by any post-2008 standard, and gold had been priced for a lower one. Second, the TIPS yield is a snapshot of rates, and the Friday damage came from positioning and liquidity, which a rates chart cannot show. Third, the dollar side. XTB notes that a weaker dollar was not protecting gold, but none of the sources we could verify gave a clean DXY number, so we are leaving the dollar out of the arithmetic rather than guessing.
The practical conclusion: stop treating real yields as a switch. They set the backdrop. When gold falls while the backdrop is stable or easing, something else is selling it, and that something else is usually flows.
4. Friday was liquidation
On Friday the Nasdaq 100 fell about 2.2% and the S&P 500 about 1.3%, according to XTB. Intel dropped nearly 30% on weak guidance. XTB put the Nasdaq 100’s October market-cap loss above $1.2 trillion and tied the AI-spending worry to the sell-off. Bitcoin dropped under $77,000 after a Binance hack. Silver fell nearly 5% to $49.64, and is down about 18% on the month.
Everything fell together. That is the signature of a margin-driven sell-off. XTB’s phrasing is blunt and, in our experience, right: investors who need to meet margin calls sell what is most liquid and what brought the biggest gains. After a year in which gold had been one of the best performers on the board, it is both of those things. Reports of speculative selling and ETF outflows fit the same picture, though we could not verify the ETF numbers against a primary source (more on that below).
Where did the haven money go? Into bonds. XTB says US Treasuries had their best month since February 2025, with the 10-year around 4.95%. Most gold bulls expected fear to show up as a flight to metal. This time it showed up as a flight to duration, and to cash.
5. Why the war bid did not hold
Our cross-asset prior for a war risk-off is simple. The dollar and the Canadian dollar firm, equity indices fall, the yen tends to catch a haven bid, the Swiss franc is held back by the SNB, and gold usually rises. The key word is usually. Gold wins the war trade when the shock is also a growth and rate-cut shock, because real yields fall and the dollar’s own haven bid is outweighed. It loses when the shock is an inflation shock.
A Hormuz oil spike is the second type. It pushes central banks toward tightening, not easing, which is exactly the Fed’s situation in October. Add a leveraged equity unwind and you get the pattern we saw: first the war headlines lift gold a little, then the hike odds and the margin calls overwhelm them. If you want the currency side of the Fed reaction, our dollar strength explainer covers it.
The rule we are taking from this. Before you buy gold on a war headline, ask whether the shock pushes the central bank toward cutting or toward hiking. If it is hiking, gold needs the real-yield channel to ease, and in a liquidation it can fall even if it does.
The other change since the summer is crowding. A metal that rallied to a record in January has a lot of holders sitting on a lot of gain, and those are the people who get forced to sell when margin calls hit. Central-bank buying is the structural counterweight that people usually reach for here. The World Gold Council’s Q3 Gold Demand Trends is due around now, but we could not retrieve the 2026 figures, so we are not quoting a tonnage. Check the report before leaning on any central-bank-bid argument.
6. The levels that matter now
XTB’s technical read is that gold sits below its 50-, 100- and 200-day averages, with lower highs and lower lows since August, RSI near 30 and a bearish MACD. Its levels: support at $3,850 to $3,880, then $3,800; resistance at $4,000, then $4,100, then a moving-average cluster from $4,200 to $4,490. Standard Chartered’s Suki Cooper, quoted by The Currency Analytics, says gold needs to hold $3,886, and a sustained break below it could trigger a deeper correction. FXEmpire’s author wrote before the break that below $3,950 he would be much more bearish; price has since gone through that line.
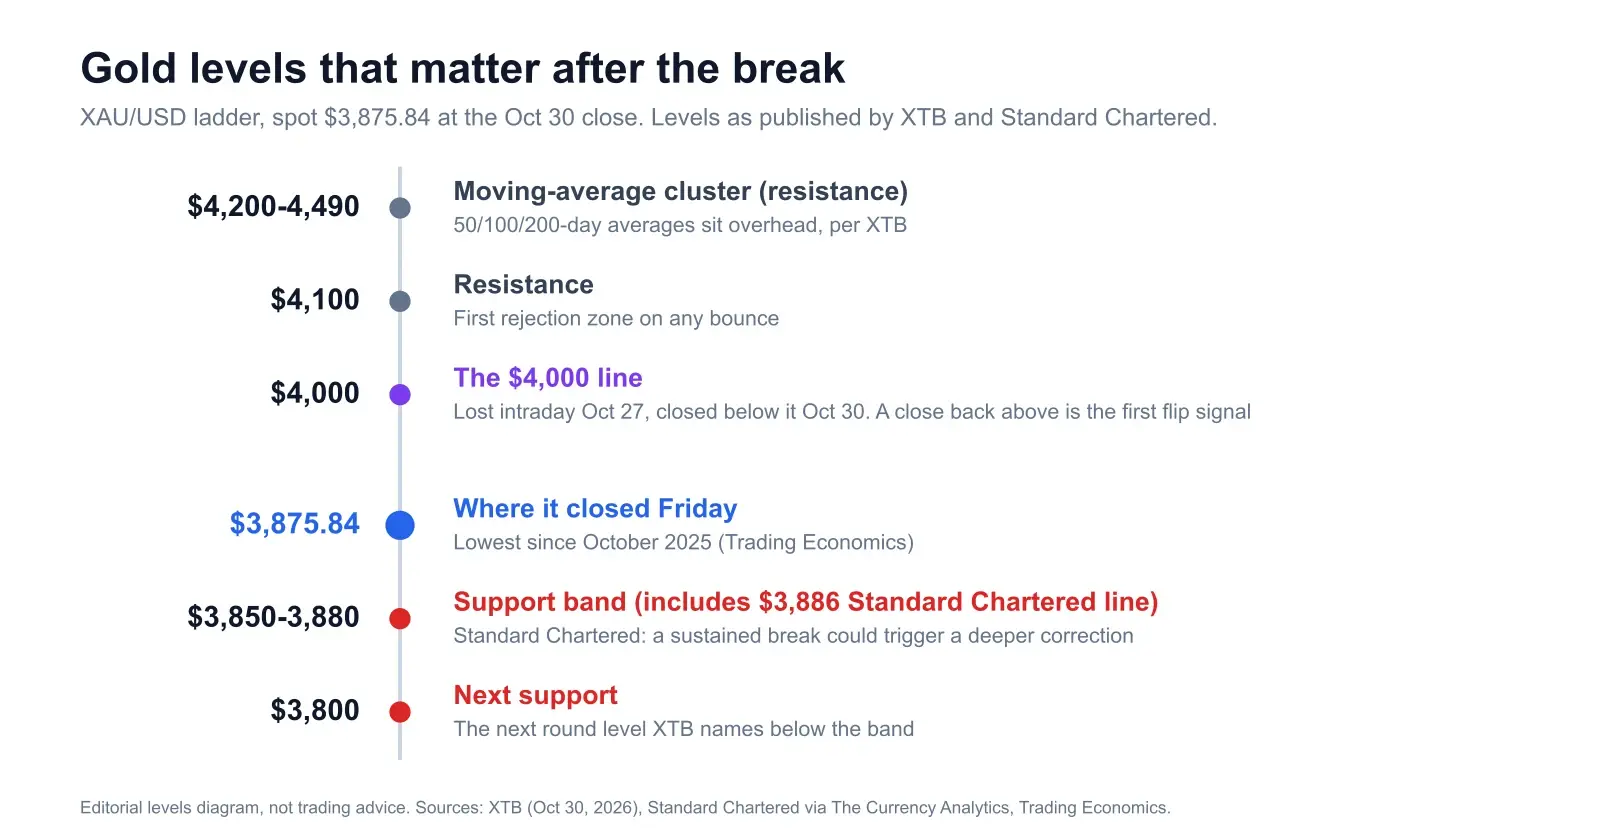
The way we would use this ladder: the band at $3,850 to $3,880 is where a trader finds out whether Friday was the flush or the first leg. A daily close under $3,850 with RSI already oversold is a continuation signal, not a buy-the-dip signal, since oversold readings in a liquidation tend to persist longer than they feel they should. A hold, then a bounce that stalls under $4,000, is the more common pattern. It also gives you a short with a defined stop. Our guide to trading gold volatility covers stop placement in these conditions, and the best-time-to-trade piece covers which sessions give you the cleanest tape.
7. What flips it back
There are four triggers, roughly in order of how likely they are over the next few weeks.
Hike pricing peaks. JPMorgan Private Bank’s Yuxuan Tang expects hikes in December and early 2027 and says that “gold will find a solid bottom when rates peak.” That is a rates-peak call, not a call for next week, and it argues for patience. The December FOMC and the US midterm elections on Tuesday are the two scheduled catalysts we would mark. XTB also flags a risk of fresh US strikes on Iran after the election, which would hit oil and, through the same channel, gold.
Oil rolls over. A ceasefire or a Hormuz de-escalation takes the inflation impulse out of crude, takes the hike out of the Fed, and restores the normal gold-up-on-geopolitics correlation. Oddly, the cleanest bullish case for gold is peace, at least for the next few weeks.
The liquidation finishes. Margin-call selling is finite. Once equity volatility settles, the forced seller is gone and gold stops being sold as the most liquid asset available. You will see it as a daily close back above $4,000, not as a news event.
Fear changes shape. If the next scare is about the system rather than about cash, such as a credit event, a bond-market accident or a currency crisis, the gold bid comes back. Commerzbank noted tension in French government bonds that would normally favour gold. Their point was that conditions differed from late September, and gold was not responding. That is a signal worth tracking: when a normally gold-positive headline fails to lift it, the market is still in liquidation mode.
For the long-run bull case, Standard Chartered still expects a recovery on de-dollarisation and debasement themes, and a Reuters poll of 30 analysts has median forecasts of $4,495 for 2026 and $4,650 for 2027. Both sit well above the market, which says forecasters have barely chased price lower. We would not anchor on the poll.
8. Trading it from here
Our own priors going into Monday: the trend is down, the level is exposed, and the best trade is rarely the first one into a flush. A short entered into oversold support has terrible reward-to-risk; a short entered on a failed bounce under $4,000 has a clear invalidation. A long needs a reason, and the reason is a daily close back above $4,000, not a feeling that it is cheap. If you want a second pair of eyes on a gold chart, the Chart Snipe tool reads a screenshot and returns trend, pattern and entry and risk guidance, and our News Impact analysis publishes the macro bias for XAU/USD before each session so you know whether the Fed and oil story is still driving. Log the trade in the trading journal so you can grade your gold calls over time. Plans and limits are on the pricing page.
Frequently asked questions
Why did gold fall below $4,000 in October 2026?
A hawkish Fed (a September hike, then a hold on October 28 with two dissents for another hike) and hot data lifted December hike odds, and oil near $117 kept inflation fear alive. On Friday a tech sell-off added margin-call liquidation, and Treasuries absorbed the haven bid. Gold closed October 30 at $3,875.84, down 3.62% on the day.
Is gold still a safe haven?
It is a haven against debasement and falling real yields, not against a liquidity squeeze or a rate scare. In October it behaved like a crowded winner sold for cash.
What are the key gold levels now?
Support at $3,850 to $3,880 and $3,800 per XTB, with Standard Chartered flagging $3,886. Resistance at $4,000, $4,100, then $4,200 to $4,490.
What would turn gold back up?
A daily close back above $4,000 is the first signal. Behind it: a peak in hike pricing, an oil reversal, the end of the margin-driven selling, or a fear shock that is about the system rather than about cash.
Sources & further reading
- → Trading Economics (gold): the October 30 close ($3,875.84), the 3.62% daily and 7.23% monthly moves.
- → FRED: 10-year TIPS yield (DFII10), the real-yield readings from October 23 to 29.
- → Federal Reserve: FOMC calendars, statements and votes, the primary source for the October 28 hold.
- → XTB: gold drops sharply at the end of October, covering the liquidation framing, PCE and GDP figures and the technical levels.
- → FXStreet: Commerzbank on gold under pressure despite lower real yields, the October 27 note.
- → World Gold Council: Gold Demand Trends, central-bank and ETF data, quarterly.
Know what is driving gold before Monday’s open
News Impact ranks 12 instruments, including XAU/USD, every trading day with a written thesis and a Risk Analysis of what would break it. Put your own gold chart through the Chart Snipe tool and see whether the two agree before you trade.