
Which Currencies Feel an Oil Shock First
CAD and NOK should gain from $100 oil, and JPY, EUR and INR should pay. In September 2026 USD/CAD rose anyway. Here is the map, the central-bank channel that breaks it, and how to read EIA data and Hormuz headlines from the trading desk.
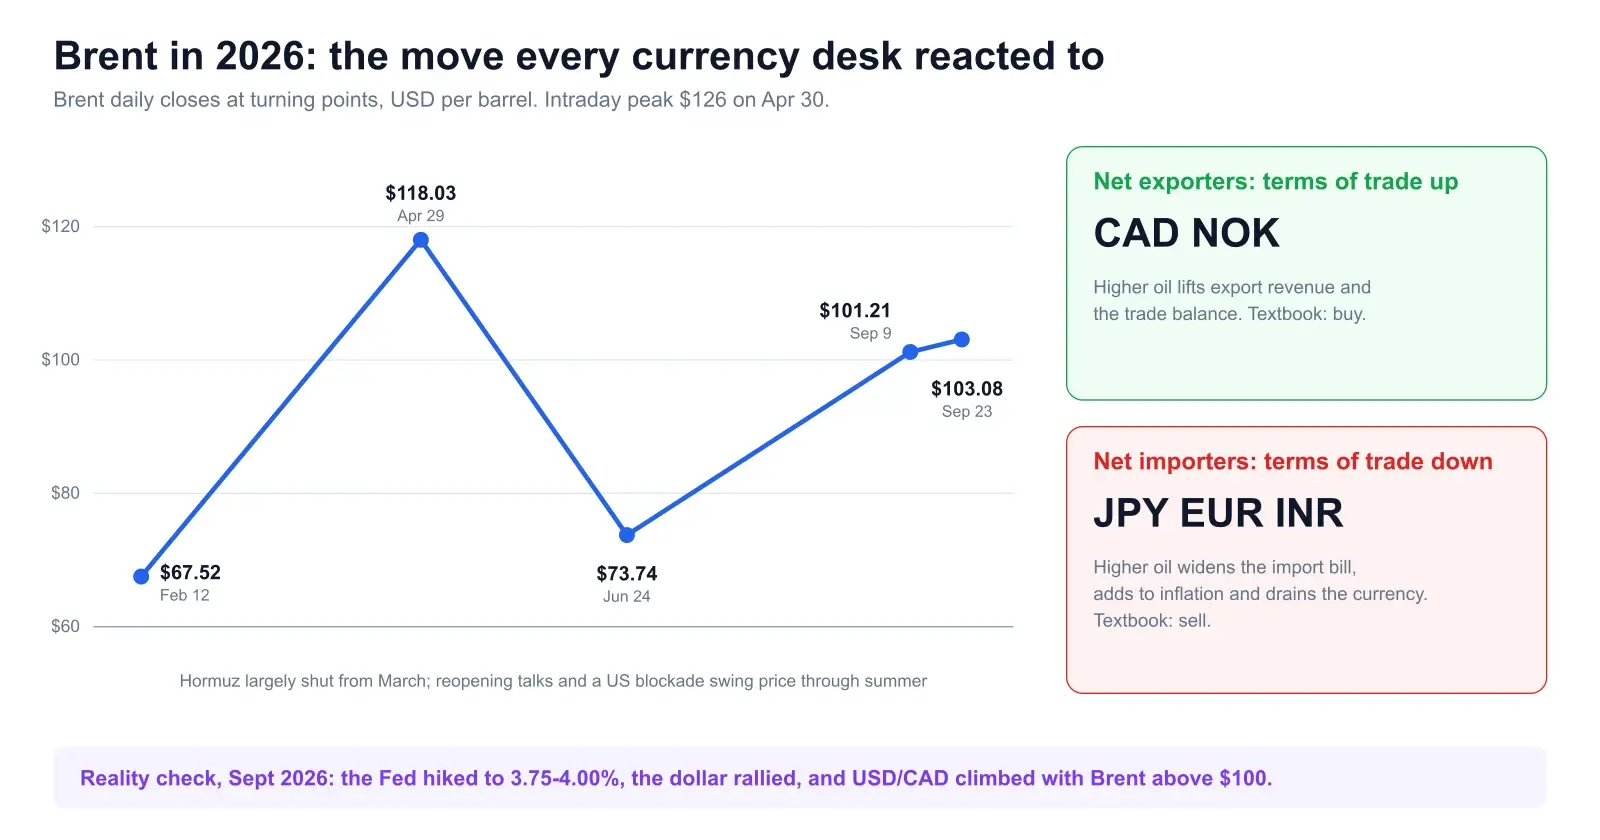
Every oil spike gets the same line on the morning desk note: “good for CAD and NOK, bad for JPY and the euro.” It is a fine first sentence and a poor trading rule. This year Brent went from $67.52 in February to a $118.03 close in April, back to $73.74 in June, and above $100 again in September. The currencies did not follow the same script each time.
This piece sorts out which currencies feel an oil shock first, why, and what overrides it. The short answer: oil is a story about relative policy. The barrel sets the inflation problem, the central banks set the response, and the dollar prices that response. Get the order wrong and you end up long CAD into a Fed hike.
Key Takeaways
- →Oil reaches currencies through two channels: terms of trade (slow) and inflation-driven central bank policy (fast). In 2026 the second has won.
- →In September Brent held above $100 and USD/CAD still rose about 2.4%. The Fed hiked, and the dollar index gained about 2.4%.
- →Oil-up-CAD-up works when the dollar is quiet. It breaks when the Fed is the hawk, when risk-off bids the dollar, or when oil rises on a growth-damaging war.
- →EUR/USD fell about 2.4% in the same window, ECB hike and all. Not every hike is bullish for the currency.
- →EIA inventory data is a confirmer. Hormuz headlines are the regime.
- →Anchor on the dollar first, then map oil to the pair.
1. The terms-of-trade map
Start with the arithmetic. Everything else is a footnote to it. A country that sells more oil than it buys gets richer when the price rises, and one that buys more than it sells gets poorer. Economists call that terms of trade. Currencies price it in before the trade data confirms it.
The textbook split is simple. Net exporters: CAD and NOK, the Canadian dollar because energy is Canada’s largest export, the krone because of the Norwegian North Sea. Net importers: JPY, since Japan buys almost all of its energy abroad, EUR, since the euro area is a net energy importer, and INR, since India imports the large majority of its crude. On paper, Brent at $100 is a transfer from the second group to the first.
2026 is a useful lab. Brent closed at $67.52 on February 12, spiked to a $118.03 close on April 29 (intraday $126 the next day) while the Strait of Hormuz stayed largely shut, fell back to $73.74 by June 24 as tankers began to transit again, then climbed back above $100 in September as US-Iran fighting escalated. Those closes come from the running 2026 oil market chronology, which tracks the daily settles. We covered the geopolitics in our Iran crisis piece on gold and oil. This post is about the currency side.
Canadian heavy crude sells at a discount to Brent, and much of Canada’s output sits behind a pipeline network that limits where it can go. The loonie’s link to the Brent headline is looser than the krone’s. Norway sells at roughly Brent prices into Europe. If you want a clean oil-currency beta, NOK is the purer one, but it is thin enough that most retail traders never touch it. CAD is where the volume is, so CAD is where the rule gets tested.
2. The second channel is inflation, and it is the one that wins
Terms of trade is the slow channel. Inflation is the fast one, and in 2026 it has dominated because it runs straight through central banks.
Look at the August prints. US CPI rose 0.4% on the month and 3.4% on the year. Gasoline was up 3.9% on the month and 27.4% on the year, and the energy index was up 16.3% year on year, per the BLS August release. Core was calmer at +0.3% and 2.4%. That is the detail to focus on: this is an energy-led headline, not a broad overheating. In the euro area the energy component was worse. Inflation was 3.3% in August with energy inflation at 14.3%, the figures the ECB cited when it raised rates on September 10.
So two of the biggest central banks looked at a supply shock they cannot fix and hiked anyway. The ECB lifted its deposit rate 25 basis points to 2.5% on September 10, and Lagarde warned headline inflation would stay well above target for an extended period. Six days later the FOMC voted 12-0 to raise the federal funds range by 25 basis points to 3.75 to 4.00%. The statement did not mention energy. It said inflation remains elevated. Our write-up of the September FOMC covers the decision itself.
The chain, in order. Oil rises, headline inflation rises, central banks hike, and the currency of the bank that hikes harder and faster gains. That last step is why a Fed hike can beat the terms-of-trade benefit to Canada. Oil reaches the currency market through the policy rate far more often than through the trade balance.
3. USD/CAD: the pair where the rule gets tested
The rule says oil up, loonie up, USD/CAD down. Here is what happened in September.
On Monday September 14, Brent jumped above $108. USD/CAD went the wrong way for the rule, rising to about 1.392, a 12-day high for the pair, from 1.3862 on Friday. Reuters-sourced reports put the odds of a Fed hike that week near 90%, and the dollar index rose nearly 0.4% as investors bought the haven. Canadian inflation did not rescue the loonie. It held at 3.0% in August, but the Bank of Canada’s median and trimmed-mean measures sat at 2.0% and 1.9%, so there was no case for the BoC to hike alongside the Fed.
By September 23 the pair was near 1.4085 with Brent at $103.08. USD/CAD had started the month near 1.3750, the September 8 low. That is a 2.4% move against Canada in about two weeks, with oil above $100 the whole time.
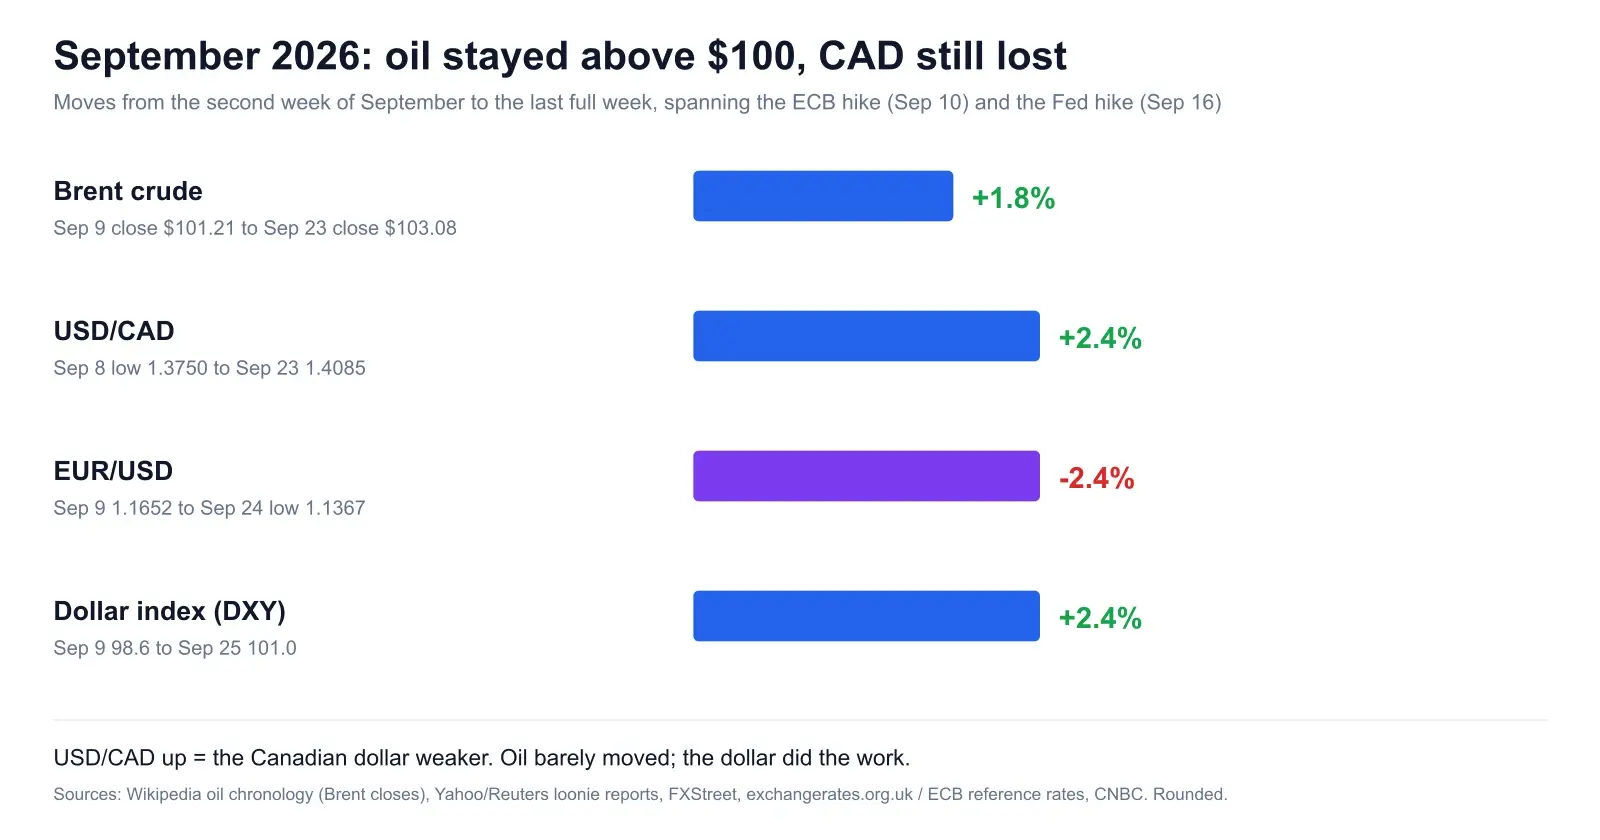
Most oil-and-FX commentary skips this. The oil level is not the signal. Oil relative to what the dollar is doing is the signal. When the dollar index rallies 2.4% in about two weeks, USD/CAD rises whatever crude is doing. Our explainer on why the dollar is strong in 2026 goes through that backdrop, and the correlation guide shows how to check a pair’s oil beta against its dollar beta before you size a trade.
4. USD/JPY and EUR/USD: the importers
The importer story is cleaner on paper and messier in practice, because both currencies have a second driver that can override oil.
USD/JPY
Japan imports nearly all its energy, so a $100 barrel widens its trade deficit and weighs on the yen. That is the structural reason USD/JPY has stayed near the top of its range, and we looked at the longer trend in why the yen keeps falling. On September 29 USD/JPY held a narrow range near 157.4 in Asia while Finance Minister Satsuki Katayama again said an undervalued yen was a concern, per the BabyPips daily recap.
The yen is also a haven, so it pulls in two directions. In a risk-off flush driven by a Hormuz headline, the haven bid and the terms-of-trade penalty fight each other, and the dollar decides the winner. When US yields rise, as they did in September, the yield gap beats the haven and USD/JPY drifts up. When oil spikes on its own and US yields fall, you can get yen strength. Read the US 10-year before the oil screen.
EUR/USD
The euro should have had a decent September. The ECB hiked, and euro-area energy inflation was 14.3%. It did not. EUR/USD fell from about 1.165 on September 9 to a low of 1.1367 on September 24 and sat near 1.137 on September 29, about 2.4% lower. Europe was the weaker side of the same shock: it imports the energy, its growth outlook was the one being marked down, and the ECB would not commit to a path beyond 2.5%. The Fed’s hike came with a more hawkish dot plot, per StoneX’s same-day commentary, and that gap in conviction is what repriced the pair.
A central bank hiking into an energy shock is not automatically bullish for its currency. A hike the market reads as a growth risk is a different animal from one it reads as credible inflation fighting. The euro has been the former. Our News Impact analysis scores that distinction when it ranks pairs for the session.
5. INR and NOK in one paragraph each
INR. India is the cleanest large importer in the group. Higher crude widens the current account deficit and tends to push the rupee weaker, and the Reserve Bank of India tends to smooth the path with intervention rather than let moves turn disorderly. If you trade USD/INR, the sign is reliable and the size is dampened by the central bank, so expect slow grinding moves rather than gaps.
NOK. Norway is the cleanest exporter and the least liquid. It tends to follow Brent with a short lag but is hit hard by any European risk-off, since it trades like a small high-beta currency. In a pure supply shock it is the best expression of the oil trade. In a global risk-off it is among the first things sold. Retail platforms usually quote USD/NOK with wide spreads, which makes it a swing trade rather than an intraday one.
6. Oil versus gold
Oil and gold both sound like war trades, and in a sudden escalation both can spike together. The link breaks after that first move.
Oil feeds inflation, inflation feeds rate hikes, and rate hikes lift real yields, which is what caps gold. That is why gold can sit still or fall while Brent holds above $100. The war supports the haven bid, and the response, central banks hiking, pulls the other way. We walked through that tension in the gold forecast. For an FX trader, gold works as a regime tell. Oil up, gold up and the dollar down is a fear-and-inflation tape. Oil up, gold flat or down and the dollar up is a rate-repricing tape, and the dollar pairs are the trade.
7. When oil up does not mean CAD up
The rule fails in a small number of repeatable situations, and all of them were live in September.
The Fed is the hawk. If US rates are rising faster than Canadian rates, the yield gap in favour of the dollar outruns any terms-of-trade gain. The Fed went to 3.75-4.00% while the BoC had not moved.
Risk-off with a haven dollar. A Hormuz scare moves oil and the dollar together. If the dollar index is up 0.4% on the day, USD/CAD usually goes up with it, because CAD also trades as a risk currency alongside equities.
The cause is a growth shock. Oil spikes from a demand surge are good for CAD. Oil spikes from a war also hit global growth, and CAD is a growth-sensitive currency. Same price, different cause, different sign.
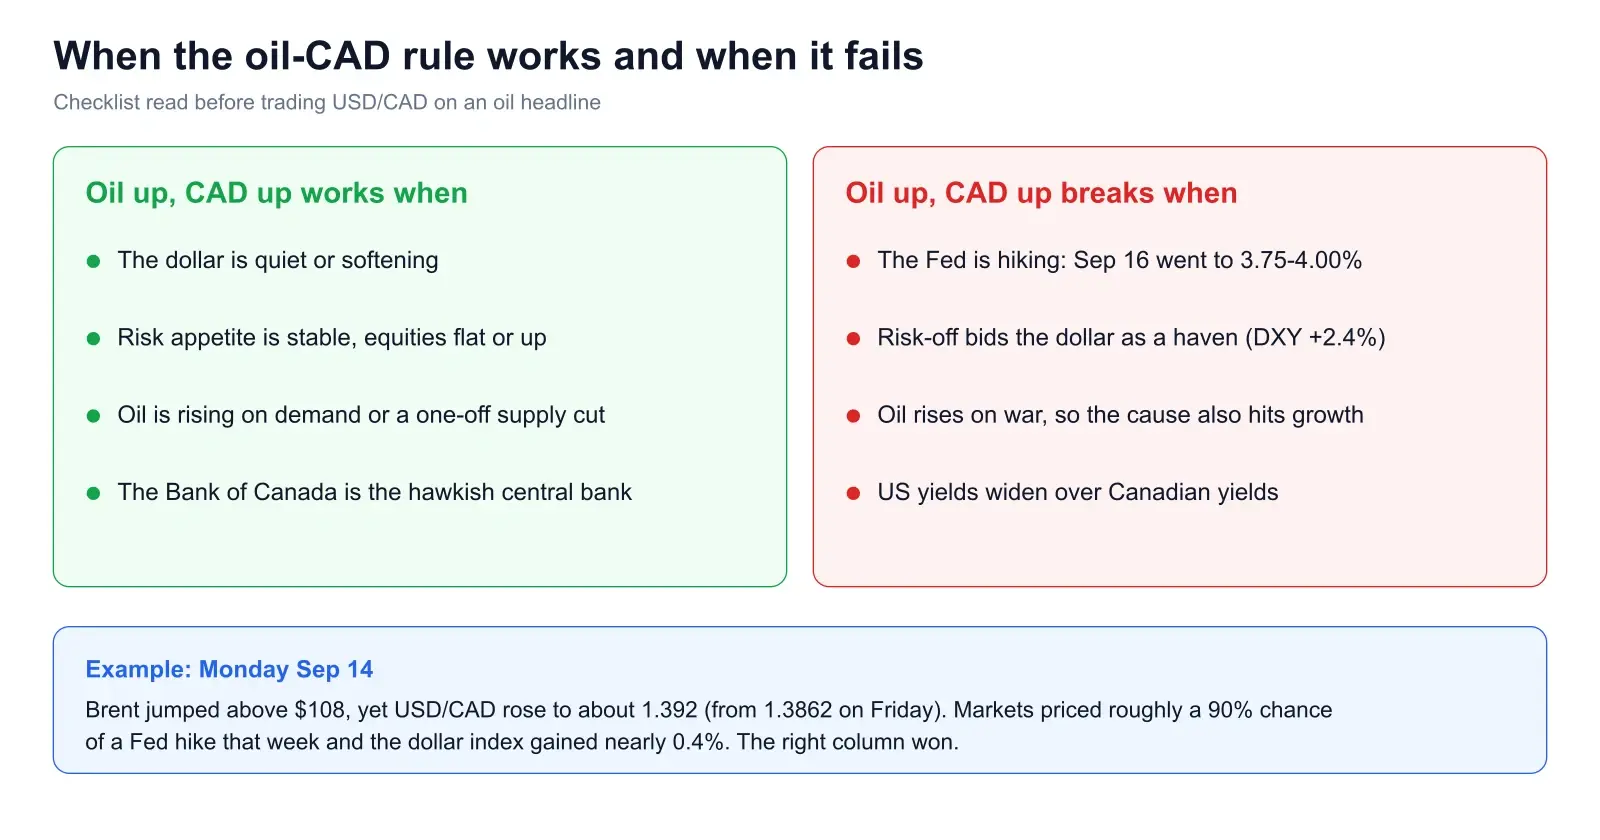
None of this kills the oil link. It makes oil a modifier. On days the dollar is quiet, the link works and is worth trading. When the dollar moves, trade the dollar and let oil confirm.
8. How to read EIA inventory data as a forex trader
The EIA’s Weekly Petroleum Status Report lands Wednesdays at 10:30 ET. It is the one scheduled oil event retail FX traders can plan around. Here is how to read it without overrating it.
Headline crude change versus expectations. As with CPI, the surprise is what counts. Commercial crude stocks excluding the Strategic Petroleum Reserve fell 0.6 million barrels to 423.4 million in the week ending September 11, about 1% above the five-year average, per EIA’s weekly summary. A draw smaller than expected is not an oil event. A draw of several million against expectations of a build is.
Gasoline and distillate stocks and product supplied. With energy inflation the policy problem, product stocks and implied demand feed the CPI debate more directly than crude does. A big gasoline draw when pump prices are already the main driver of headline CPI gets noticed by rate traders.
Cushing, refinery utilisation, exports. Cushing is the WTI delivery point, so it moves WTI more than Brent, and Brent is the benchmark that matters for CAD and the importers. Exports matter more than usual while Gulf barrels are constrained.
Honest limit. With roughly a fifth of the world’s oil normally moving through the Strait of Hormuz, one US inventory report is second-order. A one-million-barrel surprise will not move USD/CAD if a tanker gets hit overnight. Treat EIA as a confirmer of the oil move and a second-tier volatility event. Give Hormuz and OPEC+ headlines the weight.
9. Trading Hormuz and OPEC headlines
Headlines in this market are binary, and they reverse. April shows how violent that gets. Brent closed at $94.75 on April 8, down more than 13% on a ceasefire announcement, and by April 29 it was at $118.03 after a US blockade announcement. Statements, not data, moved the tape that far in three weeks.
Three rules help. First, wait for the dollar to pick a side before you trade the currency. A headline moves oil first and FX second, and the second move often reverses the first once the dollar reacts. Second, prefer the pair with the cleanest second-order effect: a ceasefire lowers oil and the haven bid, which is a fast USD and JPY sell, while the CAD move is slower and noisier. Third, decide your invalidation in advance. If USD/CAD makes a new high while Brent is also higher, the dollar is in charge and your oil-CAD trade is wrong.
OPEC+ matters less than it used to, because the binding constraint this year is physical access to the strait, not quotas. Treat an OPEC+ meeting as a calendar event for the oil price and treat Hormuz as the regime. Our guide to high-impact news events explains how to size around scheduled releases, and a trading journal is where you record which headlines you traded and whether the dollar agreed with you.
10. A practical checklist for the week
As of September 29, Brent is around $100 (intraday $100.19 against a $103.08 close on September 23), the dollar index is near 101.4, EUR/USD near 1.137, USD/JPY near 157.4 and USD/CAD around 1.40 (1.4085 on September 23). The Fed and the ECB have both hiked and neither has pre-committed. In that setup:
- Anchor on the dollar. Decide whether it is in hawkish-policy mode or panic mode before you map any oil move to a pair.
- Lean on importers for oil-up trades while the Fed leads. USD/JPY and short EUR/USD have been cleaner expressions in September than long CAD.
- Use exporters for oil-up trades only when the dollar is soft. Look for the dollar index flat or falling on the day before buying CAD or NOK on a crude spike.
- Do not fade Hormuz headlines blindly. A ceasefire headline took 13% off Brent in a day in April and the move was more than reversed within three weeks.
- Log it. Record the oil move, the dollar index move and the outcome in the same row so you can see your own hit rate by regime.
For a second look at the chart before you act, the Chart Snipe tool will read a screenshot of USD/CAD or USD/JPY and return the pattern, trend and risk guidance. It does not know your oil view, which is the point.
Frequently asked questions
Which currencies are most sensitive to oil prices?
Canada and Norway are the two best-known exporter currencies in the G10, so CAD and NOK are the ones most traders associate with rising oil. On the importer side, JPY and INR are the most exposed, followed by EUR. In practice, sensitivity changes with the regime: when the dollar is moving hard, the dollar leg of the pair explains more than oil does.
Why did the Canadian dollar fall in September 2026 when oil was above $100?
Because the dollar rallied harder. The Fed raised rates to 3.75-4.00% on September 16, the dollar index rose roughly 2.4% between September 9 and 25, and the Bank of Canada was not hiking with core inflation measures near 2%. USD/CAD rose from about 1.375 to about 1.4085 between September 8 and 23.
Does higher oil always strengthen the Canadian dollar?
No. It helps when the dollar is quiet and risk appetite is stable. It fails when the Fed is the more hawkish central bank, when risk-off bids the dollar, or when oil is rising because of a war that also hurts global growth.
How should I trade EIA inventory reports?
As a confirmer, not a primary driver. Compare the crude change to expectations, check gasoline and distillate, and remember that a surprise of a few million barrels matters far less than a Hormuz headline. The report lands Wednesdays at 10:30 ET.
Why did EUR/USD fall when the ECB hiked?
The market read the hike as a response to an energy shock that weakens European growth, not as a sign of strength, and the Fed hiked six days later with a more hawkish dot plot. EUR/USD fell from about 1.165 on September 9 to 1.1367 on September 24.
Sources & further reading
- → U.S. EIA: Weekly Petroleum Status Report. The primary source for US crude, gasoline and distillate inventories.
- → Federal Reserve: FOMC statement, September 16, 2026. The 25bp hike to 3.75-4.00%, voted 12-0.
- → European Central Bank: monetary policy decisions, September 10, 2026. The 25bp hike to a 2.50% deposit rate.
- → BLS: Consumer Price Index, August 2026. Energy, gasoline and core detail.
- → CNBC: ECB hikes to 2.5%. Euro-area energy inflation at 14.3% and Lagarde’s comments.
- → Bank of Canada: policy interest rate. The Canadian side of the rate gap.
- → Trading Economics: Brent crude oil. Price history for checking the closes quoted here.
- → 2026-2028 world oil market chronology. Dated Brent closes used for the chart.
See which side of the oil shock the dollar is on
News Impact ranks 12 instruments before each session and writes out why, including whether oil, the Fed or risk appetite is running the dollar that day. Check the bias, then check your chart.