
Silver Halved in Six Months. Is It a Buy?
Silver went vertical into January, printed a record above $100, then handed back roughly half to trade in the $60s. That round trip is silver being silver — a higher-beta, thinner cousin of gold that overshoots in both directions. Whether the correction is a setup depends on three things, and the honest answer is not a slogan.

If you bought silver in December 2025 and sold at the January top, you roughly doubled your money in weeks. If you bought that top, you are down close to half. Same asset, same six-month window, opposite outcomes — and that is the single most important thing to understand before you treat a “50% off” sticker as a buy signal. Silver did not do anything unusual for silver. It did what it always does: it followed gold, then it exaggerated the move in both directions.
The metal was up more than 100% year-to-date at the January peak. It has since corrected back into roughly the $60s. The question is not whether silver is “cheap” — cheap relative to what? — but whether the three drivers that actually set its price are lining up for the next leg. Those are the gold/silver ratio, real yields, and industrial demand. Get those right and the chart follows.
We will lay out the bull case and the bear case without flinching from either, look at what the major forecasters actually published, and finish with how to trade an instrument that moves harder than gold. Throughout, the tool referenced is ChartSnipe — a research co-pilot for reading the chart and scoring the macro, not a signal service that tells you to buy.
Key Takeaways
- →Silver's round trip — up 100%+ to above $100, then back to the $60s — is a momentum unwind, not a broken thesis. The long-term drivers are still intact.
- →Silver has a higher beta than gold: it rises more in rallies and falls more in corrections because the market is smaller and half its demand is industrial.
- →The gold/silver ratio is a compass, not a trigger. It frames whether silver is cheap relative to gold; price structure still decides the entry.
- →Forecasts are wide: JPMorgan near $81 average, UBS a possible $100 retest then mid-$80s, the bulls near $125. All above the $60s — but the spread tells you how uncertain this is.
- →If you trade it, size smaller than gold and give it wider stops. Silver punishes the lot size that felt fine on gold, let alone on EUR/USD.
1. The round trip — from $100 to the $60s
Silver spent most of 2025 as gold's quiet passenger, then caught fire. As gold ran to its own record near $5,600 in late January, silver went parabolic behind it, tacking on more than 100% year-to-date and printing an all-time high above $100 an ounce — a level it had never seen, clearing the old 1980 and 2011 spike highs decisively. For a few weeks the metal that traders love to call “poor man's gold” was the best-performing major asset on the board.
Then the tide went out. As real yields firmed and the dollar clawed back above 100 on the index, the speculative flow that had chased silver into three figures reversed just as fast as it arrived. By early June the metal was trading back in the $60s — roughly half the January peak. Nothing in that sequence requires a scandal or a demand collapse to explain. It is the classic shape of a blow-off top: a vertical move that outruns its fundamentals, then a correction that overshoots on the way down as the late money capitulates.
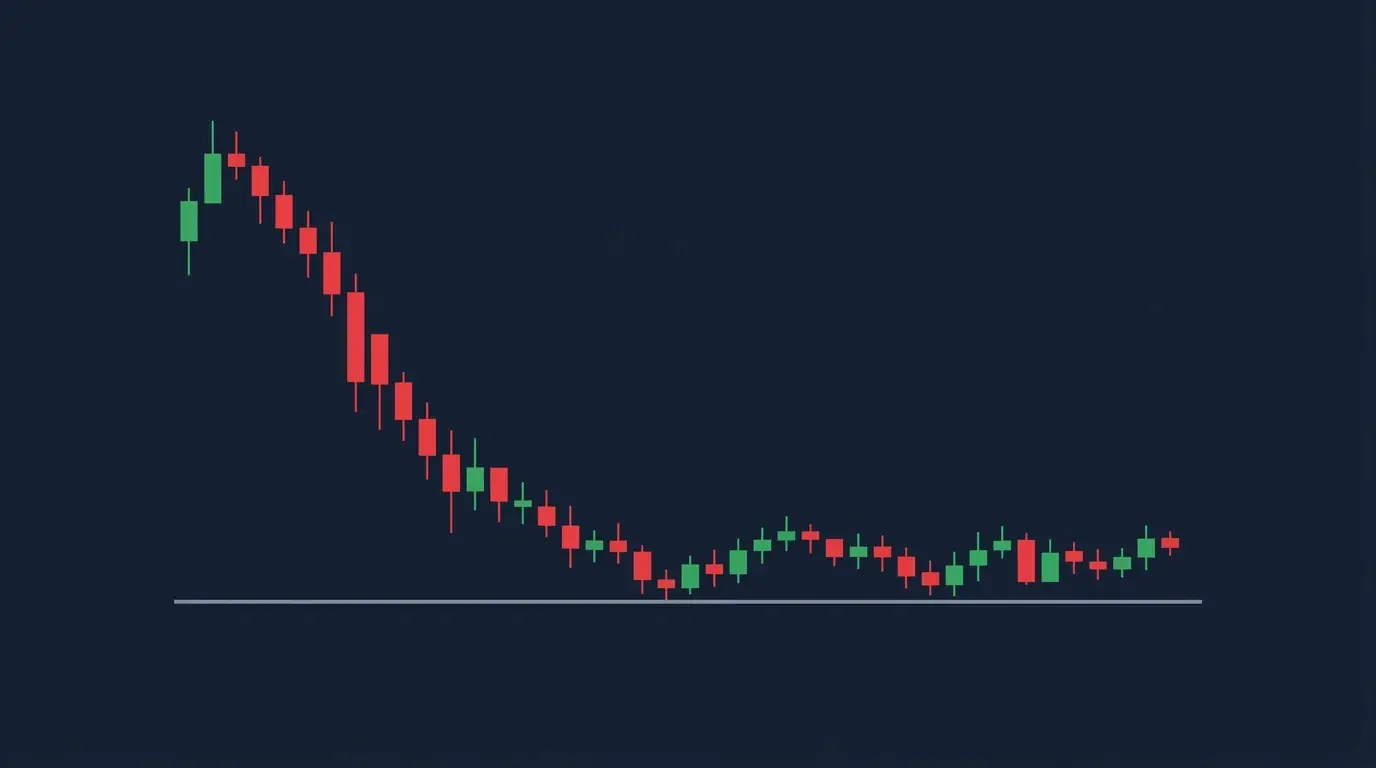
The useful frame is not “silver crashed” but “silver did a round trip.” The question a trader has to answer is whether the $60s are the base for the next leg higher or a way station to something lower. The chart below shows the shape you want to see if the bulls are right — a sharp drop that stops going down and starts building a range.
2. Why silver moves harder than gold
Silver and gold rhyme, but silver shouts. Three structural facts explain why it consistently out-swings gold in both directions, and understanding them is the difference between sizing a silver trade correctly and getting run over by an “ordinary” move.
The market is much smaller. The total value of above-ground silver and the daily dollar volume traded are a fraction of gold's. The same wave of buying that lifts gold a percent can push silver several, simply because there is less of it to go around and the order book is thinner. Thin markets move.
Half its demand is industrial. Unlike gold, which is mostly a monetary and jewellery metal, roughly half of silver demand comes from industry — solar panels, electronics, electric vehicles. That gives silver a second engine, but it also chains it to the industrial cycle. When growth expectations wobble, silver gets hit from a direction gold simply does not face.
It carries a higher beta. Put those together and silver behaves like a leveraged bet on the same macro forces that move gold. In a precious-metals bull run it tends to rise more than gold; in the correction it falls more. That is exactly what the January-to-June round trip showed. The same principle we covered for trading gold's volatility applies to silver, only more so.

3. The gold/silver ratio as a compass
The single most-quoted gauge in the silver world is the gold/silver ratio: how many ounces of silver it takes to buy one ounce of gold. When gold ran to $5,600 and silver only reached $100, the ratio sat wide — historically a sign that silver is cheap relative to gold and, more often than not, a precursor to silver playing catch-up. When the ratio compresses, silver has usually outperformed and the easy relative gains are behind it.
Here is the honest caveat most silver commentary skips: the ratio is a compass, not a clock. It tells you which direction is relatively cheap. It does not tell you when. The ratio can stay stretched for months or years while the metals grind, and plenty of traders have gone broke being “right” on the ratio at the wrong time. Use it to frame the trade — is silver cheap or expensive versus gold right now? — then hand the timing back to price structure and the macro read.

4. The bull case
The case for buying the correction rests on three legs, and they are genuinely sturdy.
Monetary demand has not gone away. The same forces that drove gold to a record — central-bank buying, a search for hard assets against sticky inflation, geopolitical risk — support silver as the higher-beta expression of that trade. If gold holds its uptrend, silver historically comes along, and with more upside per dollar.
Industrial demand is structural, not cyclical noise. Solar installation continues to grow, and each panel needs silver. Add electronics and vehicle electrification and you have a demand base that expands regardless of the monetary story. This is the leg gold does not have, and it is the reason many analysts think silver's floor is rising over time.
The supply side is tight. The silver market has run structural deficits — industrial and investment demand outstripping mine and recycling supply — for several years running. Deficits do not force an immediate repricing, but they load the spring. When investment demand returns to a market that is already short of metal, the move can be violent, which is precisely the kind of squeeze the most bullish forecasts are built on.
The bull owns these facts
- Structural supply deficit, multiple years running.
- Solar and electrification demand still growing.
- Wide gold/silver ratio — relative value.
- Most 2026 forecasts sit above the $60s.
The bear owns these
- Rate-sensitive with the Fed leaning hawkish.
- Industrial demand is a slowdown liability too.
- A blow-off top rarely bases on the first try.
- Late longs still trapped above current price.

5. The bear case
A good analyst can argue the other side just as hard, and right now the bear case has real teeth. Ignoring it is how you end up averaging down into a knife.
It is rate-sensitive, and the Fed is not cutting. Precious metals compete with the yield on cash. With the Fed holding at 3.50–3.75% and markets pricing high odds of no cuts in 2026 — and inflation prints keeping a hike on the table — the opportunity cost of holding a non-yielding metal is real. Firm real yields were exactly what ended silver's run in the first place.
Industrial demand cuts both ways. The same solar-and-electronics story that is a tailwind in an expansion becomes a headwind if global growth softens. Half of silver's demand is levered to the industrial cycle, so a growth scare hits it harder than gold. You cannot claim the industrial engine only when it helps.
Blow-off tops rarely base on the first attempt. A vertical move that doubles and then halves usually needs time — often months — to wash out the trapped longs before it can build a durable base. The stack of buyers who bought in the $80s and $90s becomes overhead supply, selling into every bounce to get back to break-even. That mechanic can cap silver well below its old high even if the long-term thesis is right.
The honest verdict: both cases are strong, which is why the trade is a sizing decision, not a conviction contest. You can be a long-term silver bull and still expect months of chop in the $60s first. Position for the thesis with size small enough to survive the bear case being right for a while.
6. How to actually trade silver's volatility
Everything above is context. This is the part that keeps you in the game. Silver's higher beta is not an abstraction — it shows up as bigger percentage moves against your account, and the traders who blow up on silver are almost never wrong about the story. They are wrong about size.
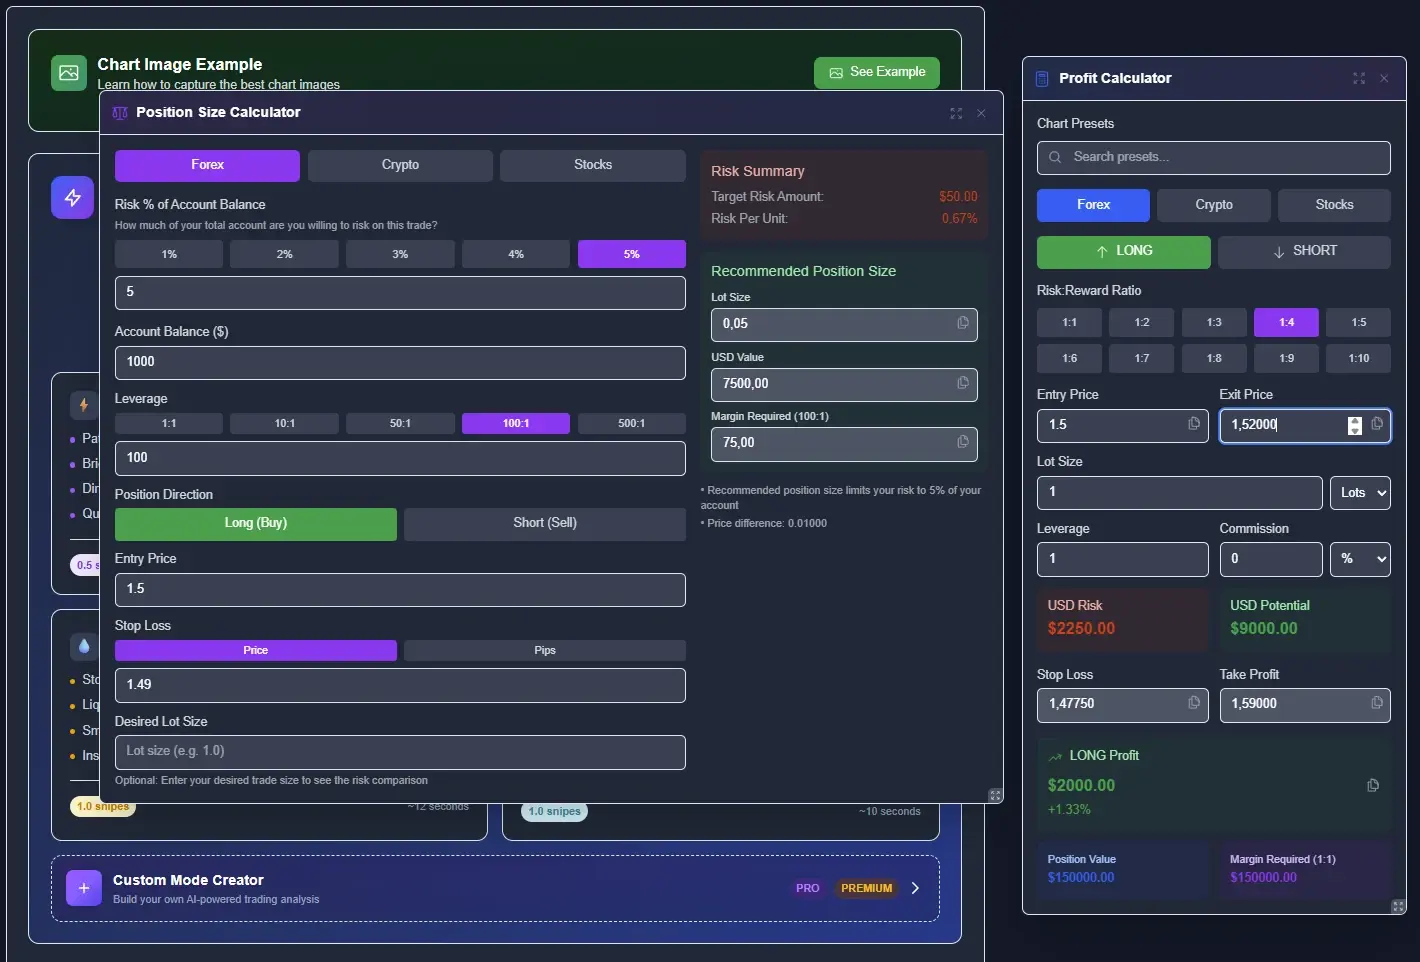
Size off silver's range, then cut it again. Take whatever lot you would run on gold for the same dollar risk, and reduce it, because silver's swings are proportionally larger. Set the stop where the idea is wrong — beyond the swing that invalidates the level — then let a position-size calculator hand you the lot. If the number feels uncomfortably small, that is the volatility being priced correctly, not a reason to override it. Our risk-reward worked examples show how the math holds together.
Trade the liquid window. Like gold, silver's cleanest moves land in the London–New York overlap when liquidity is deepest and US data lands. Thin sessions produce fake breaks that reverse the moment volume arrives. The same session logic from the best hours to trade gold maps almost directly onto silver.
Respect the correlation. Silver, gold, and the dollar move as a system. A long silver position is, in effect, a short-dollar and long-gold position wearing a different ticker — stacking all three is one bet, not three. The correlation guide covers how to avoid quietly quadrupling your exposure to the same macro driver.
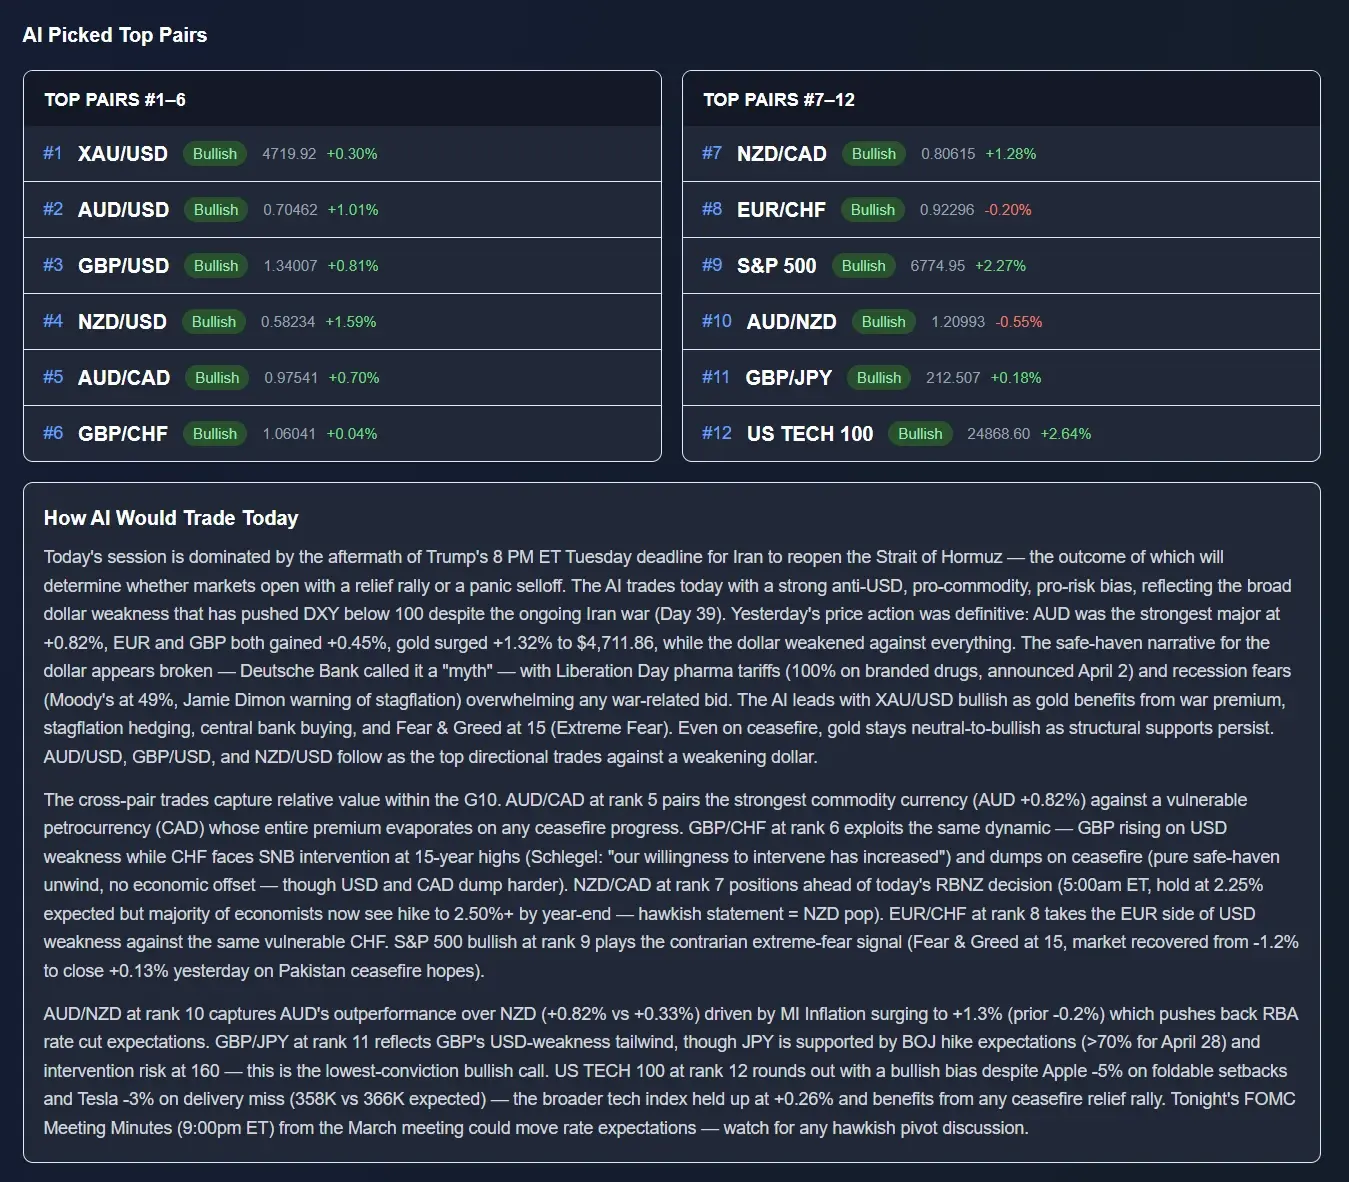
Before you take the position, know which side of the day's flow you are on. Silver reprices on the same inflation and rate surprises that move gold, so the macro read comes before the chart read. The Daily AI News Impact ranks silver and gold each morning with a conviction score and the drivers behind it, so you enter knowing whether your chart idea is trading with the macro or fighting it.
7. What the forecasts say vs the chart
The published targets for 2026 are all over the map, and that spread is itself a data point. JPMorgan pencils in roughly an $81 average for the year. UBS floats a possible mid-year retest of $100 before the metal settles into the mid-$80s. The most bullish desks — the ones building in a genuine supply squeeze — call for something near $125. Every one of those numbers sits above the $60s where silver was trading in early June, so the analyst consensus is unambiguously higher.
But look at the width of that range: from the low $80s to $125 is not a forecast, it is an admission that nobody knows. When the spread between reputable desks is that wide, it means the outcome hinges on variables — the Fed's next move, whether the industrial cycle holds, whether investment demand returns — that are genuinely unresolved as of June. Treat any single price target as one scenario, not a plan.
The chart is more modest and more useful. It does not know JPMorgan's model; it shows whether the $60s are holding as a base or leaking lower. That is the read that should drive your entries. Let the forecasts set the direction of the long-term bet and let price structure set the timing — the same discipline the gold volatility guide applies to sizing. A halved price is a reason to pay attention. It is not, on its own, a reason to buy.
Frequently asked questions
What is the silver price forecast for 2026?
Forecasts are unusually wide. JPMorgan pencils in roughly an $81 average for 2026. UBS sees a possible mid-year retest of $100 before the mid-$80s. The most bullish desks call for around $125 on a supply squeeze. All sit above the $60s of June — consensus is higher, but the disagreement on how much is enormous.
Why did silver crash in 2026?
It did not crash on bad news — it unwound its own blow-off. Silver ran 100%+ to a record above $100 in January on haven and monetary demand, amplified by its thin market. When real yields firmed and the dollar strengthened, the late speculative money exited fast and silver gave back roughly half. A momentum unwind, not a broken thesis.
Is silver a good buy right now?
It depends on timeframe and tolerance for volatility. The long-term case — supply deficits, solar and industrial demand, monetary hedging — is intact and most forecasts sit higher. But silver is rate-sensitive and moves harder than gold both ways, so a buy here is a high-conviction, high-volatility position that has to be sized small. Halved is a setup, not a guarantee.
What is the gold/silver ratio telling us?
It measures how many ounces of silver buy one ounce of gold. A high ratio has historically meant silver is cheap relative to gold and tends to precede silver outperformance; a low ratio the opposite. It is a compass, not a timing tool — it can stay stretched for months. Use it to frame relative value, then let price structure decide the entry.
Is silver more volatile than gold?
Considerably. Silver is a smaller, thinner market with a large industrial demand component, so the same flow that nudges gold can shove silver. It has a higher beta — rising more than gold in rallies and falling more in corrections. Practically, it needs smaller size and wider stops than gold, and gold already needs both relative to major FX pairs.
How do I trade silver's volatility?
Size off the current range, not gold's. Take the lot you would run on gold and cut it further, then set stops beyond structure so noise cannot clip you. Weight risk toward the London–New York overlap when liquidity is deepest, and check the day's macro read first — silver reprices hard on the same inflation and rate surprises that move gold.
Sources & further reading
Get the read before you size the silver trade
Live silver and gold pricing, a daily AI news-impact score, screenshot chart analysis, and a position-size calculator built for wide-range markets. Two free snipes to test it on your own chart.