
How to Trade Gold When It Swings 300 Pips a Day
Gold stopped behaving like the slow, steady safe haven the textbooks describe. Since the record near $5,600 in January, XAUUSD has been repricing hundreds of dollars a week. That is opportunity and a shredder in the same instrument. Here is how to trade it without the volatility trading you.
For most of the last decade you could set a 30-pip stop on gold, walk away, and be fine. That trader is getting stopped out on noise every session now. Gold ran to an all-time high near $5,600 an ounce in late January 2026 and has spent the months since giving a chunk of it back — not in a straight line, but in violent two-way swings that routinely cover 200 to 400 dollars in a single day. The instrument did not change. The regime did.
The traders who get hurt in a market like this are almost never wrong about direction. They are wrong about size. They carry the lot they used when gold moved 120 pips a day into a market that now moves triple that, and one ordinary retracement wipes a week of gains. Trading gold in 2026 is a sizing problem first and a chart-reading problem second. This guide walks through both, in that order.
The tool referenced throughout is ChartSnipe, used the way it is meant to be used — a research co-pilot that reads the chart and scores the news, while you own the size and the stop.
Key Takeaways
- →Size off the current range, not the old one. If gold's daily ATR tripled, your lot size has to shrink so a normal swing does not blow the risk budget.
- →Stops go beyond structure, then you size to the stop — never a fixed pip stop chosen to make the lot look big.
- →Trade the London–New York overlap (13:00–16:00 GMT). Most of gold's daily high and low form there; Asia is where good setups go to chop.
- →Know the calendar. Gold reprices hardest on US CPI, NFP, FOMC and geopolitical headlines. Size down or stand aside into scheduled events.
- →Use AI for the read, not the trade. An AI news-impact score tells you whether you are trading with or against the day's flow before you click.
1. Why gold's volatility exploded
You cannot size a trade correctly until you understand what you are sizing against. Gold's 2026 range is not random — it is the fingerprint of a market caught between two enormous, opposing forces. On one side, relentless safe-haven and central-bank demand carried the metal to its January record. On the other, firming real yields and a strong dollar pull it back every time risk sentiment steadies. When two forces that big fight over the same instrument, the price does not drift. It lurches.
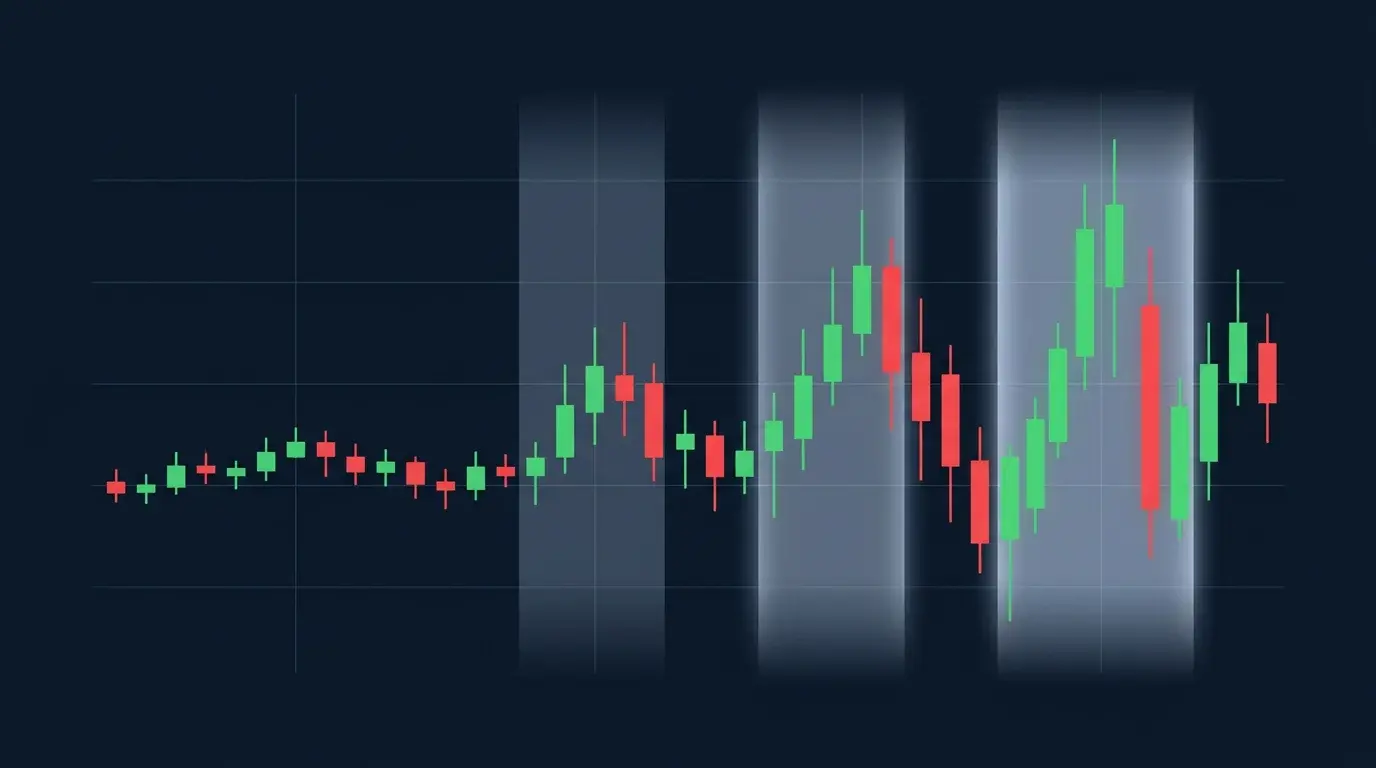
The practical consequence is that gold now behaves like a high-beta instrument wearing a safe-haven costume. A single US inflation print or a geopolitical headline can move it more in an hour than it used to move in a week. That is why the daily range roughly tripled off the old baseline. None of the technical tools you already know stop working — support is still support, a rejection wick is still a rejection wick — but the distances between them got much larger, and everything downstream of that (your stop, your lot size, your target) has to scale with it.

2. Sizing off ATR, not habit
Here is the single most important adjustment. Pull up the Average True Range on the daily and the timeframe you actually trade. ATR tells you, in dollars, how far gold typically travels in one bar. If daily ATR reads 350 when it used to read 120, your stop needs roughly three times the room it used to — and if your risk per trade is fixed, your position has to be roughly a third of the size. That is the whole equation. Risk stays constant; the lot flexes with the range.
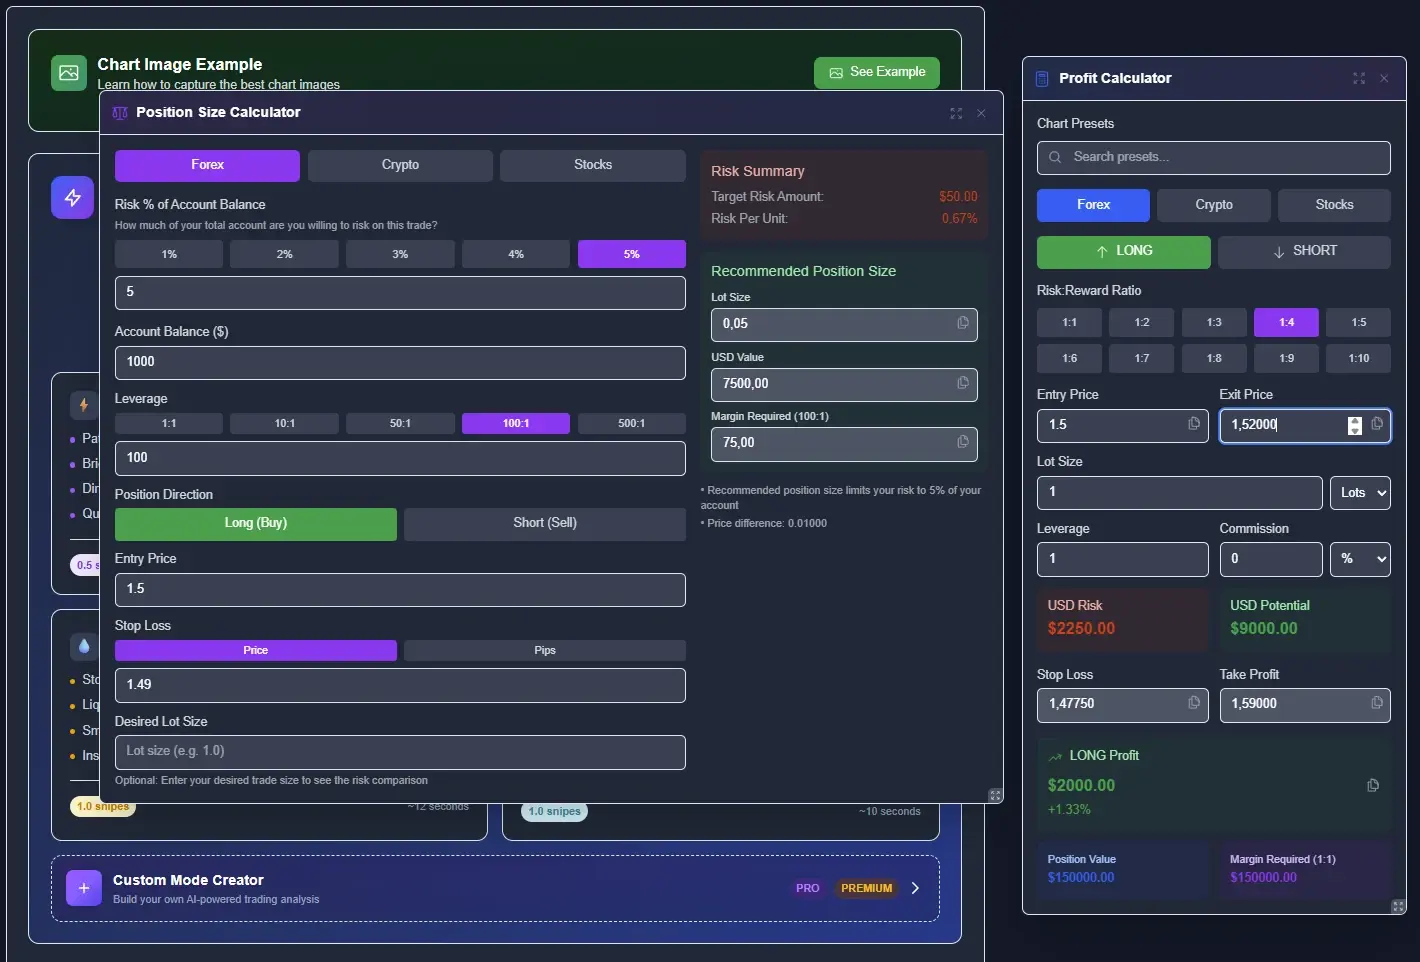
Concretely: say you risk 1% of a $10,000 account, so $100 per trade. If the setup's structural stop sits $30 away from entry, you can hold a larger position than if the stop sits $80 away. Feed entry, stop, and account into a position-size calculator and take whatever lot it returns — even when the number feels uncomfortably small. The discomfort is the volatility being priced correctly. Ignoring it is how a “high conviction” gold long turns into a margin call on an ordinary pullback.
3. Where the stop actually goes
A stop belongs at the price where your trade idea is proven wrong, not at a round number that makes the position size look nice. On a long off a support retest, that is below the swing low that formed the level. On a short into resistance, above the rejection high. The volatility regime does not change that principle — it just means the correct level is further away than your instinct wants it to be, and you compensate with size.
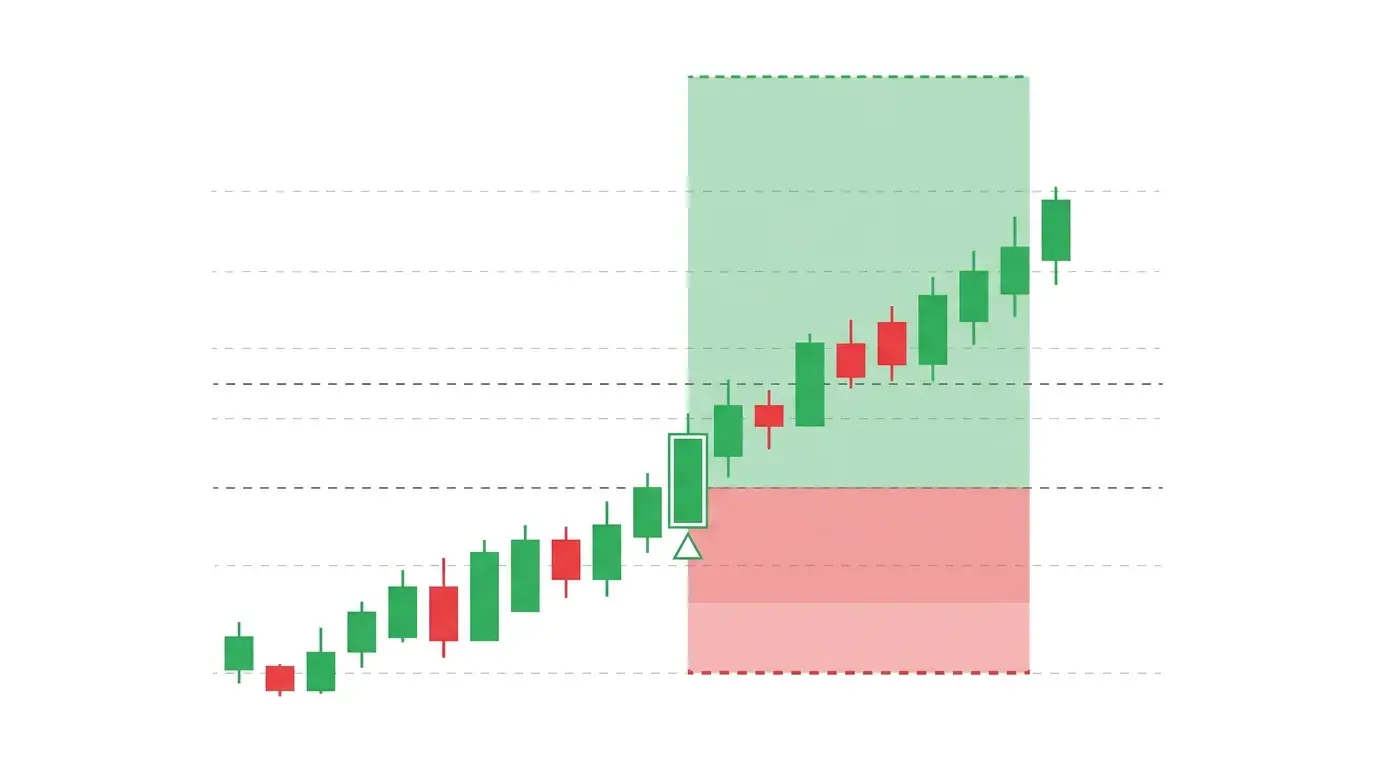
A clean way to formalise it: place the stop a small ATR multiple beyond the structural level so normal noise cannot clip you, then size to that full distance. The diagram below shows the shape — entry candle highlighted, a wide stop zone below at the level that invalidates the idea, and a target zone above sized to give a reward worth the risk. For the full framework across instruments, the stop-loss placement guide covers ten methods in detail.
Do
- Set the stop at structure, then size to it.
- Recheck ATR weekly — the regime keeps shifting.
- Take partials into the range; gold gives back fast.
- Stand aside for the first minutes of US data.
Don't
- Use a fixed 20–30 pip stop on gold in 2026.
- Add to a loser to “average in” a swing.
- Carry full size through CPI or FOMC.
- Confuse a big daily range with an easy market.
4. The session clock owns your entries
Gold's volatility is not spread evenly. The London open around 07:00 GMT brings the first real expansion, and the London–New York overlap from roughly 13:00 to 16:00 GMT is where the day's trend usually resolves — both major sessions live, US data landing, and the deepest liquidity of the day. A large share of gold's daily high and low prints inside that window. The Asia session, by contrast, is thinner and more prone to fake moves that reverse the moment London arrives.
The takeaway for a discretionary trader is simple: weight your risk toward the overlap and treat Asia-session breakouts with suspicion. A clean break at 03:00 GMT is not the same trade it becomes at 14:00 GMT, even on an identical chart. If you want the full session-by-session map of when each instrument moves, our forex session times guide lays it out, and there is a dedicated companion piece on the best hours to trade gold.
5. Read the news before the chart
Gold is a macro instrument. It does not care about your trendline if the US prints a hot inflation number — real yields jump, the dollar bids, and gold can drop $60 while your setup was “perfect.” That is why the read has to start with the calendar and the day's driver, not the candles. What is due during your session? Is the dollar bid or offered into it? Is today a risk-off tape where gold catches a haven bid, or a firm-yields tape where it gets sold?
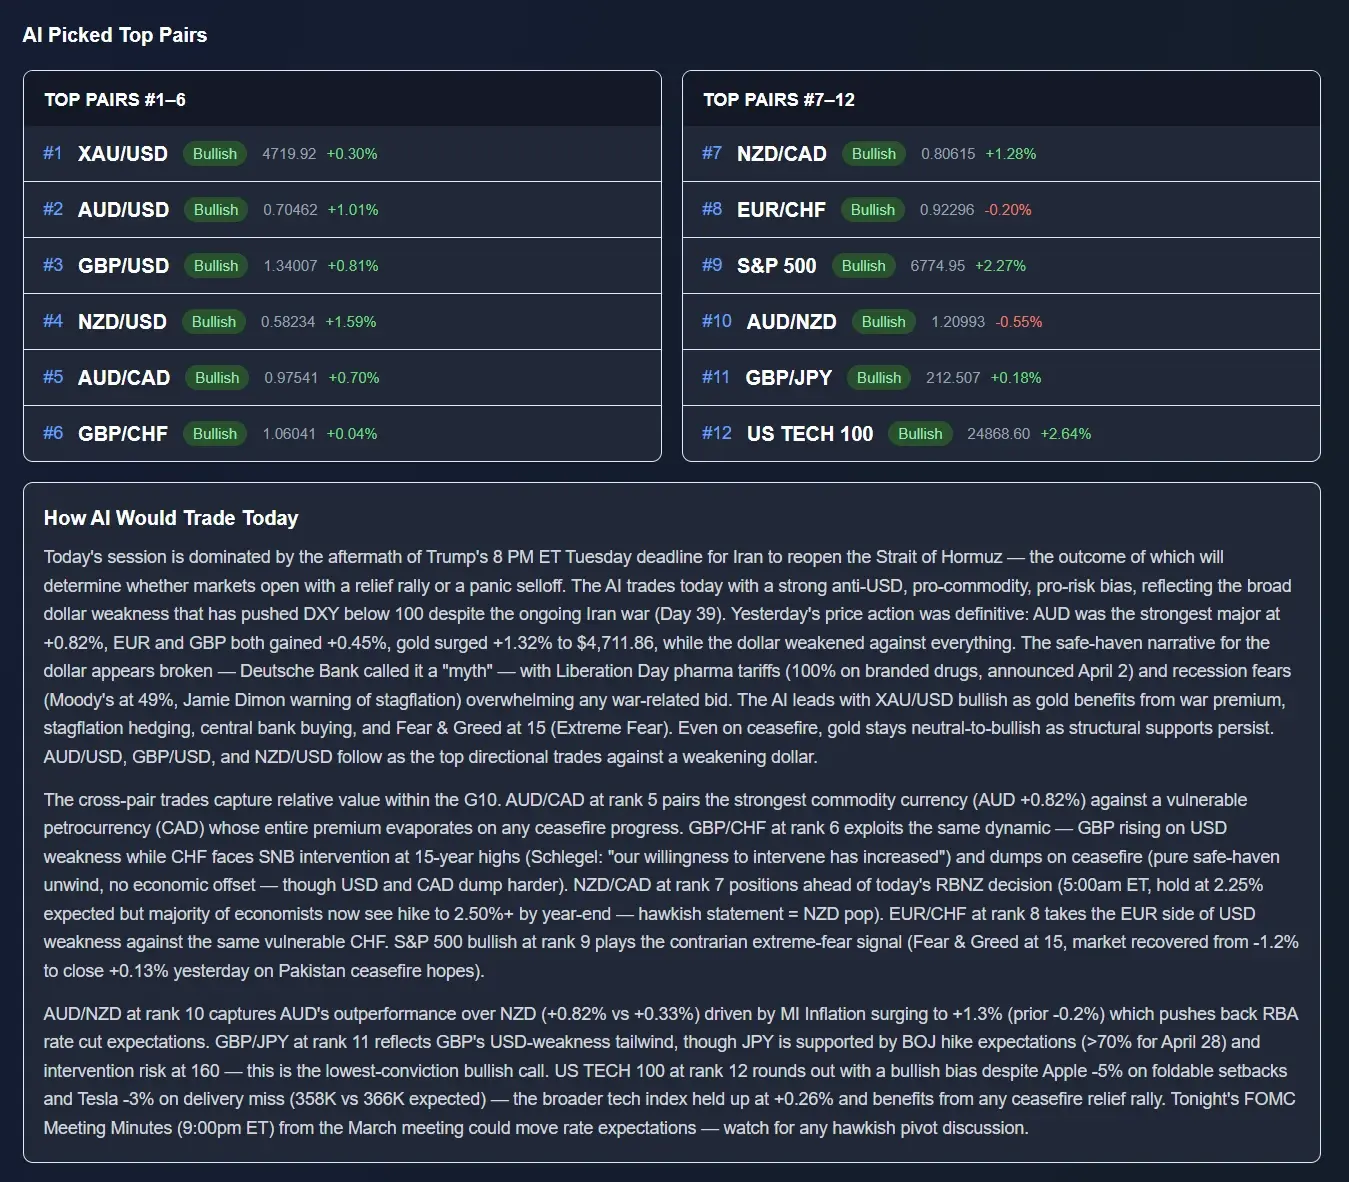
This is exactly what the Daily AI News Impact is built for. It ranks gold alongside the majors each morning with a conviction score and the specific drivers behind the call, so you enter the session knowing whether your chart idea is trading with the macro flow or fighting it. Fighting it is allowed — but only as a deliberate, smaller-sized fade, never by accident.
6. Four setups that survive the range
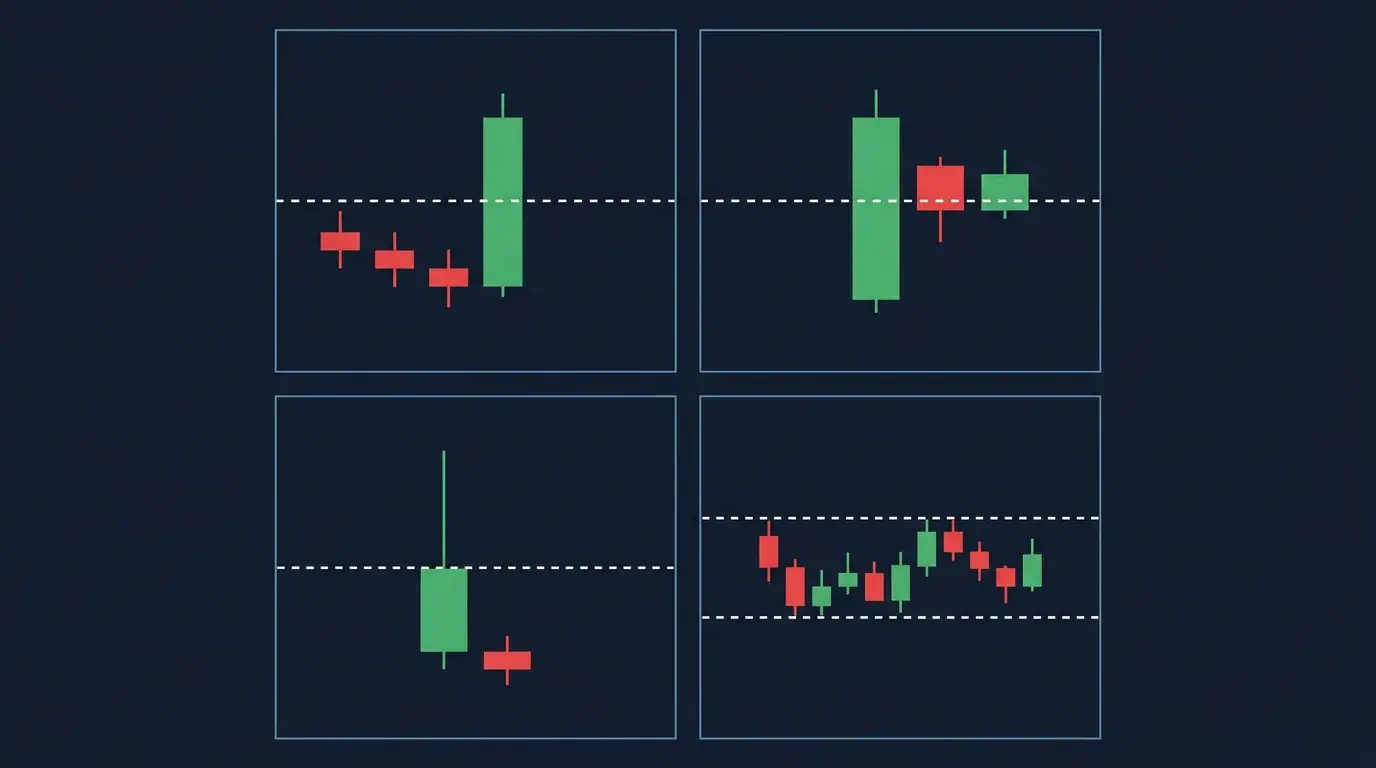
Not every setup works when the range is this wide. The ones that do share a trait: they either trade with a strong intraday trend or fade a clearly exhausted extreme — nothing in the mushy middle. Four cover most of the opportunity.
Overlap breakout with the trend
Gold coils through Asia, then breaks the range as London and New York overlap. When the break aligns with the day's macro read — dollar offered, risk-off bid — it is the cleanest trade on the board. Enter on the break or a shallow retest, stop back inside the range, target the next daily structure. The volatility that makes gold dangerous is the same volatility that makes these breakouts run.
Trend pullback to a moving average
In a strong directional move, gold pulls back to a fast moving average or a prior breakout level and continues. You are not calling the top or bottom — you are joining an established trend at a discount. Stop beyond the pullback swing, and let the wide range work in your favour on the continuation leg.
Exhaustion rejection at a daily extreme
After a fast, extended push into a major daily level, gold often prints a long rejection wick and snaps back. This is a fade, so it demands smaller size and a stop just beyond the wick. It works best when the move into the level was a news spike that over-extended — the kind the reversal-signals guide covers — and worst when it is a genuine trend day, where fading gets you run over.
Asia-range fade (carefully)
When there is no Asia-session catalyst, gold often oscillates inside a tight band and fades its own extremes. It is a real setup, but a fragile one: the moment London hits, the regime flips and the range breaks. Take the fade only with a hard rule to be flat before 07:00 GMT. Any fade position carried into the London open is a trade you have lost control of.
These are not signals. They are repeatable shapes that give you a plan. Edge comes from running the same four setups with consistent risk across hundreds of sessions — not from any single trade. Screenshot the chart, get the read, then decide.
7. The mistakes that blow gold accounts
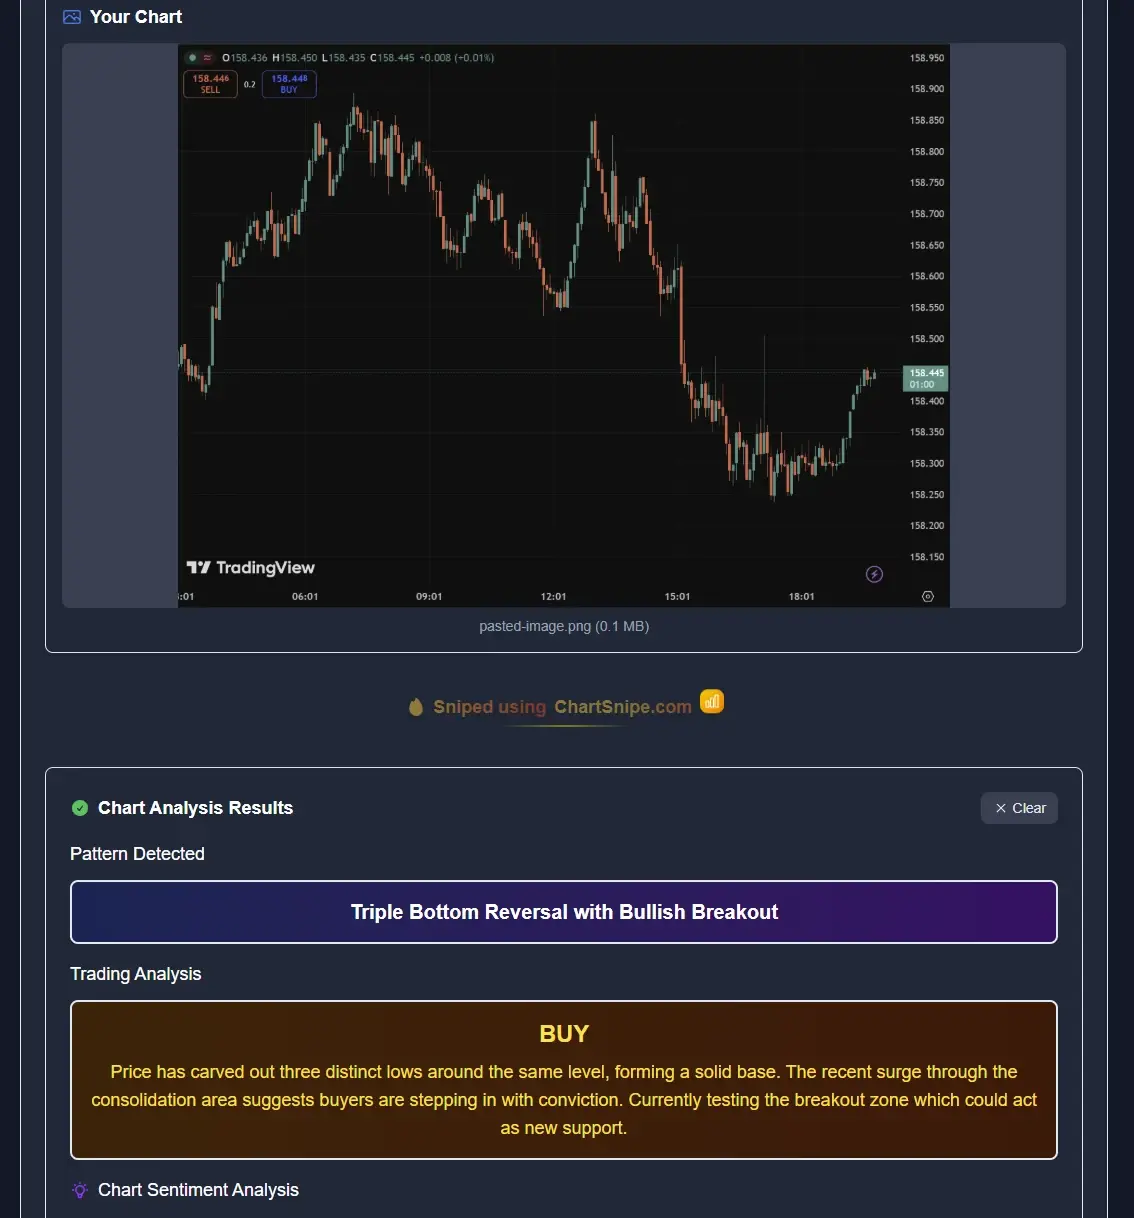
Almost every gold blow-up in this regime traces to one of four errors, and none of them is about reading the chart wrong.
Old-regime sizing. The most common and most lethal. Trading the lot size that made sense when gold moved 120 pips a day. Fix it with ATR-based sizing and a calculator, every trade, no exceptions.
Fixed pip stops. A 20-pip stop on gold in 2026 is a donation. It gets swept by the spread and normal noise before your idea has a chance. Stops go at structure or they do not go at all.
Trading through the news blind. Holding full size into a US inflation print because the chart looked good. The chart does not know the number is coming. Your economic calendar does.
Revenge trading the range. A wide range hands you fast losses, and fast losses trigger the urge to make it back on the next candle. That urge, not the loss itself, is what empties the account. A daily loss limit and a hard stop for the session are the only reliable cure.
Frequently asked questions
How many pips does gold move in a day?
Before 2026, XAUUSD often ran a 100–200 pip (dollar) daily range. Since the January blow-off near $5,600 and the correction that followed, 200–400 pip days are normal and event days can print far more. Size to that range, not to what gold used to do.
What is the best time of day to trade gold?
The London–New York overlap, roughly 13:00–16:00 GMT, when both sessions are live and US data lands. The London open at 07:00 GMT is second. Asia is thin and range-bound. Most of gold's daily high and low form in the overlap.
How should I set a stop loss on XAUUSD?
Put it beyond the swing that invalidates your setup, then size the position so that distance equals your fixed dollar risk. In this regime that means a wider stop and a smaller lot. Fixed 20–pip stops get swept by normal noise.
Is gold good for beginners in 2026?
Gold trends cleanly, but the current volatility punishes oversized positions hard. A beginner can trade it with small fixed risk, a structural stop, and calendar awareness — but not with the lot size they would use on EUR/USD.
Why is gold so volatile in 2026?
It ran to a record near $5,600 in January on haven and central-bank demand, then corrected as real yields firmed and the dollar strengthened. Add geopolitical headline risk and a hawkish Fed, and every macro surprise reprices it violently.
Can AI help me trade gold?
For the research half, yes — reading the chart, scoring the day's news impact on gold, flagging the levels that matter. It cannot size the trade or hold your stop. Used as a co-pilot rather than a signal service, it speeds up the read so you start the session with a plan.
Sources & further reading
Get the read before you size the gold trade
Live XAUUSD pricing, a daily AI news-impact score for gold, screenshot chart analysis, and a position-size calculator built for wide-range markets. Two free snipes to test it on your own chart.