
Can Gold Climb Back to $5,000?
Gold made a record near $5,600 in January, then gave back more than a quarter of it. By mid-July it trades in the low $4,000s. The road back to $5,000 is real — but it runs through the dollar, real yields, and the Fed, none of which are cooperating yet. Here is an honest, two-sided read.

On January 29, 2026, gold printed an all-time high around $5,595 an ounce. It was the culmination of a two-year run that most desks underestimated the entire way up. Then it broke. By the middle of July the metal changes hands in the low $4,000s — roughly $4,100 to $4,200 — a correction of more than 25% from the peak. That is a bear market by the textbook definition, inside what is still, structurally, a bull market. Both things are true, and holding them at once is the whole job here.
So can gold climb back to $5,000? Honestly: yes, plausibly, but not automatically. Some serious houses think it prints far higher — J.P. Morgan has carried a year-end target near $6,000 and a path toward roughly $6,300 into 2027. Others point at a dollar back above 100 on the DXY and firm real yields and see a metal that stays capped for months. Both cases are credible. Anyone selling you a clean number with a date attached is selling certainty that does not exist. What we can do is lay out what has to happen for each path, and how to trade the uncertainty instead of pretending it away.
Throughout, the tool we lean on is ChartSnipe — a research co-pilot for reading the chart and scoring the day's macro flow, not a crystal ball. This is a forecast piece. For the mechanics of actually executing gold trades, see the companion guide to trading gold volatility.
Key Takeaways
- →Gold peaked near $5,595 on January 29, corrected more than 25%, and trades in the low $4,000s by mid-July 2026. That is a bear correction inside a structural bull.
- →The bull case (J.P. Morgan targets near $6,000 by year-end) needs the dollar to peak, real yields to roll over, the Fed to pivot, and central-bank buying to persist.
- →The bear case is simple and live right now: a DXY above 100 and firm real yields raise the cost of holding a metal that pays nothing.
- →Central-bank accumulation and a geopolitical risk premium are the two pillars holding the floor up. Watch those, not the daily candle.
- →You do not need the number. Trade the levels that confirm each scenario, size off current volatility, and let the market pick the branch.
1. The round trip from $5,600
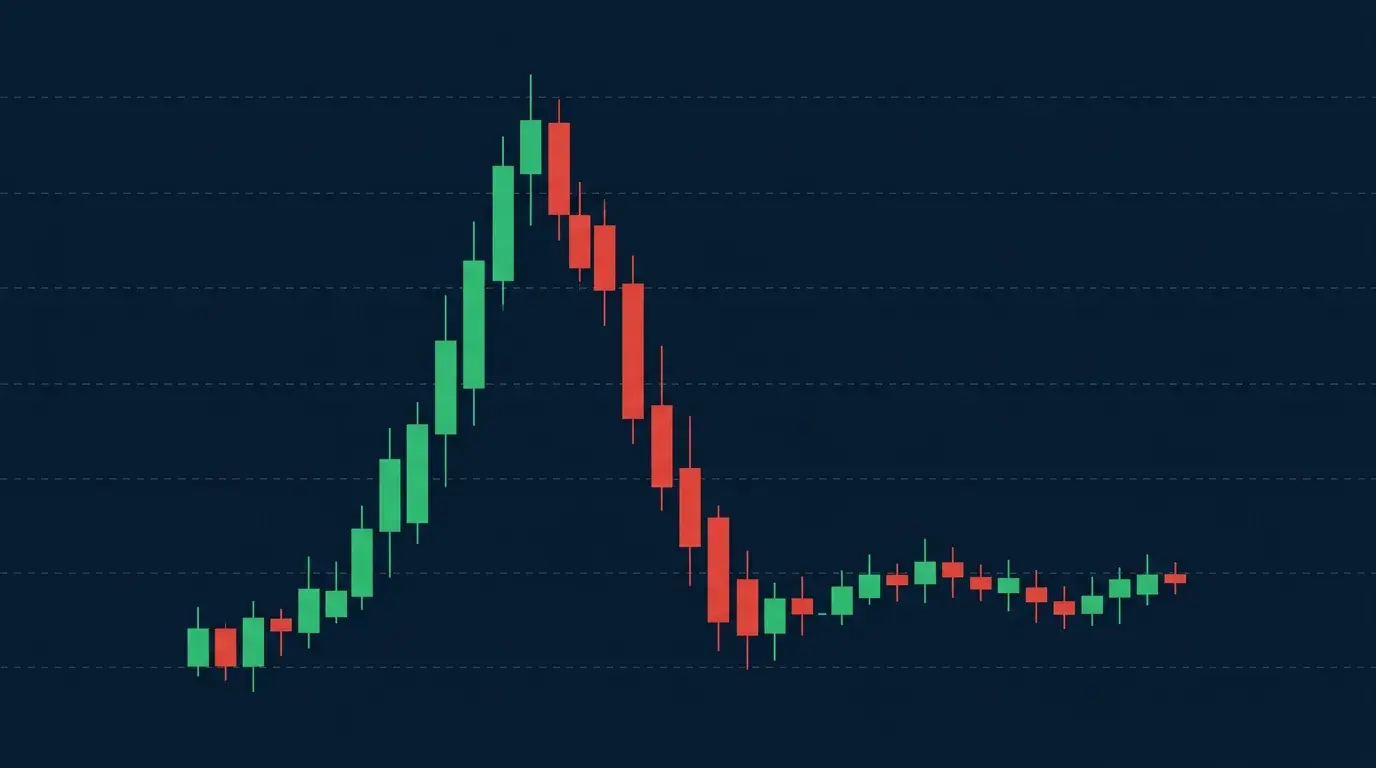
Every big commodity move ends up looking like the same shape on a long-enough chart: a grinding climb, a vertical blow-off, a violent correction, and then a base. Gold is somewhere in the fourth act. The push into late January had the hallmarks of a climax — accelerating slope, retail piling in, front-page coverage, and price detaching from the yield and dollar backdrop that normally anchors it. When an asset stops respecting its own fundamentals on the way up, the reckoning is usually close.
The correction that followed was not a gentle mean-reversion. Gold shed more than a quarter of its value over roughly five months, in the same two-way lurches that have defined the whole regime. That kind of drawdown flushes leverage, resets sentiment, and — crucially — does not by itself invalidate the multi-year uptrend. The metal is still multiples above where it traded two years ago. What the round trip did was take the froth off the top and hand the market back to the structural buyers, who never had to chase.
2. Where gold sits now
As of mid-July 2026, XAUUSD trades in the low $4,000s, roughly $4,100 to $4,200. That is about 25% below the January high and, depending on the week, near the middle of the range the correction has carved out. Price is no longer in freefall; it has spent recent weeks chopping rather than trending, which is what basing looks like in real time before you know whether it is a bottom or a pause.
The backdrop is unhelpful for bulls in the short term and that matters for framing. The dollar has climbed back above 100 on the DXY, its highest in over a year, and US real yields are firm because inflation has re-accelerated and the Fed has shifted from an easing bias toward holding — even flirting with hikes. For a $5,000 argument to be more than hope, that macro picture has to start turning. It has not yet. So the honest starting position is neutral-to-cautious, with a structural bull bias that only activates when the dollar and yields roll over. If you want the dollar side of this in depth, we broke it down in why the US dollar is so strong in 2026.
3. What drove the record — and what reversed it
Gold's run to $5,600 rested on three legs. First, relentless central-bank buying — official-sector demand that is price-insensitive and reserve-driven rather than speculative. Second, a safe-haven bid from geopolitical stress and a de-dollarisation narrative. Third, and most important for the timing of the top, an expectation that the Fed would keep cutting and real yields would keep falling. Falling real yields are rocket fuel for a non-yielding asset, because they shrink the opportunity cost of owning it.
The third leg is the one that broke. US inflation firmed through the first half of 2026, the Fed stopped cutting and started signalling it might hike, and real yields rose instead of falling. The dollar strengthened alongside. Two of gold's three pillars — central banks and geopolitics — stayed largely intact, which is why the correction stopped in the $4,000s rather than collapsing further. But the rate leg flipping from tailwind to headwind was enough to end the parabola and force the repricing. Understanding which leg broke is what lets you judge whether it can mend.
The one relationship to internalise: gold trades inversely to real yields more reliably than to almost anything else. When the market prices the Fed cutting into falling inflation, real yields drop and gold tends to run. When it prices hikes into sticky inflation, real yields rise and gold struggles — regardless of how bullish the long-term story sounds.
4. The bull case for a return to $5,000+
The bull case is not a fantasy — it is a specific chain of events, and each link is plausible. It goes like this: the dollar tops out as the rest of the world catches up on growth and the DXY's rate advantage narrows; US inflation finally cools enough that the Fed can stop threatening hikes and eventually pivot back toward cuts; real yields roll over; and the two pillars that never left — central-bank accumulation and the geopolitical premium — do the rest. Put those together and $5,000 is not a stretch. It is roughly a 20% move off the low $4,000s, the kind gold has delivered repeatedly in this cycle.
This is broadly the logic behind J.P. Morgan's year-end target near $6,000 and its path toward roughly $6,300 into 2027. Those are the more aggressive numbers on the street, and they lean heavily on official-sector demand staying strong and the Fed eventually easing. You do not have to buy the exact figure to respect the structure of the argument. Central banks have been net buyers on a scale that reshapes the supply-demand balance, and that flow does not care whether gold is at $4,100 or $5,100.
There is a cleaner version of the same trade in silver, which fell harder and tends to outrun gold when the complex turns — we laid out that risk-reward in the silver price forecast for 2026. For gold specifically, the bull case is best treated as conditional: it becomes actionable when the dollar and real yields confirm the turn, not before.
5. The bear case
The bear case is uncomfortable precisely because it does not require anything dramatic. It just requires the present to continue. If US inflation stays sticky and the Fed stays hawkish — or actually hikes — real yields remain elevated and the dollar holds above 100 on the DXY. That is a persistent, mechanical headwind for an asset with no yield. Under that scenario gold does not need to crash to disappoint the bulls; it simply drifts sideways in the $4,000s, grinding the impatient out of long positions month after month.
The sharper bear risk is that the geopolitical premium deflates. A meaningful de-escalation would pull the safe-haven bid, and if that lands while yields are still firm, the correction could extend rather than base. There is also a positioning argument: after a run of this size, a lot of the natural buyers already own gold, and marginal demand has to come from somewhere. None of this means the long-term story is broken — it means the timing of a $5,000 revisit could be quarters away rather than weeks, and a trader who front-runs it with size gets punished in the meantime.
What turns it bullish
- DXY tops and rolls back under 100.
- US inflation cools; the Fed drops the hike talk.
- Real yields roll over decisively.
- Central-bank buying and haven demand persist.
What keeps it capped
- Sticky inflation, a hawkish or hiking Fed.
- DXY holding above 100, real yields firm.
- Geopolitical premium deflating.
- Long positioning already crowded.

6. The levels and catalysts to watch
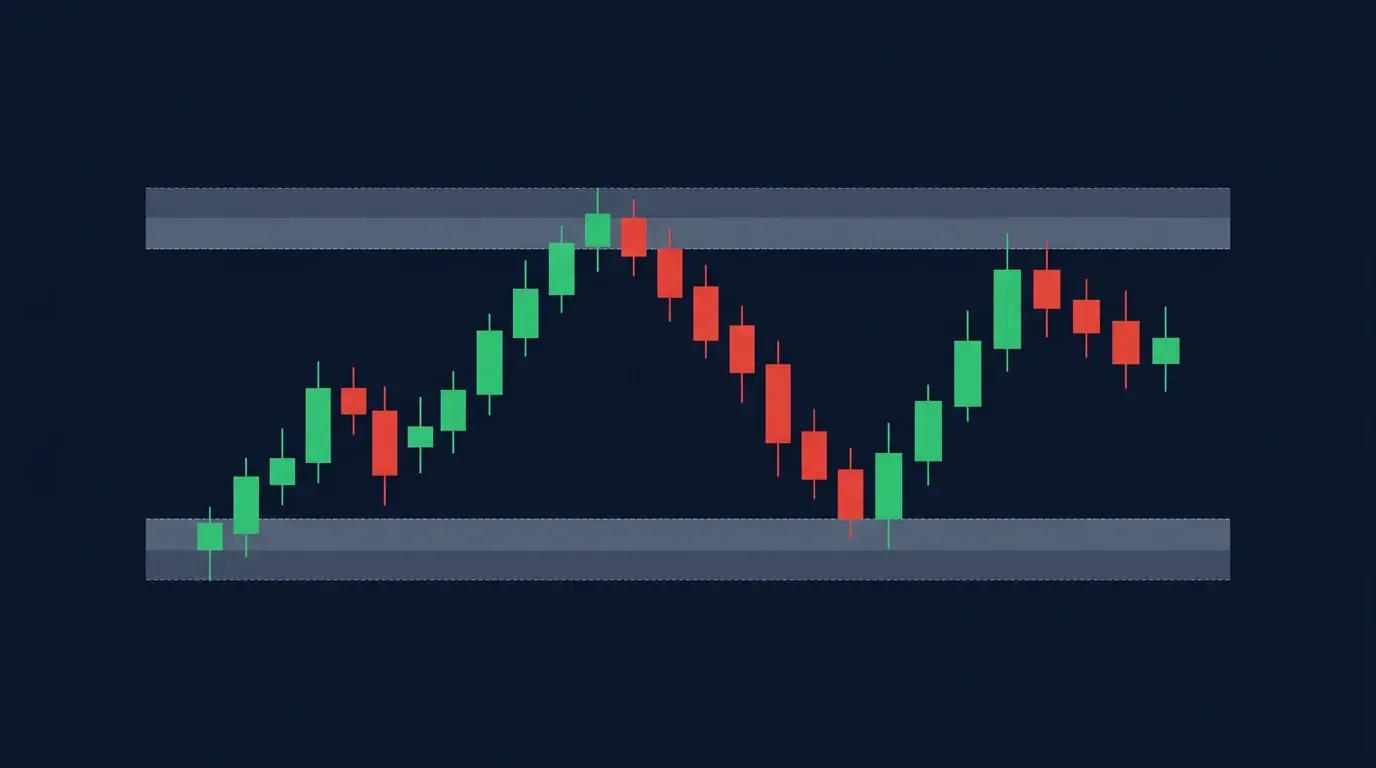
Forecasts age badly; levels do not. Rather than commit to a target, map the zones that tell you which scenario is playing out. On the downside, the low $4,000s where price is basing is the first line — hold it and the correction is maturing into accumulation; lose it decisively and the bear case gets room to extend the drawdown. On the upside, the real test is reclaiming the mid-$4,000s and then the pre-correction shelf; clearing those turns the structure from “lower highs” into a genuine attempt at the old peak. $5,000 itself is a round-number magnet and a psychological gate, not a technical wall.
The catalysts that will decide it are macro, not chart-based. Watch the Fed meetings and the dot path, US CPI prints, the real-yield curve, the DXY, and the geopolitical headlines that drive the haven bid. Any one of those can move gold more in an hour than a week of drift. That is why the read has to start with the calendar and the day's driver. Timing entries around these windows matters as much as direction — our guide on the best hours to trade gold covers when the metal actually moves.
7. How to position without predicting
Here is the part that actually protects your account: you do not need to know whether gold hits $5,000. You need a plan for both branches and the discipline to let price choose. That means defining your levels in advance, sizing every trade off the current volatility rather than conviction, and using a structural stop so a normal swing does not take you out. The specifics — ATR-based sizing, where the stop goes, how the session clock shapes entries — are in the companion how-to-trade-gold guide, so we will not repeat them here.
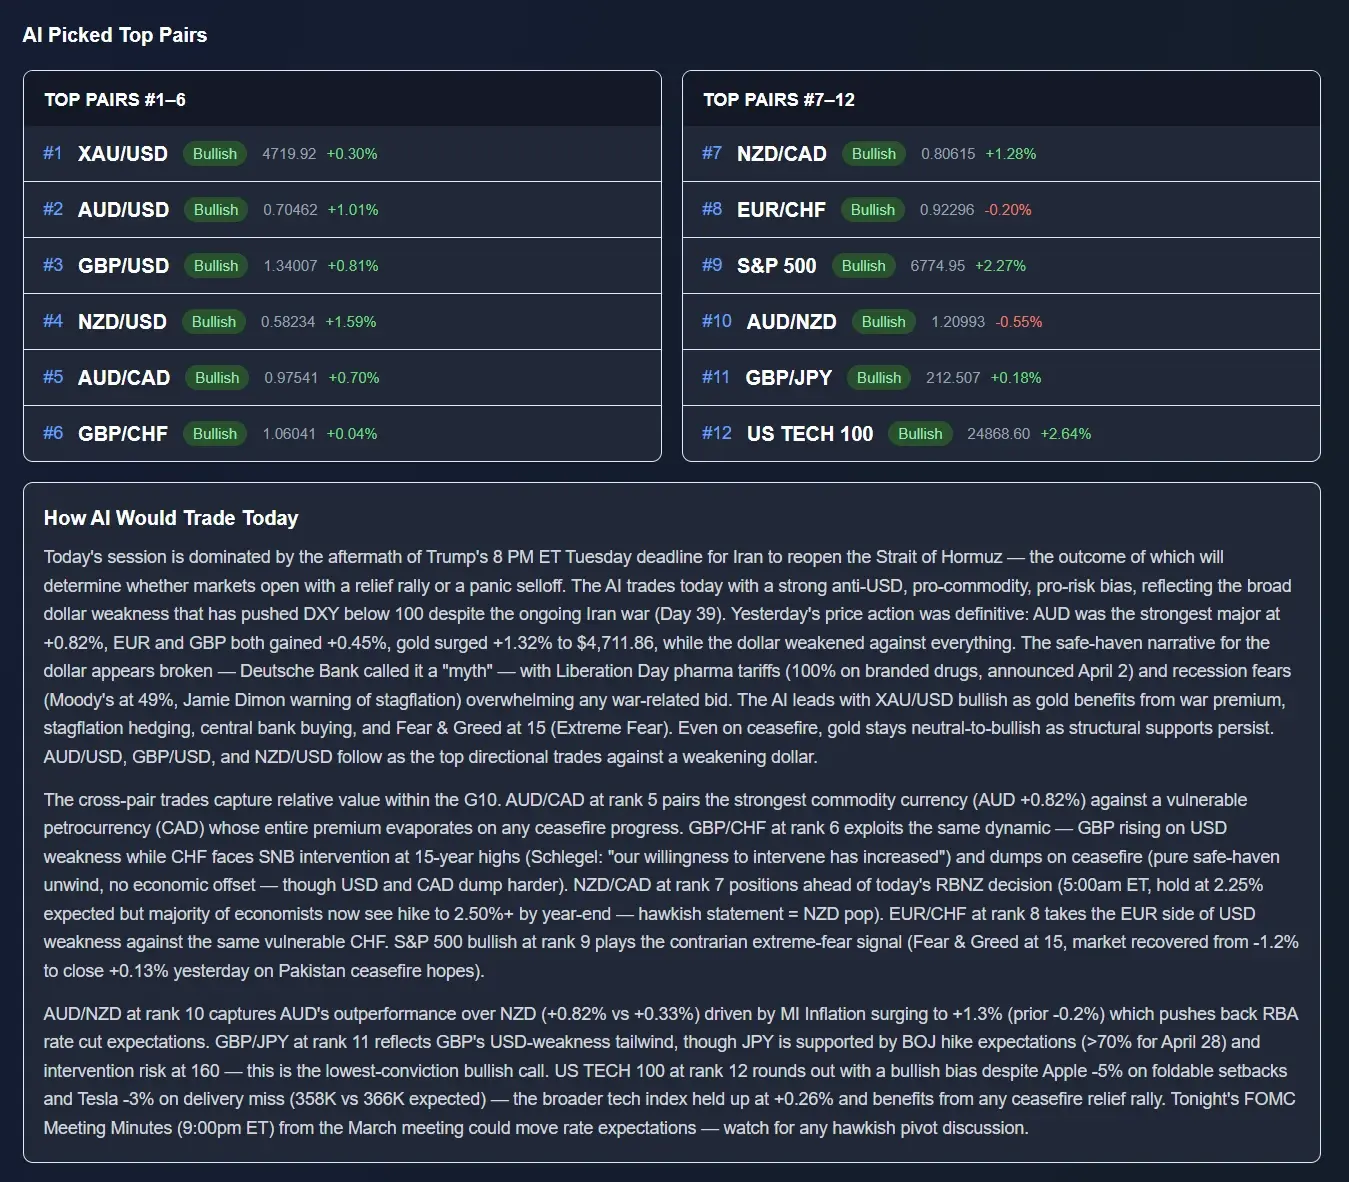
What a forecast piece can add is the daily orientation. Before you take a gold trade, you want to know whether you are trading with or against the macro flow — is the dollar bid into your session, is today a firm-yields tape or a haven-bid tape, what is due on the calendar. The Daily AI News Impact ranks gold alongside the majors each morning with a conviction score and the specific drivers behind the call, so you enter with a view of the flow instead of reacting to the first candle.
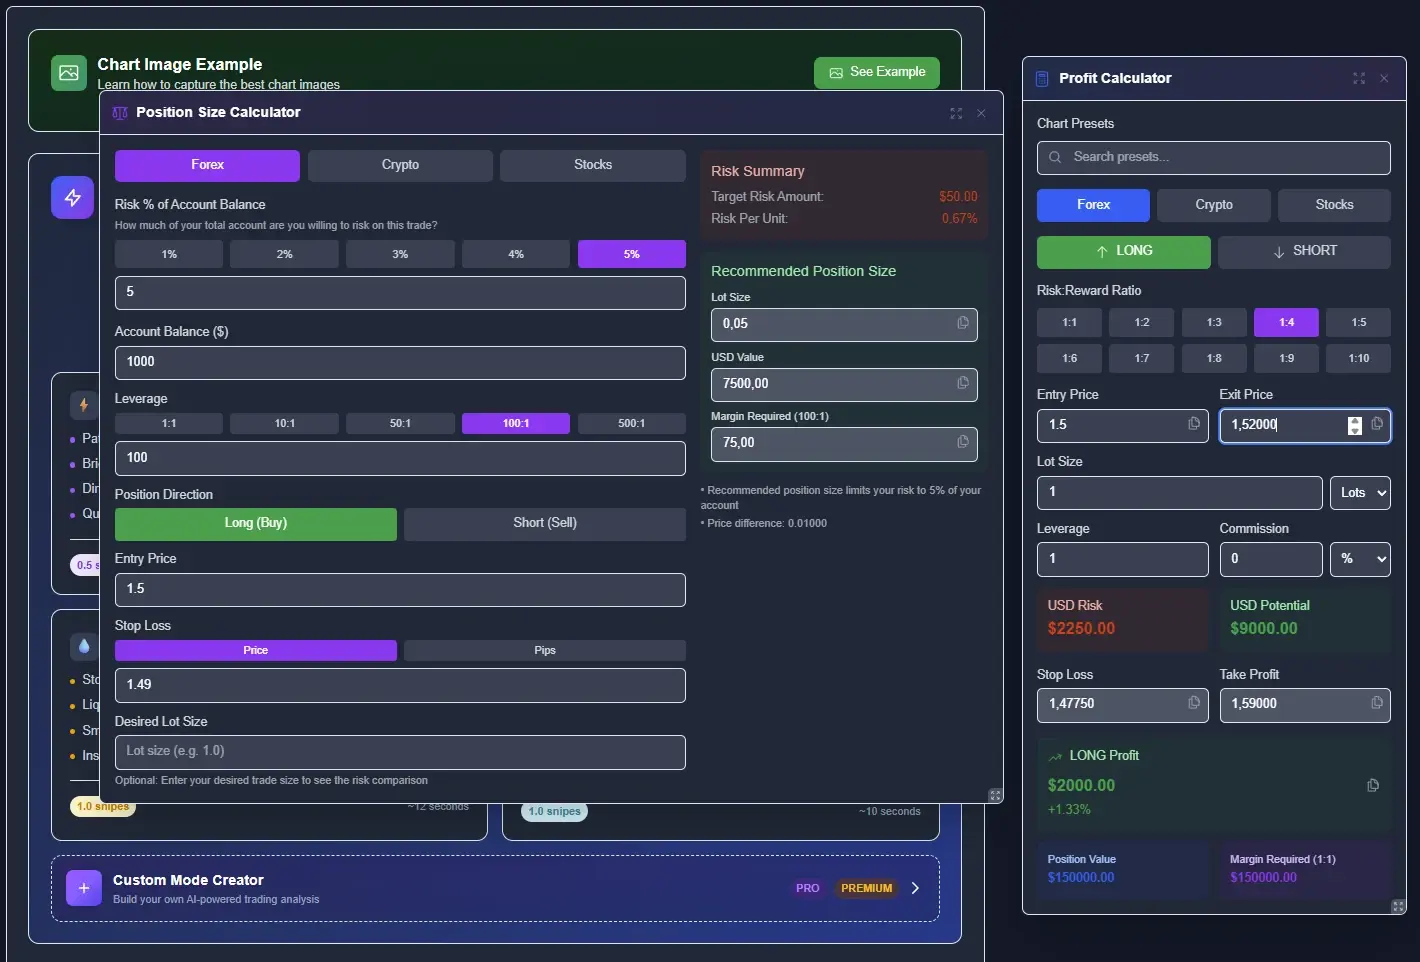
The other half is mechanical: once you have a level and a stop, put them into a position-size calculator and take the lot it returns, even when the number feels small in a wide-range market. That single habit is what separates a trader who survives a two-sided year like this one from a trader who is right about direction and still loses money on size.
This is not a signal or a price target. It is a framework for a two-sided market. Nobody — not J.P. Morgan, not a model, not us — knows whether gold prints $5,000 this year. Trade the levels, respect the macro drivers, size for the volatility, and let the market resolve the question for you.
Frequently asked questions
What is the gold price forecast for 2026?
There is no single number, only a range of scenarios. Gold set a record near $5,595 on January 29, 2026, corrected more than 25% into the low $4,000s by mid-July, and now trades roughly $4,100–$4,200. The bull case — held by banks like J.P. Morgan with a year-end target near $6,000 — needs the dollar to peak and the Fed to eventually pivot. The bear case sees firm real yields and a DXY above 100 capping any rally. Treat it as a probability spread, not a point prediction.
Why did gold fall from $5,600 to the $4,000s?
The January record was built on safe-haven demand, heavy central-bank buying and a falling-rate expectation. That last leg reversed: US inflation firmed, the Fed shifted from cutting toward holding and hinting at hikes, real yields rose, and the dollar strengthened back above 100 on the DXY. Higher real yields raise the opportunity cost of a non-yielding metal, so gold repriced more than 25% lower — even though the structural buyers never fully left.
Will gold reach $5,000 again in 2026?
It is plausible but not automatic. A return to $5,000 needs several things to line up: the dollar to top out, real yields to roll over, the Fed to move back toward cuts, central banks to keep accumulating, and the geopolitical premium to stay bid. If most of those turn, $5,000 and J.P. Morgan's ~$6,000 year-end target are on the table. If the dollar stays firm and the Fed stays hawkish, gold can spend the rest of the year based in the $4,000s.
What is J.P. Morgan's gold price target?
J.P. Morgan has been among the more bullish houses, carrying a year-end 2026 target near $6,000 an ounce and a path toward roughly $6,300 into 2027. Those numbers assume continued central-bank demand and an eventual Fed pivot. They are a credible bull scenario, not a guarantee — the path depends on real yields and the dollar cooperating.
What is the biggest risk to the gold bull case?
Firm real yields backed by a strong dollar. As long as US inflation stays sticky and the Fed leans hawkish, real yields stay elevated and the dollar holds above 100 on the DXY — both direct headwinds for a non-yielding asset. A genuine cooling of the geopolitical premium would remove the other pillar. Gold does not need a crash to disappoint; it just needs those forces to persist and it can drift sideways in the $4,000s.
How should I trade gold given the uncertainty?
Position around levels and catalysts instead of a forecast. Define the zones that confirm each scenario, size every trade off the current volatility with a structural stop, and let the market tell you which branch it is taking rather than committing to a target. Use an AI news read to know whether you are trading with or against the day's macro flow. The execution mechanics — ATR-based sizing, session timing — are in our how-to guide on trading gold volatility.
Sources & further reading
Trade the gold scenarios, not a guess
Live XAUUSD pricing, a daily AI news-impact score for gold, screenshot chart analysis of the key levels, and a position-size calculator built for a two-sided market. Two free snipes to test it on your own chart.