
The Fed Just Hiked. Here’s What Moved.
A 25bp hike that was about 90% priced, a dot plot that was not, and a market that bought the dollar and sold gold and stocks. What a hiking-cycle restart does across forex, gold, the yen and indices, and the framework for the next meeting.
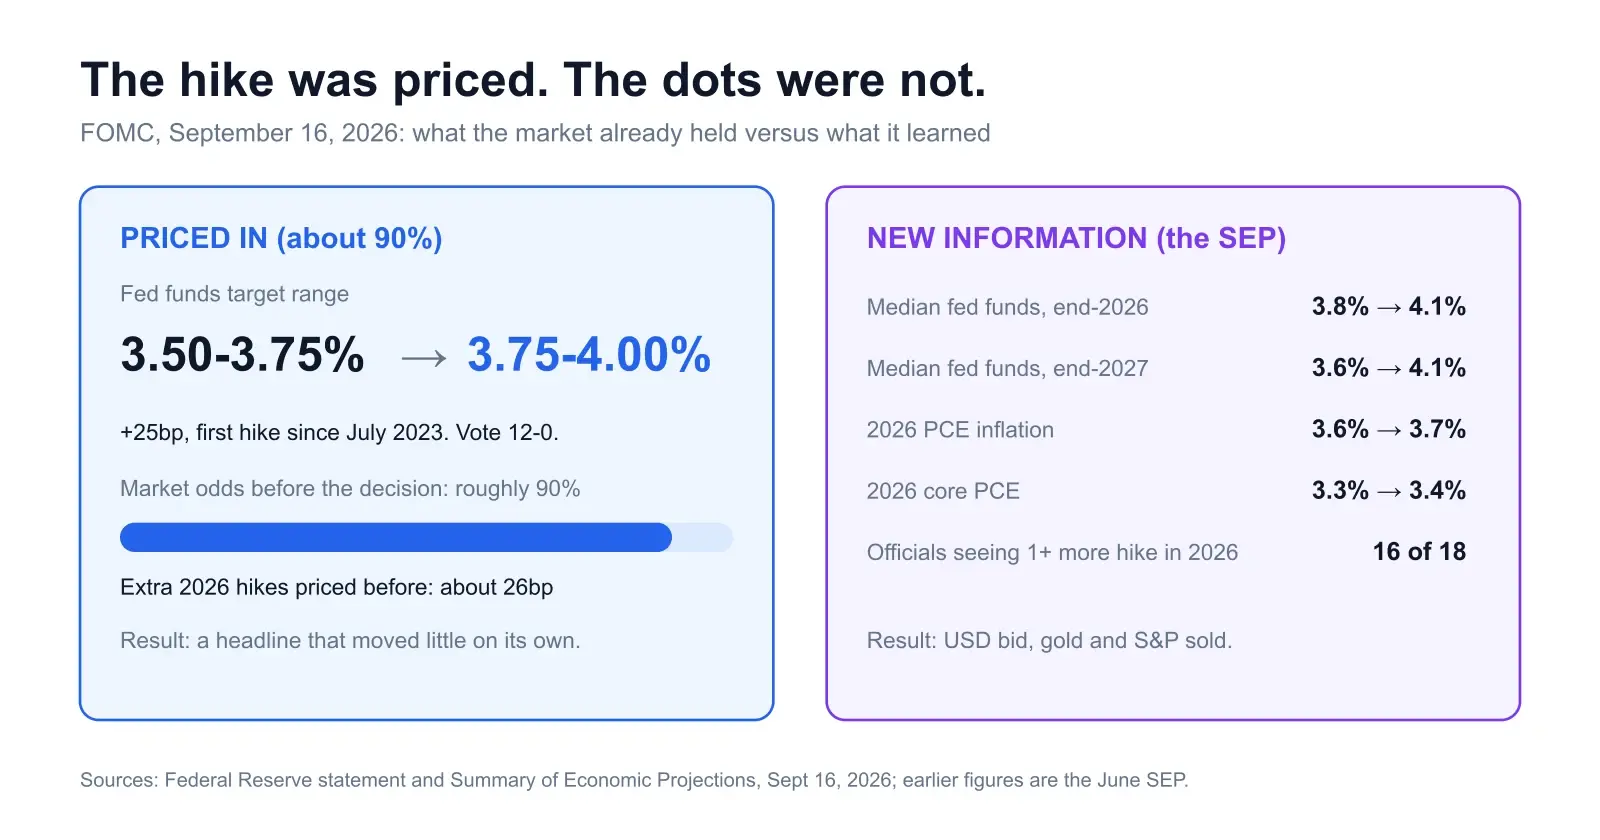
On Wednesday the Federal Reserve raised rates for the first time since July 2023. The target range went up 25 basis points to 3.75%–4.00%, the vote was 12–0, and about nine out of ten traders had already bet on it. The dollar jumped anyway. Gold gave back its gains, the S&P 500 closed down 0.45%, and EUR/USD ended Thursday below where it had traded the morning before.
If you only read the headline, that looks backwards. A hike everyone expected should do little, and the decision itself did little. What moved markets was everything around it: the projections, the wording and the press conference. This piece covers what happened, what each asset did and why, and the short checklist worth running before the next meeting.
Key Takeaways
- →The Fed hiked 25bp to 3.75–4.00% on September 16 and it was roughly 90% priced. The headline was not the trade.
- →The new information was in the projections: the 2027 median jumped from 3.6% to 4.1%, which erased the cuts the market had pencilled in.
- →The dollar bid, gold fell on rising real yields, and equities sold off during the press conference. EUR/USD slid despite the ECB hiking six days earlier.
- →Ask two questions before any central bank day: did the decision match pricing, and did the forward path change?
- →A first hike after a long pause is rarely the last. Sixteen of 18 officials see at least one more in 2026.
1. What the Fed actually did
The mechanics are simple. The FOMC statement raised the target range for the federal funds rate from 3.50–3.75% to 3.75–4.00% and was approved 12–0. The key sentences were short. “Inflation remains elevated,” and the action “will support a timelier return to the Committee’s 2 percent goal.”
The wording changed, and the change matters. The previous statement said uncertainty was elevated in part because of the conflict in the Middle East. This one says uncertainty remains elevated owing in part to “geopolitical developments,” and adds that domestic spending has been resilient. The energy shock from the Iran conflict and the Strait of Hormuz is what pushed headline inflation up this year (we covered the build-up in will the Fed hike in 2026), but the committee is now describing a spending economy that can take a higher rate, not one that needs protecting from the shock.
The projections did the real damage
The Summary of Economic Projections is where the Fed shows its working. The median end-2026 rate rose to 4.1% from 3.8% in June. That is one more 25bp hike from here, and twelve of the eighteen participants sit on it. Four see two more, and two see a hold. Nobody sees a cut this year.
The 2027 median is the number that mattered most. In June the committee expected to start cutting in 2027, with a median of 3.6%. Now the 2027 median is 4.1%, so the cutting cycle the market had been using as a backstop is gone for at least another year. Inflation projections edged up too: 2026 PCE at 3.7% from 3.6%, and core PCE at 3.4% from 3.3%. Seventeen of the eighteen officials judge the risks to headline inflation as tilted up.
Chair Kevin Warsh gave no forward guidance in the press conference. He said inflation has been too high for too long, that summer data had not convinced him underlying inflation was improving, and that the hike “removed a dose of accommodation”, adding that financial conditions were hard to call restrictive. One strategist described the tone as hawkish without being extreme. That is a fair read. So the dots carried the message, not the chair.
2. Why a priced hike still moves markets
Market pricing before the decision gave the hike about a 90% chance, and futures held roughly 26bp of additional hikes for the rest of 2026. After the decision, that extra pricing edged up to about 28bp. That is a small shift on paper. It matters when the dollar, gold and the S&P all sit at levels that assume a shallow cycle.
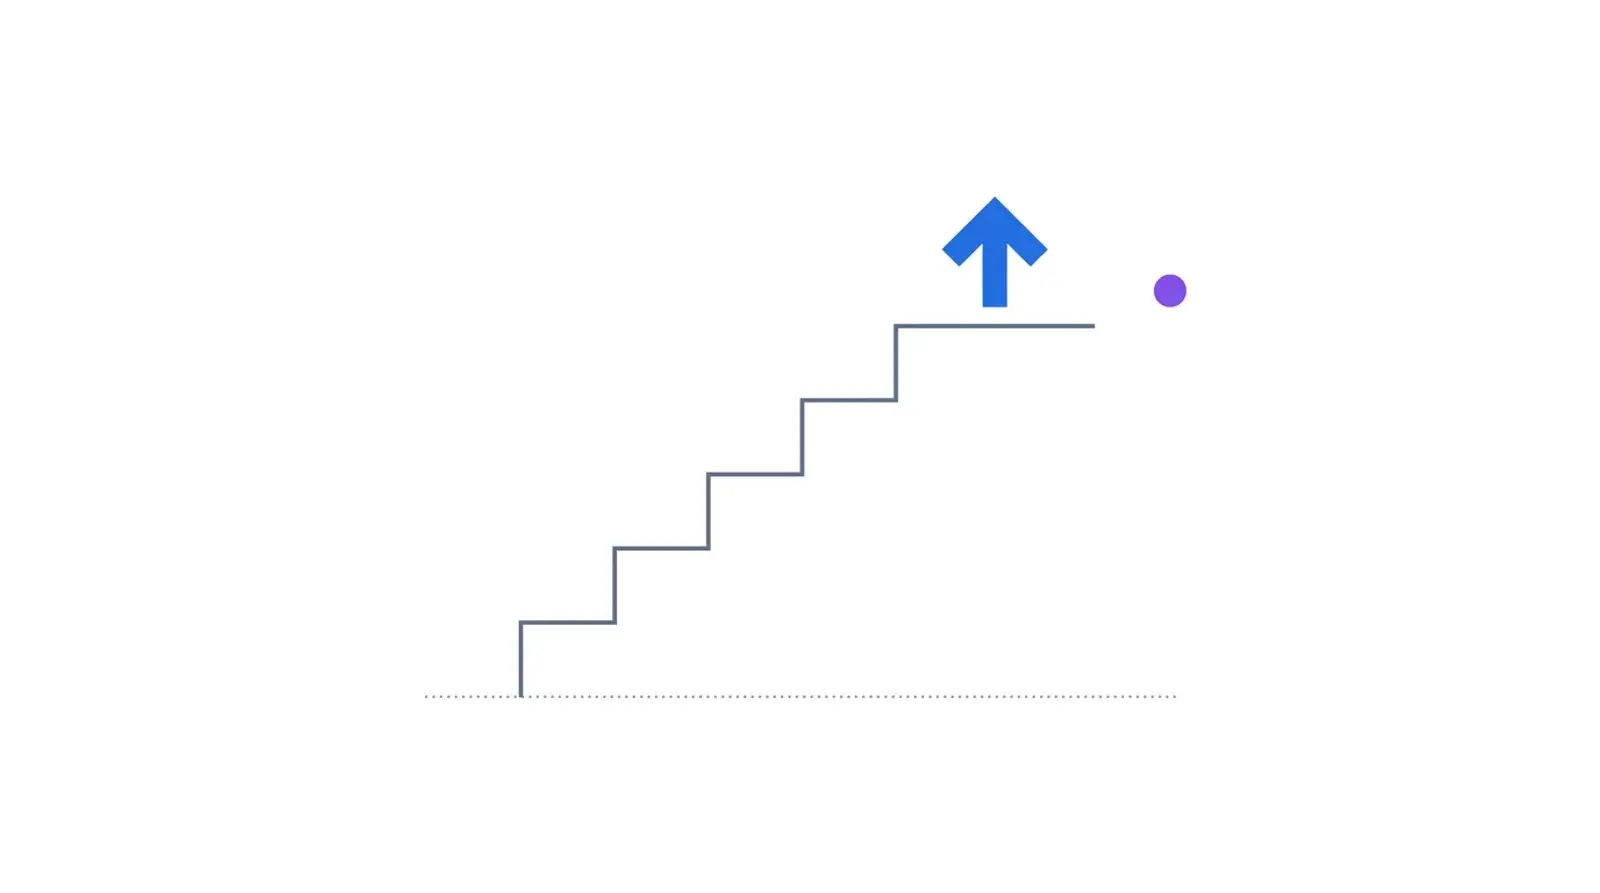
A rate is not a price. It is a path, and currencies and metals trade the path. If the market expects 3.9% at the end of next year and the Fed signals 4.1%, every asset that discounts those rates gets repriced, even though today’s rate has not moved. We go through the mechanics in how to trade NFP, CPI and FOMC. Short version: you are always trading the gap between the outcome and the expectation.
The ECB showed the same mechanism six days earlier. On September 10 it raised its deposit rate to 2.50% and its main refinancing rate to 2.65%, its first hike since 2023 per Trading Economics’ rate history and published on the ECB’s monetary policy decisions page. A tightening central bank is supposed to support its currency. The euro did not get the memo. The hike was also close to fully priced, so there was nothing new to buy, and EUR/USD slid from around 1.16 in early September to roughly 1.1465 on September 17, its lowest since late July.
3. What moved, asset by asset
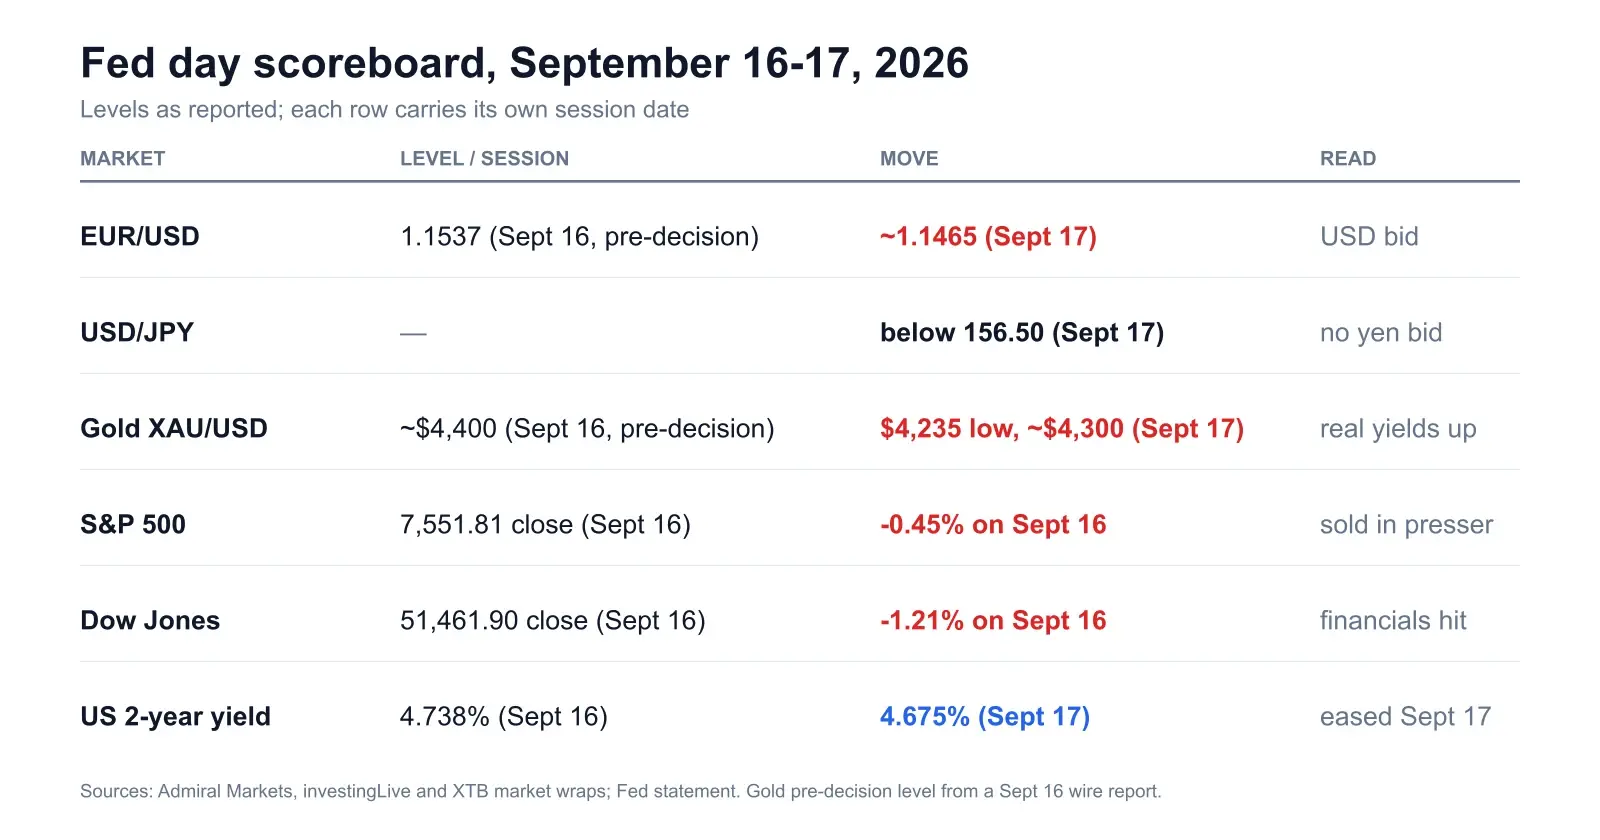
Here is the full tape, with each figure tied to the session it comes from. The dollar strengthened across the board after the decision.
The dollar and EUR/USD
EUR/USD was trading around 1.1537 just before the decision and fell to about 1.1465 by Thursday. The pair has been grinding lower since early September, with the ECB’s priced hike giving it no lift on September 10, and the Fed’s hawkish projections adding a second push. The rate differential is the clean part of this move. Even after both hikes, the dollar offers more yield. The projected US path holds at 4.1% through 2027, while the ECB’s deposit rate sits at 2.50%.
A second driver does not show up on a rate chart. The energy shock that is lifting inflation also hurts the euro area more than the US, which is a net energy exporter. That is part of why this dollar rally is easier to trust than a pure rate-differential story. For the longer-run case, see why the US dollar is strong in 2026.
Gold
Gold entered the meeting near $4,400 and, after trading higher into the decision, gave up those gains as real-yield expectations rose. Reports put the low at $4,235, a six-week low, right after the decision, with gold near $4,300 on Thursday. That is a drop of roughly 4% from the pre-decision level to the low, and it breaks the usual shortcut that war and inflation are good for gold.
The shortcut fails because gold pays no yield. A Fed that responds to an energy shock by hiking and signalling a flat 4.1% through 2027 raises the opportunity cost of holding it. When the shock is strong enough to force central banks to tighten, gold trades the response rather than the shock. We discussed the longer-term picture in can gold climb back to $5,000. That case needs falling real yields, and the September 16 dots point the other way.
The yen
The yen is the awkward one. In a normal risk-off day it rallies as a haven. This was not a normal day. The Fed hiked into a market where US 10-year yields have been hovering near 5%, and USD/JPY stayed just below 156.50 on Thursday, with no meaningful yen bid. The Bank of Japan decides on September 18, and with USD/JPY this high, traders are watching the Ministry of Finance as closely as the central bank. The mechanics behind the yen’s long slide are in why the yen keeps falling, and the Ministry of Finance intervention data is where to check what Tokyo has actually done, not what it has said.
The practical point for a trader is that a widening US yield advantage is currently beating the haven bid. A long USD/JPY into a hawkish Fed has the wind behind it. It also carries the biggest tail risk on the board: a sudden, intervention-sized drop. Size it for that, not for the average day.
Indices
The S&P 500 closed at 7,551.81, down 0.45%, and slid during the press conference after bouncing earlier in the session. The Dow lost 1.21% to 51,461.90, with Goldman Sachs down about 4%. The Nasdaq Composite was essentially flat, down 0.01%. Growth held up better than the rest. That fits a market treating this as a fine-tuning hike, not a recession signal.
Admiral Markets pointed out that the S&P has now fallen on the day of the last three press conferences: −1.21% in June, −1.52% in July and −0.45% in September. Three is a small sample and we would not build a system on it. It fits the idea that this committee’s tone has been a headwind for equities each time.
4. The framework: priced or not, path or no path
Every central bank day sorts into one of four boxes. Two questions put you in the right one. Did the decision match what was priced, and did the forward path change?
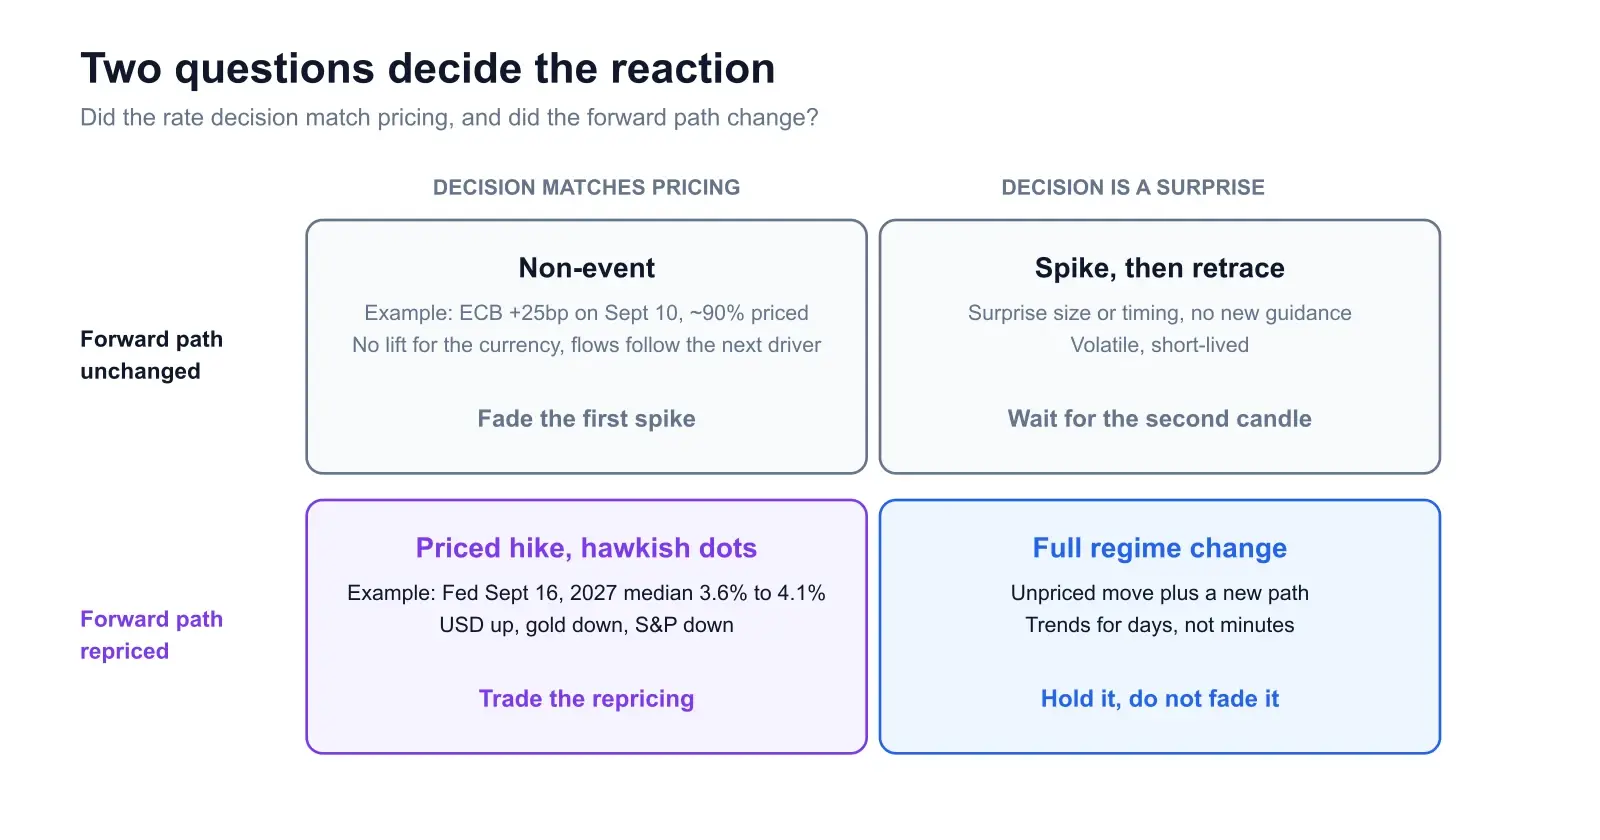
The top row is where retail traders lose money. A decision that matches pricing with no new path produces a burst of volatility with nowhere to go, and those spikes tend to retrace. The bottom-left box is where the September 16 meeting landed. It rewards patience. The decision is boring, the repricing is slow, and it keeps working for days while the market digests the 2-year yield, the dollar and the dot plot. The bottom-right box, an unpriced decision with a new path, is the rare real regime change. When it shows up, hold. Do not fade it.
The input people skip is the first one. You need to know what was priced before the release, which means looking at futures pricing or the consensus on a calendar such as Trading Economics the morning of the meeting. If you only discover the pricing afterwards, you are reading the reaction as a story rather than a measurement.
5. A playbook for a restarted hiking cycle
A first hike after a long pause behaves differently from the middle of a cycle. The market has to relearn how the committee reacts to data, and the committee is also still working out how hard it needs to lean. Those rules follow from it, and none depends on a particular number.
- Trade the second move, not the first. The first move is positions getting squared. The second, usually after the press conference, is the market agreeing on what it heard. On September 16 equities only sold after the chair began speaking.
- Read the dots before the headline. The projections and the 2-year yield tell you whether the path moved. The front-end yield was up more than 7bp on the day, which is the clearest single number for a hawkish surprise.
- Pair the dollar with what it is rising against. A dollar bid on rate differentials and a dollar bid on panic imply different trades in gold, JPY crosses and commodity currencies. September 16 was a rates bid: gold fell and the yen did not rally. In a panic bid, gold would have risen with the dollar.
- Expect gold to follow real yields, not headlines. The war-and-inflation case for gold only works if real yields are falling. Watch the 10-year and the inflation breakevens before the war news.
- Keep the yen on a short leash. The rate differential favours USD/JPY long. Intervention risk caps that trade and makes stops matter more than targets. Oil and the conflict can reverse the risk mood quickly.
- Size on the stop, not on the story. Hiking cycles throw off a run of high-conviction setups that share one risk: the Fed turning more cautious. Do not stack three dollar-long positions and call it diversification.
A caveat on all of this. It is a single meeting. The rules above describe what worked on September 16–17, plus what the mechanism implies. They are not a statistical edge. Two sessions of data do not prove a regime. They are good enough to set a lean and not good enough to bet the account on.
6. What decides the next leg
Three things set the path from here, and one of them is not in the Fed’s control.
The first is energy. The inflation the Fed is fighting is largely a supply shock from the Iran conflict, and a hike does nothing to a barrel of oil. If crude retreats, the 3.7% PCE projection starts to look too high and the dots can be revised down at the next meeting. If it spikes, the committee hikes into it and the dollar-gold split gets wider. That is why we keep a separate watch on the Iran conflict and the gold and oil trade. The EIA weekly petroleum status report is the primary source for US supply and stock data.
The second is the data between meetings. After the decision, markets priced about a 40% chance of a hike at the next meeting in late October, and that rose to about 51% on Thursday, with around an 87% chance of at least one more hike in 2026. At a coin flip, the next CPI and jobs prints decide the path, so the calendar matters more than usual. Our breakdown of which pairs move most on CPI is the one to have open on release day, and the BLS release schedule is on bls.gov.
The third is the rest of the world. The ECB is hiking, the Bank of Japan decides on September 18, and any hawkish surprise from either narrows the differential that has been propping up the dollar. If you trade EUR/USD or USD/JPY, you are trading the other central bank as much as the Fed.
A trading journal that logs the pricing, the decision and your entry reason will teach you more than any single meeting. Log how you actually behaved on days like this one. If you want a chart check without the narrative, the Chart Snipe tool takes a screenshot of the pair you are watching and returns a read on trend and structure that does not know what you hope will happen.
Frequently asked questions
What did the Fed do on September 16, 2026?
It raised the federal funds target range by 25 basis points to 3.75–4.00% in a 12–0 vote, the first hike since July 2023. The median projection for end-2026 moved up to 4.1% from 3.8%, and the 2027 median to 4.1% from 3.6%.
Why did the dollar rise after the Fed hiked, and why did EUR/USD fall after the ECB hiked?
Both hikes were largely priced. What moves a currency is the change in the expected path. The Fed’s projections removed 2027 cuts and the ECB’s hike delivered nothing new, so the dollar gained the better forward path.
What happens to gold when the Fed hikes?
Usually it is a headwind, because higher real yields raise the opportunity cost of holding a non-yielding asset. On September 16–17 gold fell from about $4,400 to a low of $4,235 and settled near $4,300, even with an energy shock and a war in the background.
How should you trade a rate hike that is already priced in?
Do not trade the headline. Check what was priced, read the projections and the press conference, then decide: if the path is unchanged, fade the first spike; if it is repriced, trade the repricing and size on the stop.
Is the Fed finished hiking?
The committee does not think so. Sixteen of 18 participants see at least one more hike in 2026, four see two, and two see none. Markets priced about a 51% chance of an October hike on September 17, so the next data prints carry weight.
Sources & further reading
- → Federal Reserve: FOMC statement, September 16, 2026, the primary source for the rate range, the 12–0 vote and the statement wording.
- → Federal Reserve: FOMC calendars, projections and minutes, the Summary of Economic Projections and the next meeting dates.
- → European Central Bank: monetary policy decisions, the rate decisions and projections.
- → Trading Economics: euro area interest rate, the ECB rate history, including the September 10 move.
- → investingLive: Fed hikes for the first time in three years, the pre-decision pricing and the immediate market reaction.
- → Admiral Markets: Fed raised rates to 3.75%–4.00%, index closes, yields, the dot plot breakdown and press conference notes.
- → XTB: hawkish hike triggers market reversal, same-day reaction in USD, gold and US500.
- → U.S. Energy Information Administration: weekly petroleum status, oil supply and stocks, the input that matters most for the inflation path.
Know what is priced before the next meeting
News Impact ranks 12 instruments every trading day with a written thesis, per-currency cards and a Risk Analysis of what would break the day, published Monday to Friday before the session opens. Then check the chart you actually plan to trade.