
Will the Fed Hike in 2026?
January's market was pricing rate cuts. July's is pricing almost none — and openly debating a hike. After an inflation shock flipped the script, the question into the July 28–29 FOMC is no longer how many cuts, but hold or hike. Here is why the Fed turned, what the dots and the odds say, and how each outcome hits the tape.
Rewind to January. The consensus was that 2026 would be the year the Fed finally eased — two, maybe three cuts, inflation drifting back toward target, a soft landing filed under done. Fed funds futures were priced for it. Then the year did what years do to consensus. Headline CPI printed 4.2% in May, the hottest since April 2023, and the whole rate curve repriced in the wrong direction for anyone long the cut trade.
By the June meeting the Fed had held its target range at 3.50%–3.75% and lifted its inflation forecast, and the dot plot had drifted from cuts toward a hike. Into the July 28–29 FOMC the market is pricing roughly a 76% chance of zero cuts for all of 2026 and treating the meeting itself as most likely a hold — but a hold with a hawkish bias, where the tail risk is a hike, not an ease. That is a genuinely different world, and it changes how you trade every dollar-sensitive instrument on the board.
This is a preview, not a prediction — the meeting has not happened. The job here is to map the setup cleanly so you are positioned for the reaction rather than gambling on the outcome. The read into and out of the event is exactly what the Daily AI News Impact is built to track.
Key Takeaways
- →The debate flipped. Off a 4.2% May CPI print, the market went from pricing cuts to pricing roughly zero cuts in 2026 — about 76% odds of no ease all year.
- →Rate range is 3.50%–3.75%, held in June. The median dot for end-2026 drifted up toward ~3.8%, a lean toward one hike rather than a cut.
- →July 28–29 is most likely a hold. The tradeable question is the tone: hawkish hold, live hike, or a dovish surprise.
- →A hawkish outcome is dollar-positive, a headwind for gold, and pressure on bitcoin and richly-valued equities. Dovish flips all four.
- →Trade the gap between outcome and positioning, not your forecast. Size down into the release, react to the retrace.
1. The setup into July's FOMC
Start with where the pieces actually sit. The policy rate is 3.50%–3.75%, held at the June 17 meeting. The dollar index has clawed back above 100, trading around 100.7–101, its firmest since May 2025. Gold, which set a record near $5,595 in late January, has corrected more than 25% and sits in the low $4,000s. Bitcoin is coiled in a $56k–$62k range, waiting. And equities are the odd one out — the S&P 500 near 7,575 and the Nasdaq Composite around 26,281, still grinding record highs on AI optimism even as the rate story turns against them.
That last divergence is the tension in the whole tape. A strong dollar and a Fed leaning hawkish is not the backdrop equities usually rally into, and it is not the backdrop gold usually corrects gently through. The market is holding two contradictory bets at once, and the July FOMC is the next place that contradiction gets tested. You do not need to resolve it to trade the event — you need to know it exists, because it is why the reaction could be sharper than a routine hold would suggest.
2. Why the Fed turned hawkish
The pivot was not a change of heart — it was a change in the data. Headline CPI came in at 4.2% in May, the hottest reading since April 2023. That is not disinflation stalling; that is inflation reaccelerating, and it is the one thing a central bank that spent two years fighting a price surge cannot ignore. The Fed responded by raising its inflation outlook to roughly 3.6% headline and 3.3% core, numbers that sit well above a 2% target and leave no room to ease.
The driver matters as much as the number. The bulk of the May spike traced to energy — an oil surge tied to the Iran conflict and the risk premium on the Strait of Hormuz — layered on top of tariff pass-through from the Section 301 relaunch and the year's trade fights. A central bank can look through a one-off energy blip. It cannot look through an energy shock that threatens to seed a second round of inflation expectations while tariffs are already lifting goods prices. That combination is what turned a patient, cut-leaning committee into one that would rather over-tighten than let inflation get away twice.
The framing that matters: the Fed is no longer optimising for growth. It is managing the risk of a second inflation wave. That asymmetry — more afraid of being too loose than too tight — is the entire reason the balance of risk now points toward a hike.
This is also why the strong dollar and the hawkish Fed reinforce each other. Higher-for-longer US rates pull capital toward dollar assets, which is a big part of why DXY is back above 100. If you want the fuller version of that story, we walked through it in why the US dollar is so strong in 2026.
3. What the dot plot says
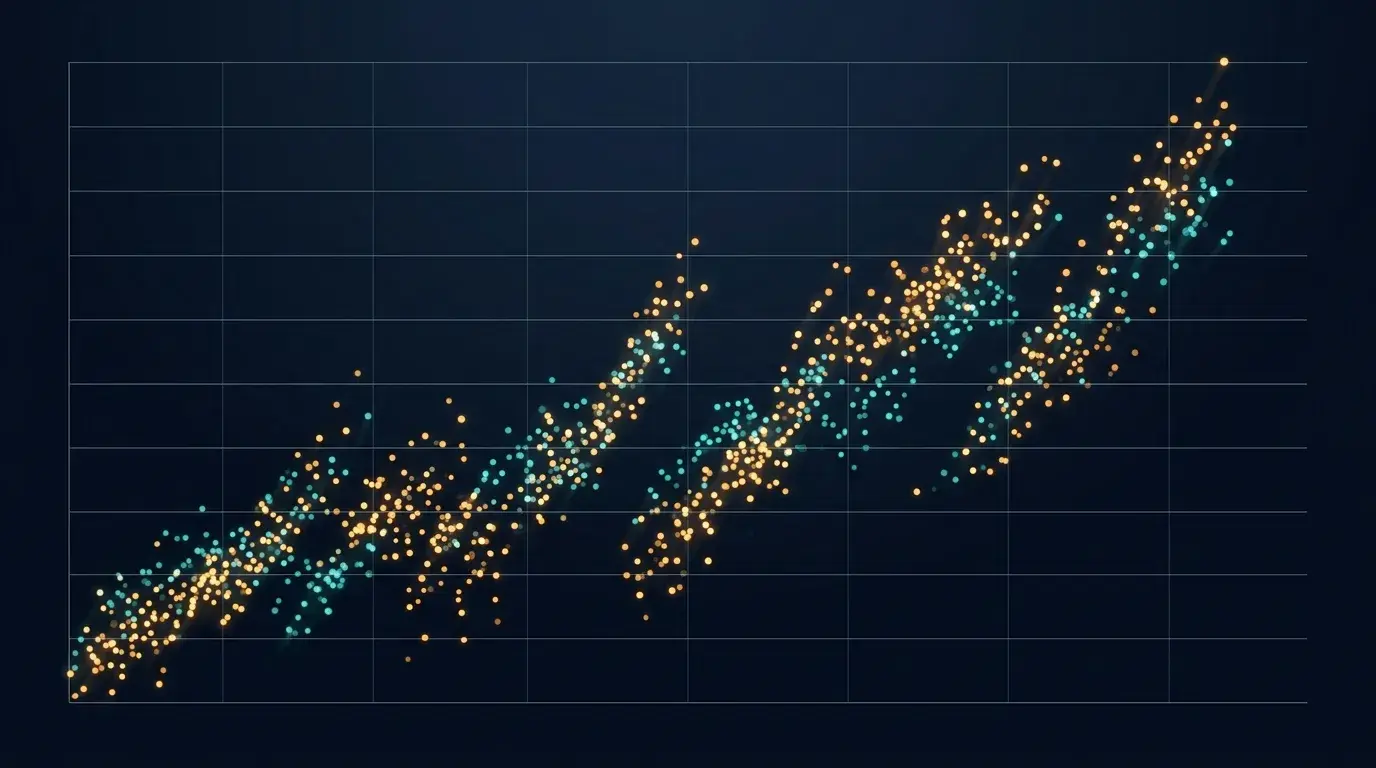
The dot plot is the Fed's own scatter of where each participant expects the policy rate to sit at year-end. It is not a promise — dots move with the data, and they have moved a lot this year — but it is the cleanest read on where the committee's head is. In January the dots clustered below the current rate, implying cuts. By June they had drifted up: the median for end-2026 sits around 3.8%, above the top of today's 3.50%–3.75% range, which in plain terms means the median participant now pencils in one more hike rather than any cut.
Just as telling is the spread. Several participants marked one or more hikes; almost none marked a cut. When the dovish tail of the distribution disappears, the whole conversation shifts — the argument inside the room is no longer whether to cut, it is whether one hike is enough. That is a subtle but important signal for how the July statement and press conference are likely to be framed, even if the meeting itself delivers no change.
4. What the market is pricing
The Fed's dots are one voice; the market is the other, and the market votes with money. Prediction markets and rate futures now put the odds of zero cuts across all of 2026 at roughly 76%. For the July 28–29 meeting specifically, a hold is heavily favoured — the base case is no change to the range, with the drama concentrated in the tone rather than the number.
Why does the priced-in probability matter more than your own view? Because price already reflects the consensus. If a hold is 80%-plus priced and the Fed holds, the surprise is near zero and the reaction comes entirely from the statement's hawkishness or dovishness. If the Fed instead hikes into a market that only partly priced it, that gap is where the violent move lives. On an FOMC day you are not trading the decision — you are trading the distance between the decision and what was already in the price.
What is priced
- Roughly zero cuts for full-year 2026 (~76%).
- A hold at the July 28–29 meeting as base case.
- A hawkish, inflation-focused tone.
- A firm dollar and higher-for-longer real yields.
What would surprise
- An actual hike this meeting, not just guidance.
- Explicit signalling of hikes at coming meetings.
- Any hint that cuts are back on the table.
- A softer inflation forecast than June's.
5. The scenario map
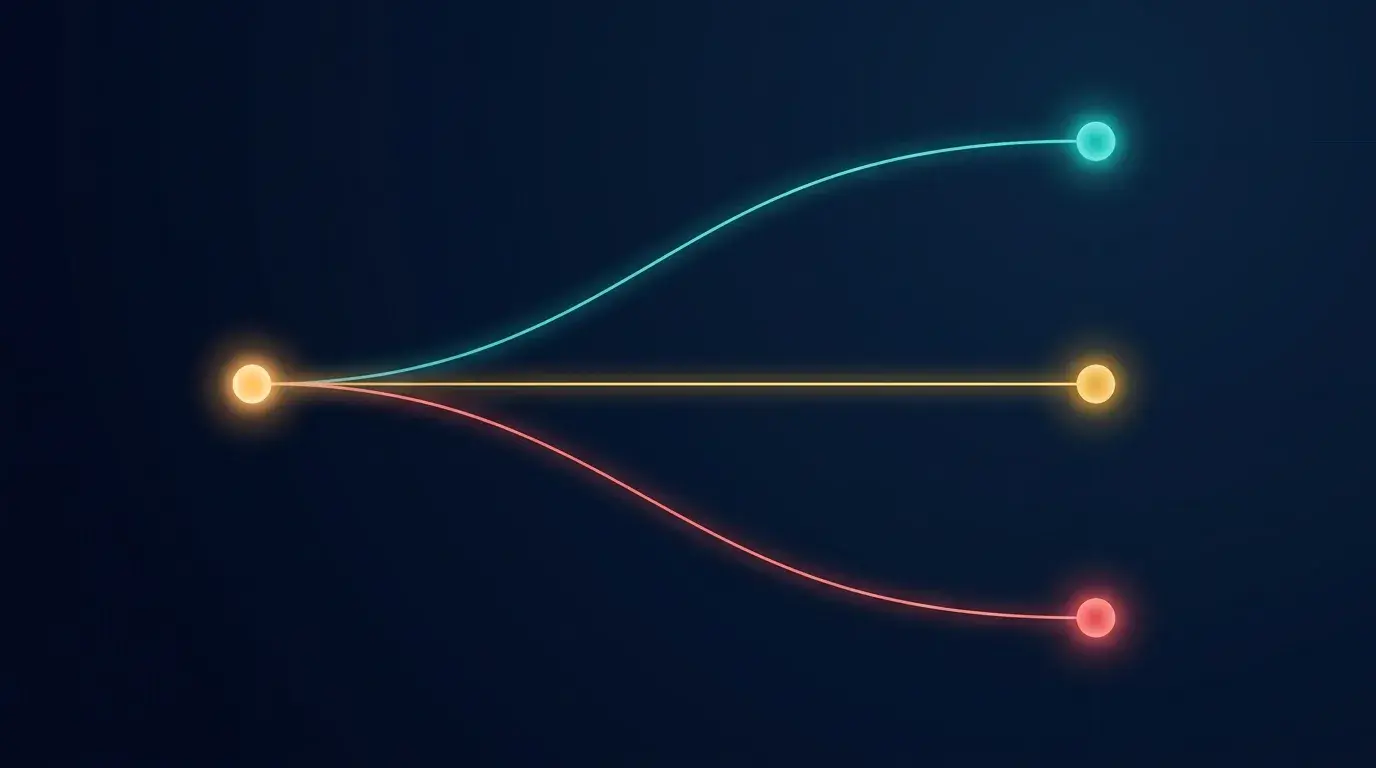
Three branches cover the meeting. Write them down before the release, because once the headline hits you will not have the composure to think from scratch.
Branch A — the live hike
The Fed raises the range 25 basis points to 3.75%–4.00%. This is the lower-probability branch, but it is the one that moves markets most because it is only partly priced. Expect a sharp dollar bid, a leg lower in gold, and pressure on bitcoin and the high-multiple corners of the equity market. The magnitude depends on the accompanying language — a “one and done” hike is very different from a hike that flags more to come.
Branch B — the hawkish hold
The base case. The range stays at 3.50%–3.75%, but the statement and press conference keep the door to a hike wide open and reiterate that cuts are not on the table. Because the hold is expected, the entire reaction lives in the tone. A more hawkish hold than priced still lifts the dollar and weighs on gold and risk; a hold that sounds even slightly relieved about inflation can spark a relief rally in exactly those assets. This is the branch where reading the nuance beats reading the decision.
Branch C — the dovish surprise
The lowest-probability branch: the Fed holds and signals that the inflation spike looks transitory, quietly reopening the path to cuts later in the year. Against a market positioned for hawkishness, even a mildly dovish surprise unwinds a lot of crowded long-dollar and short-gold positioning fast. It is unlikely on the current data — but the crowded side of the boat is the hawkish side, which is precisely why a dovish tilt would produce an outsized snap.
Probability is not the point. You do not need to know which branch prints. You need a written plan for each so that whichever one arrives, you are executing rather than improvising. The trader who wrote the map wins the day; the one guessing the outcome is just gambling with extra steps.
6. Cross-asset reaction
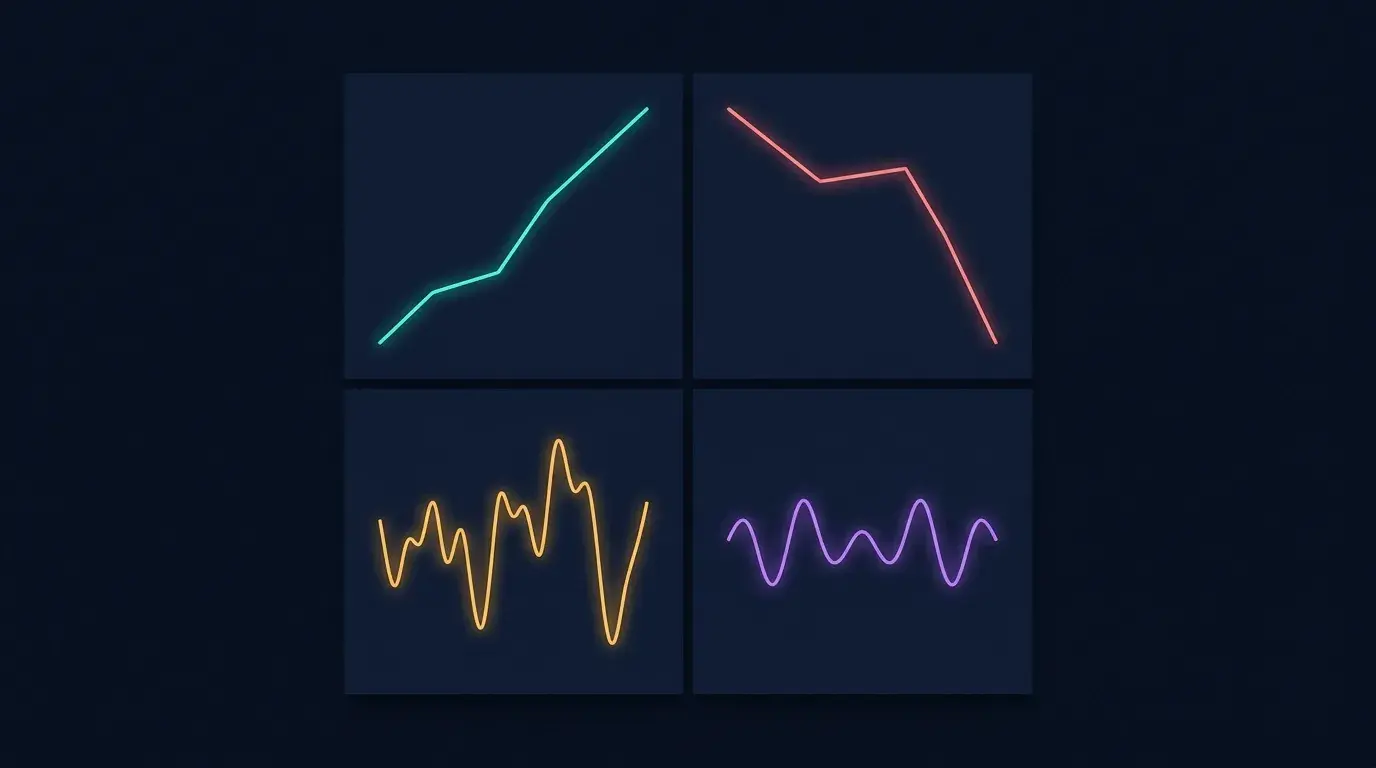
A hawkish Fed transmits through one channel above all: US real yields relative to the rest of the world. When those rise, the dollar strengthens, and everything priced against the dollar or against a discount rate has to adjust. Here is how the four instruments traders watch most tend to respond to a hawkish outcome — and remember, a dovish surprise flips each sign.
The dollar (DXY)
The most direct beneficiary. A hike or a hawkish hold widens the US rate advantage and pulls the dollar higher, extending a DXY that is already back above 100. USD/JPY is the pressure point to watch — near 162 with intervention risk live, a hawkish Fed pushes it toward the danger zone and raises the odds of a response from Tokyo.
Gold (XAUUSD)
Gold pays no yield, so it competes directly with real rates. A hawkish outcome is a clean headwind and would pressure a metal already down more than 25% from its January record. The nuance: gold is also a haven, so if the hawkishness is tied to an inflation shock that markets read as destabilising, the haven bid can partly offset the yield drag. Two forces, one instrument — which is why gold reactions to the Fed are rarely one-directional for long.
Bitcoin (BTC)
Bitcoin trades as a liquidity and risk asset far more than as digital gold on days like this. Higher-for-longer rates and a firm dollar tighten liquidity and pressure the crowded, high-beta end of the market — bitcoin included. It has been coiling in a $56k–$62k range into the meeting for a reason. For the full playbook on how crypto behaves around these events, we broke it down in the bitcoin FOMC playbook.
Equities (S&P 500, Nasdaq)
This is the awkward one. Indices are at record highs on AI optimism, and richly-valued growth names are the most exposed to a rising discount rate. A hawkish Fed does not automatically end the rally — earnings and the AI narrative have carried it this far — but it removes the cheap-money tailwind and makes every valuation look more stretched. The vulnerable segment is long-duration tech, not the whole tape. Whether the melt-up survives a genuinely hawkish Fed is the open question the July meeting starts to answer.
7. How to trade an FOMC without guessing
The single most expensive mistake around a central-bank meeting is treating it as a coin-flip you can call. You cannot, and you do not need to. The professionals who make money on FOMC days are almost never the ones who guessed the decision — they are the ones who read the reaction faster and had a plan for each branch. Here is the discipline that keeps you on the right side of that line.
Size down or stand flat into the release. The minutes around the statement are the widest-spread, most whipsaw-prone window of the month. Carrying full size through it is not conviction, it is exposure to a random first spike that routinely reverses. Reduce, or be flat, and let the dust settle.
Wait for the impulse and the retrace. The first move on the headline is frequently a fake — algorithms firing on a keyword before the market digests the full statement and the press conference. The tradeable move is usually the second one, once positioning has shaken out and the real direction asserts. Patience here is an edge, not a cost.
Anchor to the pre-written scenario map. If you decided in advance what a hawkish hold means for the dollar and for gold, you are executing a plan when it lands instead of forming an opinion in real time. That is the whole value of the three-branch map in section five.
Know which instruments carry the event. Not everything reacts equally. The dollar and rate-sensitive pairs move first and cleanest; gold and crypto follow through the yield and liquidity channels. Our guide to high-impact forex news events ranks which releases move which markets, and the news-trading playbook for NFP, CPI and FOMC covers the mechanics in detail.
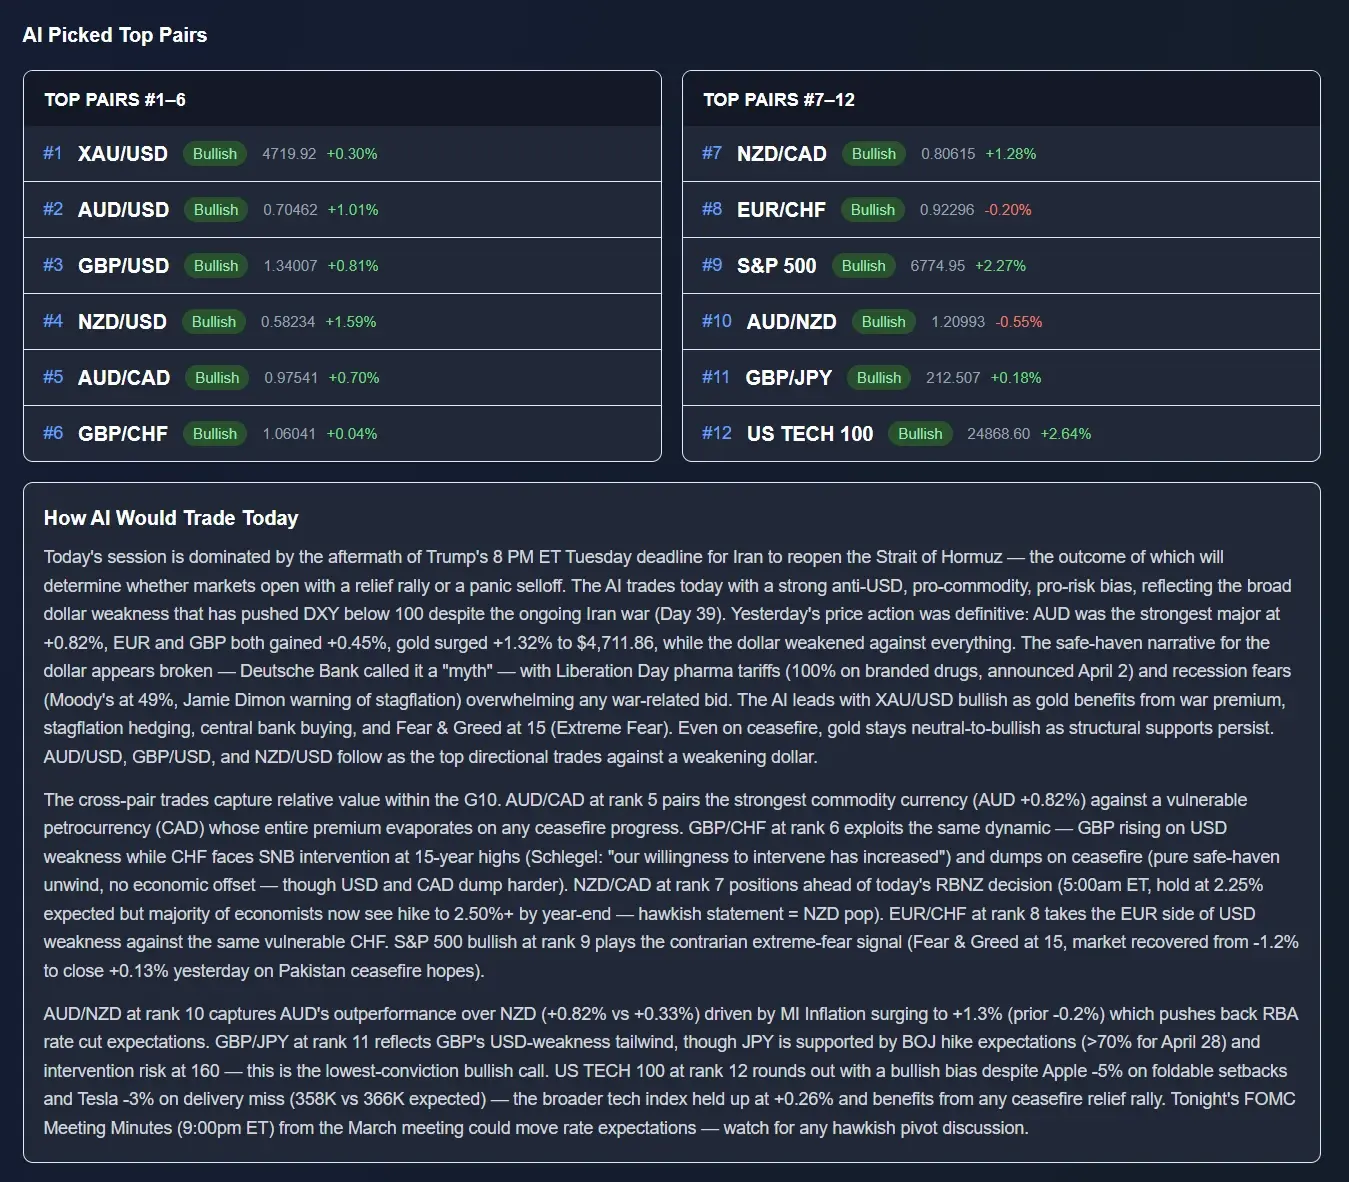
This is where an AI research read earns its place. The ChartSnipe tool will not tell you what the Fed will do — nothing honestly can. What it does is score the day's drivers, rank which instruments are most exposed, and read your chart screenshot for the levels that matter, so you walk into the meeting with the map already drawn and out of it with a read on where the flow settled. Co-pilot for the research; you own the size and the stop.
No tool predicts a rate decision. Anything promising to call the FOMC in advance is selling you a coin-flip dressed up as certainty. The edge is in preparation and reaction, not prophecy — and any honest AI research tool will tell you the same.
Frequently asked questions
Will the Fed hike interest rates in 2026?
It is a live possibility now, not the fringe view it was in January. After May CPI ran at 4.2%, the Fed held at 3.50%–3.75% in June but raised its inflation outlook and nudged its median dot for end-2026 up toward roughly 3.8% — a lean toward one hike rather than a cut. Markets price about a 76% chance of zero cuts all year. July 28–29 is most likely a hold, but the risk is skewed toward a hike.
What is the Fed funds rate in July 2026?
The target range is 3.50%–3.75%, held at the June 17, 2026 meeting. That is where it stands going into the July 28–29 FOMC.
What does the 2026 dot plot show?
The June projections shifted the median dot for end-2026 up toward about 3.8%, implying a lean toward one more hike from the current range. Several participants pencilled in one or more hikes and almost none saw cuts — a near-complete reversal of the cut-heavy dots the market traded at the start of the year.
Why did the Fed turn hawkish in 2026?
An inflation shock. Headline CPI hit 4.2% in May 2026, the highest since April 2023, driven largely by an oil spike tied to the Iran conflict and Strait of Hormuz risk, on top of tariff pass-through. With inflation reaccelerating instead of fading, the case for cuts collapsed and the committee pivoted to guarding against a second wave.
How does a Fed hike affect gold, the dollar and bitcoin?
A hawkish outcome is broadly dollar-positive because it lifts US real yields relative to peers. That is a headwind for gold, which pays no yield, and it tends to pressure bitcoin and richly-valued equities through the discount-rate and liquidity channels. A dovish surprise flips each of those. The size of the move depends less on the decision than on how far it lands from what is already priced.
How should I trade the July FOMC?
Trade the reaction, not the prediction. Define your scenarios beforehand, size down or stand flat into the statement and press conference, and let the first impulse-and-retrace play out before committing. The edge is in reading the gap between the outcome and the positioning, with a pre-written plan for each branch — not in guessing the decision.
Sources & further reading
Track the read into and out of the FOMC
A daily AI news-impact score that ranks which instruments are most exposed to the meeting, live pricing across FX, gold, indices and crypto, and screenshot chart analysis for the levels that matter. Two free snipes to test it on your own chart.