
Do Forex Robots Actually Work? An Honest 2026 Guide
A trading robot has no edge of its own — it only executes rules. Here is what an expert advisor really is, the four reasons retail robots keep failing, and how a modern no-code builder lets you compose, backtest, validate, replay and export one yourself.
Search “forex robot” and you get two internets. One is a wall of vendor pages selling expert advisors with 98% win rates, screenshots of $500 turning into $84,000, and a countdown timer. The other is Forex Factory and Reddit threads where people who bought those robots explain, in detail and at length, how the account died in six weeks.
Both are describing the same product category, and both are basically telling the truth. That contradiction is worth understanding, because the honest answer to “do forex robots work?” is not yes or no. It is: a robot is a delivery mechanism, not an edge. It executes rules. If the rules are good, it executes good rules tirelessly and without fear. If the rules are bad, it executes bad rules tirelessly and without fear, which is considerably worse than doing nothing.
This guide covers what a trading robot actually is, the four specific mechanisms that kill retail EAs, what a defensible testing process looks like, and what the modern build-it-yourself workflow now involves — because that has changed a great deal and is the main reason buying a sealed EA makes less sense than it used to. ChartSnipe is not a trading robot — we build AI chart analysis for humans who press the button themselves — so we have no robot to sell you at the end of this.
Key Takeaways
- →A robot executes rules. It cannot create an edge, and automation makes a bad strategy fail faster, not slower.
- →Four things kill retail EAs: curve fitting, backtests run without real costs, hidden martingale or grid sizing, and a single lucky test year.
- →A 99% win rate is a warning label, not a feature. It is what averaging down looks like right before it stops working.
- →Buying a compiled EA means trusting a number produced by the person selling it. Building your own means you can read every rule.
- →No-code builders now cover the whole chain: compose, backtest with real costs, validate every year separately, refine variations, replay trade by trade, rank on a leaderboard and export a compilable MetaTrader 5 EA.
- →No backtest is proof. Multi-year data, honest costs, out-of-sample testing and then months of forward demo is the minimum bar before real money.
1. What a trading robot actually is
Strip the branding and a trading robot is a small program with four parts: inputs (indicator values computed from price), an entry condition (a boolean test over those inputs), a direction, and exits (stop loss, take profit, trailing rule, time limit, or an opposite signal). It runs on every new bar or tick, evaluates the condition, and sends orders when it is true.
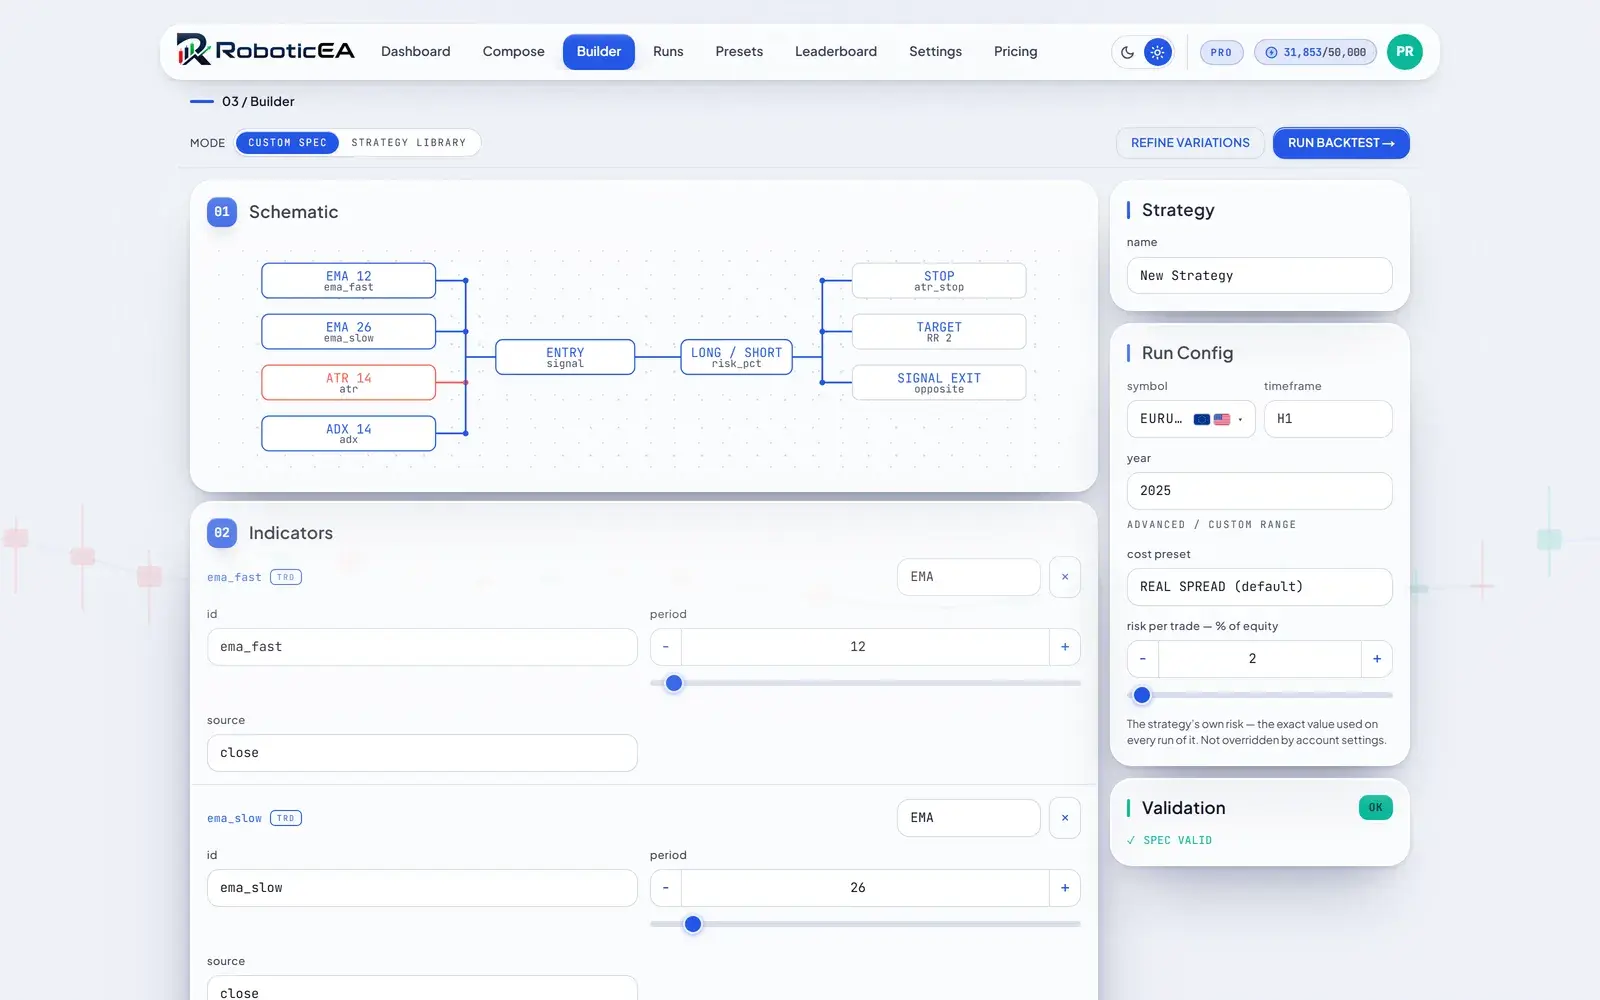
In MetaTrader that program is called an expert advisor, written in MQL4 or MQL5 and attached to a chart. Elsewhere it is a bot, an algo, or a strategy script. The terminology varies; the anatomy does not. The schematic at the top of this article is exactly that anatomy drawn out: two moving averages and an ATR feeding an entry signal, a long/short decision, and three exit blocks.
The important consequence: nothing in that structure produces an edge. The edge, if there is one, lives entirely in the choice of rules and parameters. A robot is a faithful executor of a hypothesis. Automation removes hesitation, fatigue and revenge trading — genuinely valuable — but it removes them symmetrically. It will follow a losing hypothesis into the ground with the same discipline.
What automation is genuinely good at
It is worth being fair here, because the anti-robot case is often overstated. Automation solves real problems: it executes at 3am across all three trading sessions without you being awake, it never widens a stop because it feels confident, it never skips a valid setup after two losses, and it applies position sizing rules identically on trade one and trade four hundred. Discipline is the scarcest resource most retail traders have, and a robot has an unlimited supply of it.
The problem is never the execution layer. It is that the rules being executed were usually discovered by looking at the answer sheet.
2. The four reasons retail robots fail
These are ordered by how often they are the actual cause, not by how often they get blamed.
Failure 1 — Curve fitting
Take any strategy with five parameters. Try a few thousand combinations against ten years of EURUSD. Some combination will produce a beautiful equity curve — not because it found a market truth, but because with enough attempts something always fits the noise. Vendors then ship that combination as the settings, and it stops working the moment the data changes, because the only thing it ever described was the past.
The tell is specificity. A robot whose recommended settings are EMA 37 / EMA 116 / ATR 19 / RR 2.7 has been optimised. Robust parameters come in plateaus, not points: if 34–40 all work about as well as 37, you have something. If 37 works and 36 and 38 do not, you have a coincidence that has been dressed up as a product.
Failure 2 — Backtests run without real costs
Every filled trade pays a spread. Most pay a commission. Every position held past 5pm New York pays or receives a swap. A strategy that trades 400 times a year at a 1-pip average edge is entirely made of costs — and a backtest configured with zero spread will show it as profitable.
This is the single easiest way to make a robot look good, and it is often not even deliberate: default settings in some testing tools are frictionless. Whenever you see a backtest, the first question is not “what was the return?” It is “what did it pay to trade?” If the report does not show a commission line and a swap line, the number at the top is not a result.
Failure 3 — Hidden martingale and grid sizing
This is the mechanism behind almost every “98% win rate” EA on the market. Instead of accepting a loss, the robot opens another position in the same direction at a worse price, often at double the size. Price only has to retrace a little for the combined basket to close green. Do this consistently and your win rate approaches 100%, your equity curve looks like a ruler, and your account has a hidden, unbounded liability.
Then a trend arrives that does not retrace — a central bank surprise, a CPI or NFP shock, a policy shift — and the doubling that produced 400 small wins produces one loss larger than every one of them combined. The strategy did not stop working. It was always this; you were just in the part of the cycle where it looks like genius.
Grid robots are the same trade wearing a different hat: place orders at fixed intervals above and below price, harvest the oscillation, accumulate exposure in a trend. Both are short-volatility strategies sold as trend-agnostic income. If an EA description mentions “recovery mode”, “smart averaging”, “no stop loss needed” or “grid distance”, that is what you are buying.
Failure 4 — One lucky year
Markets change character. A breakout robot looks like a genius in a trending year and bleeds all of it back in a choppy one; a mean-reversion robot does the reverse. Show a strategy only its best year and it looks like an edge. Show it seven years separately and you find out whether it has one. This is why per-year testing matters far more than a single headline return, and it is the check that vendor marketing almost never shows you.
3. What an honest backtest has to include
A backtest is not evidence that a robot works. It is evidence that a robot would not have obviously failed, which is a much weaker and much more useful claim. To carry even that weight, it needs five things.
1. Real, multi-year data
Enough history to include a trending regime, a ranging regime and at least one shock. A robot validated only on 2020–2021 has never seen a hiking cycle. Several years is the floor, not the goal.
2. Costs you did not choose to be flattering
Spread, commission and swap, at retail levels rather than raw institutional ones unless you actually trade a raw account. Then re-run it with costs deliberately worsened. A strategy that survives a stress-cost run has a real margin; one that only works at zero spread has none.
3. Out-of-sample separation
Tune on one slice of history, test on a slice you never looked at. If performance collapses out-of-sample, you found a curve fit, and that is a successful test — it just failed.
4. Drawdown quoted as loudly as return
A +266% year with a −66% max drawdown is not a good year for most people — it is a year almost nobody would actually have sat through. Ask what the worst peak-to-trough was and how long it lasted, then ask honestly whether you would have kept the robot running through it.
5. Enough trades to mean anything
Thirty trades is an anecdote. A few hundred across several years and more than one instrument starts to be a sample. Robustness across pairs matters too: a rule that only works on one pair is usually describing that pair's recent history, not a market behaviour.
None of this makes a backtest predictive. It makes it falsifiable, which is the most any historical test can offer.
The rest of this guide walks through what that process looks like in practice, using RoboticEA as the worked example — a no-code builder that runs each of these steps as its own screen, which makes it a convenient way to show the whole chain from idea to a compiled MetaTrader 5 expert advisor.
4. Building your own, step 1 — composing the rules
The structural problem with buying a robot is that a compiled .ex5 file is opaque. You cannot see whether it martingales, check what costs its backtest assumed, or re-run it on your years, your pair and your broker's spreads. You are asked to trust a number produced by the person selling you the number. Building removes that asymmetry, and it no longer requires learning MQL5.
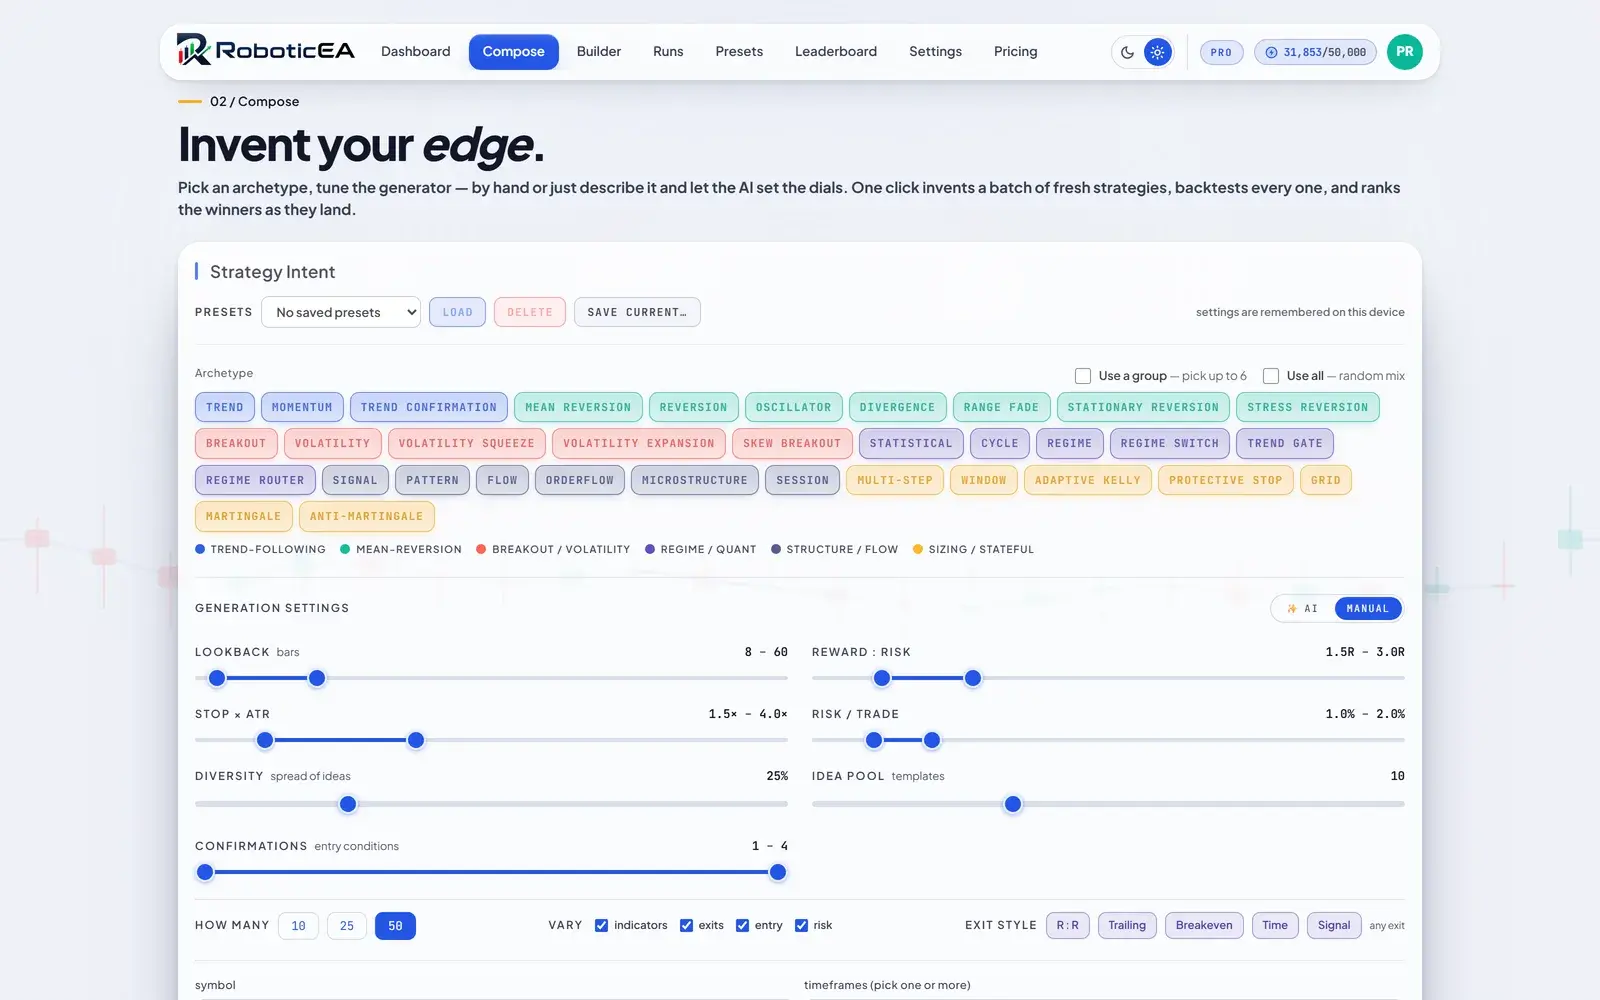
The composing step starts from an archetype rather than a blank page — trend, momentum, mean reversion, breakout, volatility squeeze, regime switch and so on. The builder shown here ships 34 archetypes across 6 families, and you either set the dials by hand or describe the idea in plain English and let the AI tuner set them.
The important habit here is setting ranges rather than single values — lookback 8–60 bars, stop 1.5–4.0× ATR, reward:risk 1.5R–3.0R, risk per trade 1–2% — and generating a batch of 10 to 50 candidates that all get backtested. A batch across ranges shows you the parameter plateau from failure 1, which a single hand-tuned strategy never can.
Or start from a preset
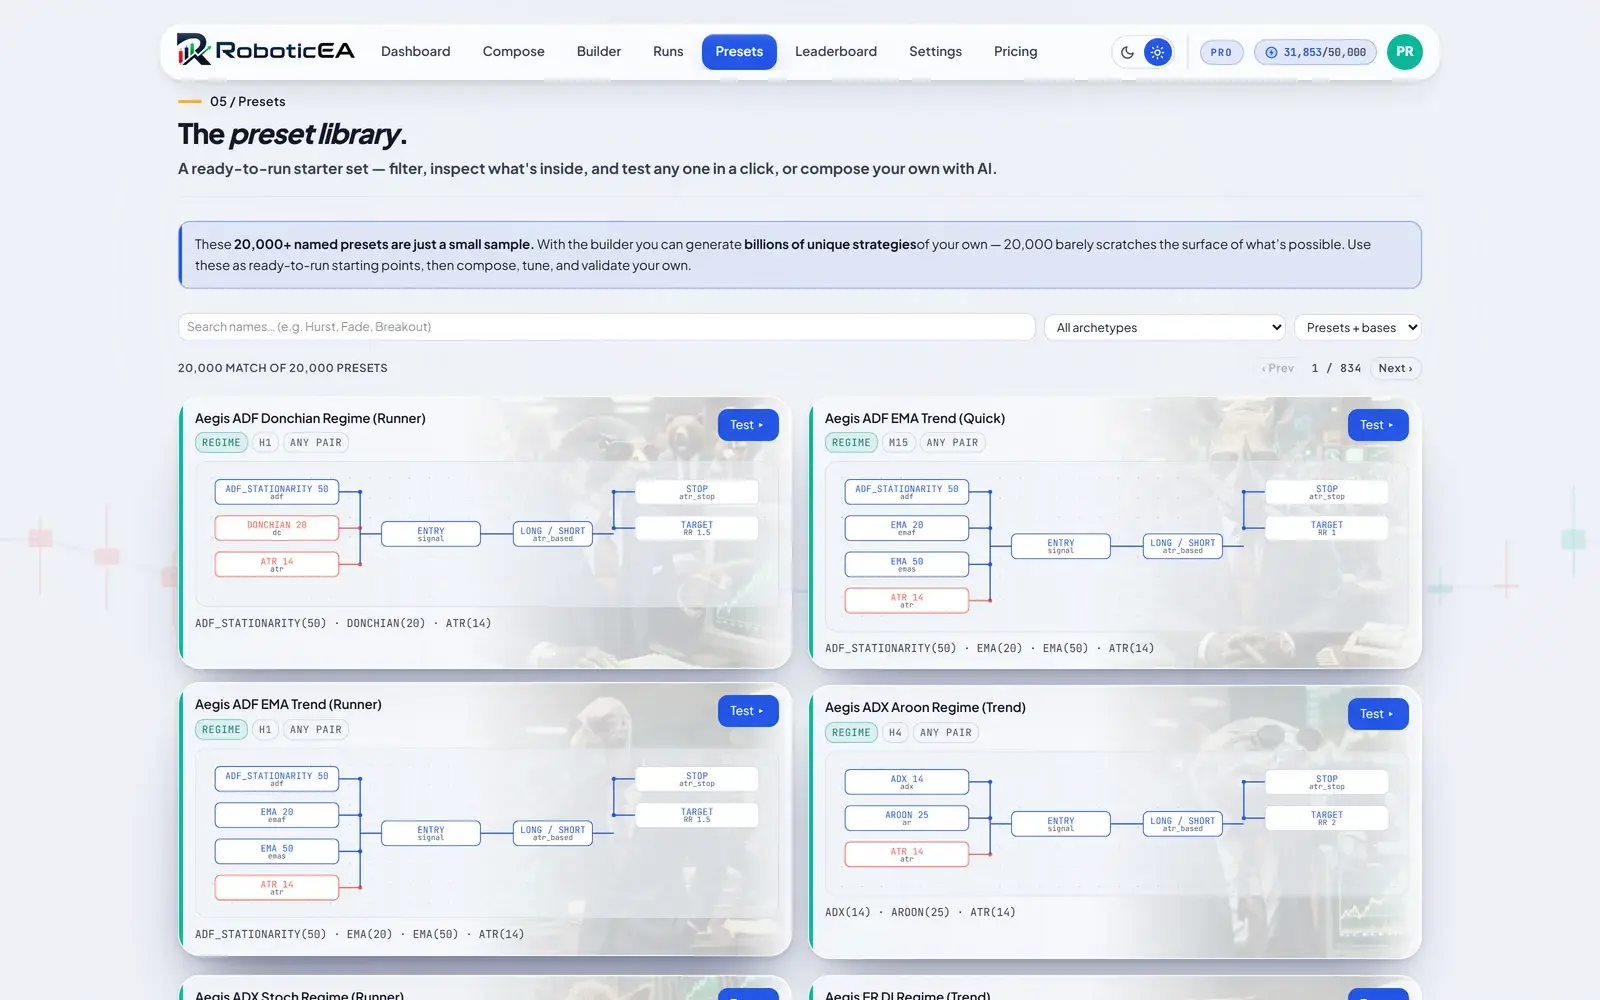
If you would rather begin from something that already exists, the preset library holds around 20,000 named presets plus 74 tunable native strategy types, filterable by archetype and testable in one click. Each card shows its full schematic and its indicator list up front, so you can see what a strategy does before you spend anything running it.
Then open it and change anything
The visual builder in the header image is where composed or preset strategies become editable: every indicator, threshold and exit is a block you can change, and the run configuration — symbol, timeframe, year, cost preset, risk per trade — sits on the same screen as the result. This is the part a purchased EA structurally cannot give you. When a robot underperforms, you can find out why instead of guessing.
5. Step 2 — backtesting with real costs
Every strategy runs from a fixed $10,000 account on real market data spanning 2020 to 2026, across 25 instruments and 6 timeframes. The fixed starting balance matters more than it sounds: it makes every result on the platform directly comparable, and it stops a strategy from looking impressive because it was quietly given more capital to work with.
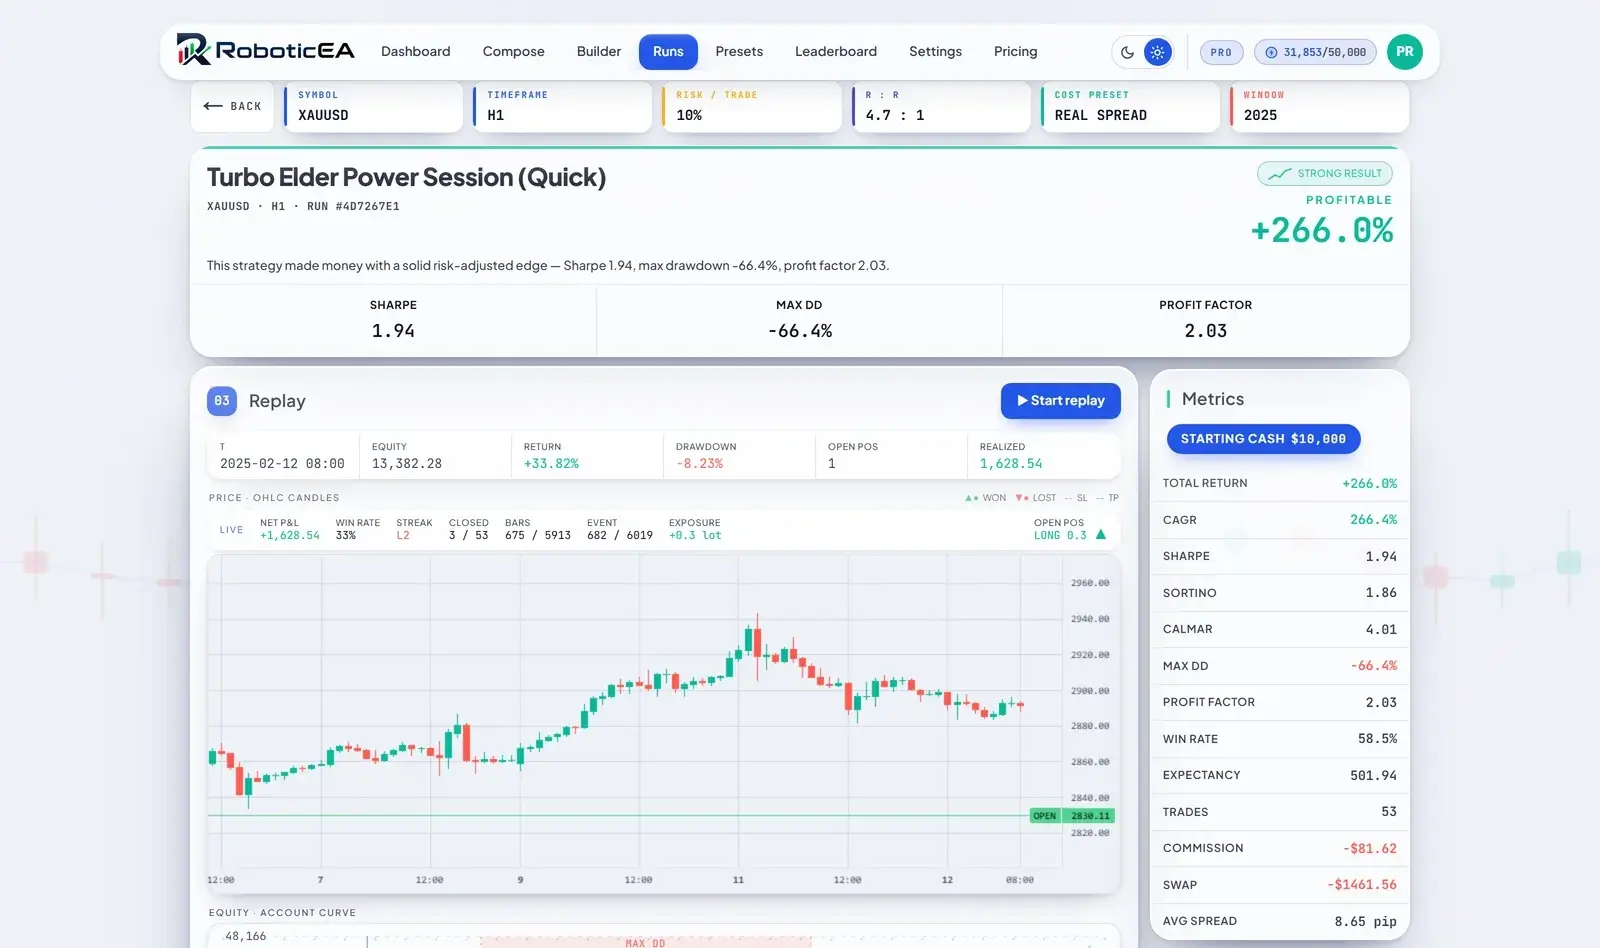
The result opens with a plain-language verdict rather than a wall of numbers — and, usefully, the drawdown is in the summary sentence rather than buried three screens down.

Underneath it, the full metric set: return, CAGR, Sharpe, Sortino, Calmar, max drawdown, profit factor, win rate, expectancy and trade count — alongside the three lines that decide whether any of it is real. Commission, swap and average spread are reported as charged amounts, not assumptions, using real spread by default rather than a frictionless zero.
The monthly returns row is worth more attention than most traders give it. A year that ends +266% having gone −29.5% in July is a very different experience from the same number arriving smoothly, and the month grid is where that shows up.
6. Step 3 — validating across every year
This is the step that answers failure 4, and it is the single most useful feature in a robot builder. Validation re-runs the strategy on every year of its instrument as separate, replayable backtests and lays the results out as a grid: mean percent per year, an N of 7 profitable tally, the range from worst to best, the worst drawdown, and a green or red chip per year.
It also runs automatically on the winners of a batch — anything that clears your return threshold gets validated across all years without you asking. That default matters, because manually validating is exactly the step an optimistic trader skips after seeing a good number.
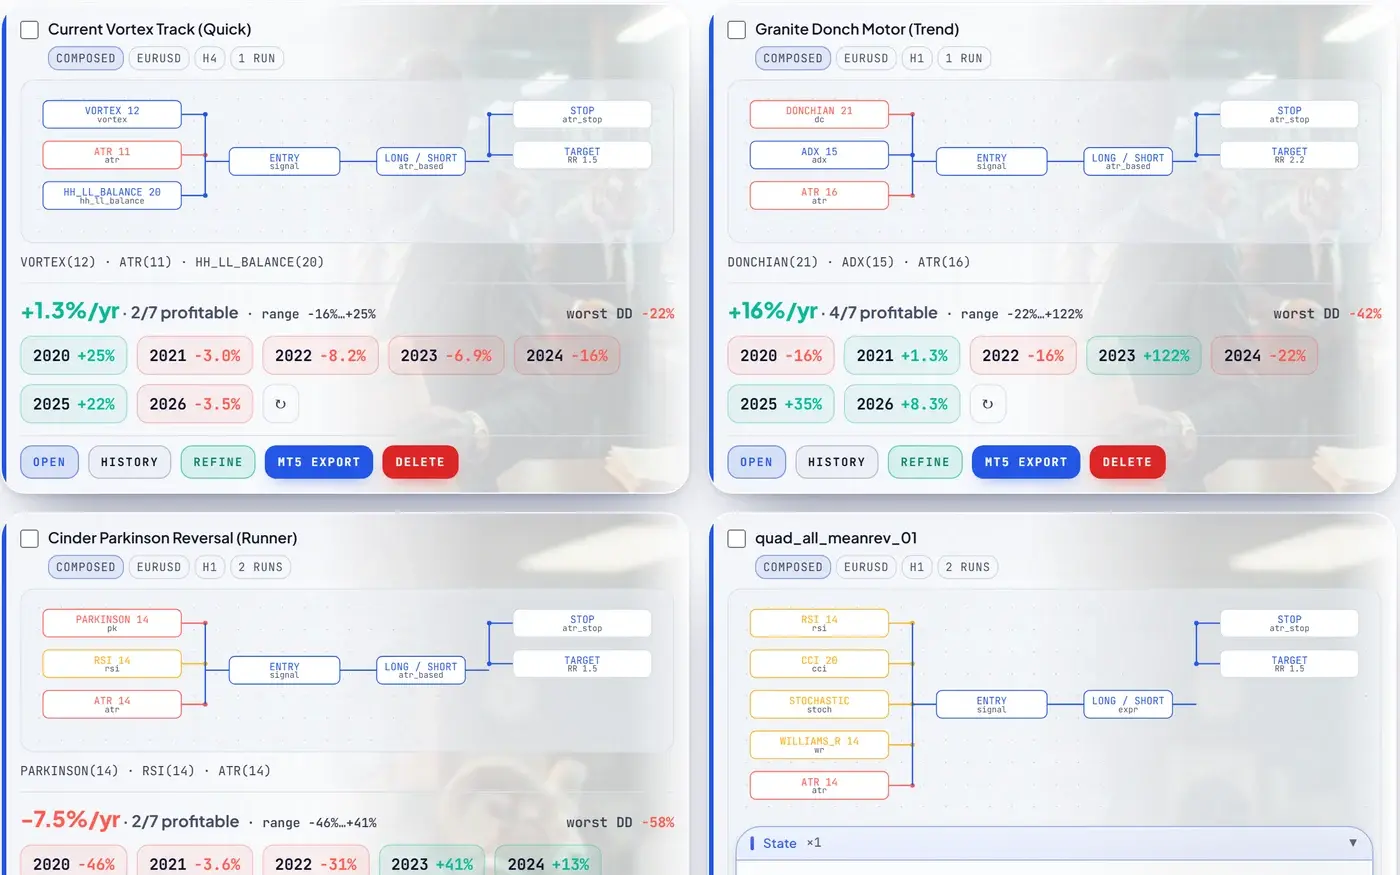
How to read that grid. “2 of 7 profitable” with a range of −16% to +25% is not a strategy, it is a coin flip with extra steps — and it is exactly the kind of thing that would have been sold to you as an EA on the strength of its 2025 result alone. What you want is a boring grid: most years positive, no single year carrying the whole average, and a worst drawdown you could actually sit through.
7. Step 4 — refining variations for robustness
Remember the plateau test from failure 1: robust parameters have neighbours that also work. The variation refiner automates exactly that check. It spins up to 50 perturbed copies of a strategy — nudging indicators, exits, entry thresholds or risk sizing by a chosen percentage — and backtests every one against the same battery of years as the baseline.
The part that makes this more than a parameter sweep is the robustness invariant. You set a condition every test period must satisfy — positive return every year, by default — and a variation is only promoted if it beats the objective and preserves the invariant. A bigger headline number that breaks the invariant is flagged FRAGILE rather than promoted. That is a rule that deliberately refuses to reward the most impressive-looking result, which is the opposite of how optimisation usually goes wrong.
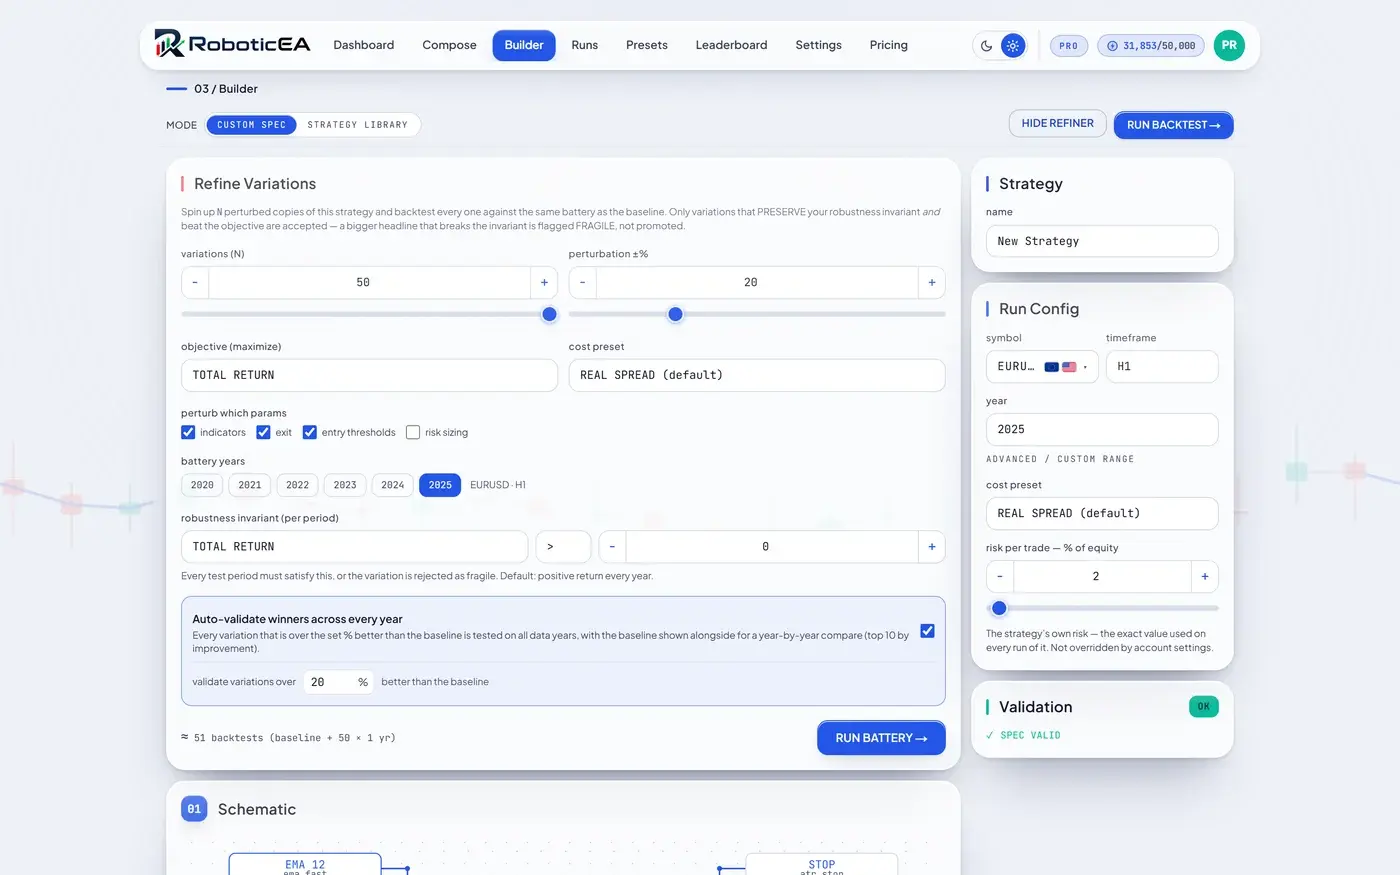
One caution worth stating plainly, because it applies to every tool in this category: being able to generate and test hundreds of strategies is genuinely useful, and it is also a superb way to overfit. If you produce 500 candidates and keep the best one, you have not found an edge — you have run a lottery and kept the winning ticket. The invariant and the per-year grid exist precisely to make that harder, but they only help if you actually let them reject things.
8. Step 5 — replaying the trades
A summary metric tells you what happened. A replay tells you how, and it is the fastest way to catch a robot doing something you did not intend. Press play and the strategy re-runs bar by bar on real OHLC candles, with entry and exit markers, stop-loss and take-profit lines drawn on the chart, and the equity curve building underneath in sync. Live read-outs for net P&L, win rate, current streak and exposure update every bar, at speeds from 1× to 8×.
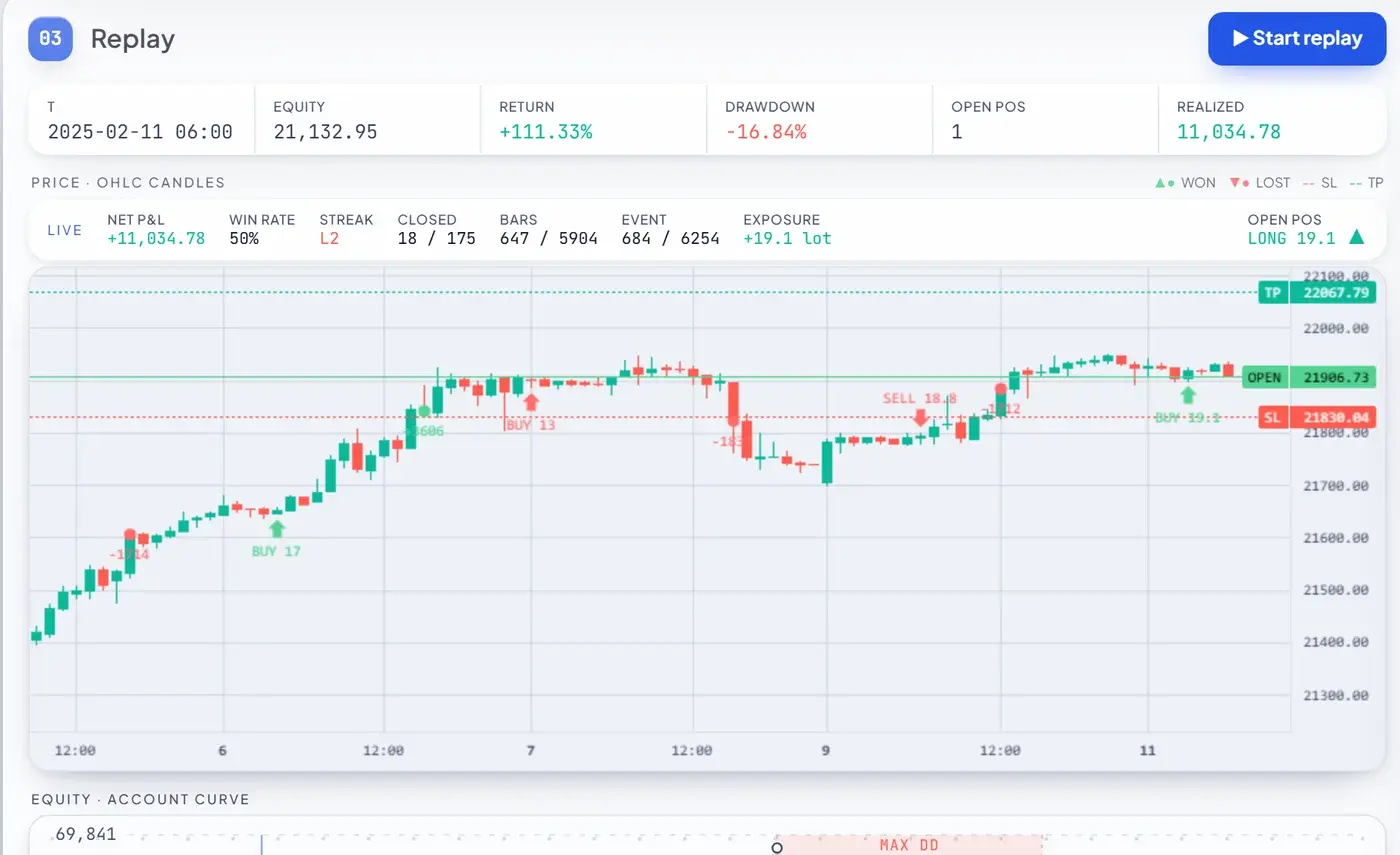
The jump controls are the useful part in practice: skipping directly to the biggest loss and the start of the max drawdown answers the two questions that actually decide whether you can run a robot — what does its worst trade look like, and what was happening while the account was underwater. A strategy whose drawdown comes from one bad week is a very different proposition from one that bled for four months.
9. Step 6 — the automatic leaderboard
Every backtest you run lands on a personal leaderboard automatically — nothing to save, tag or file. It is filterable by symbol, timeframe, year, cost preset and risk, and sortable by any metric, which turns a pile of experiments into something you can actually compare.
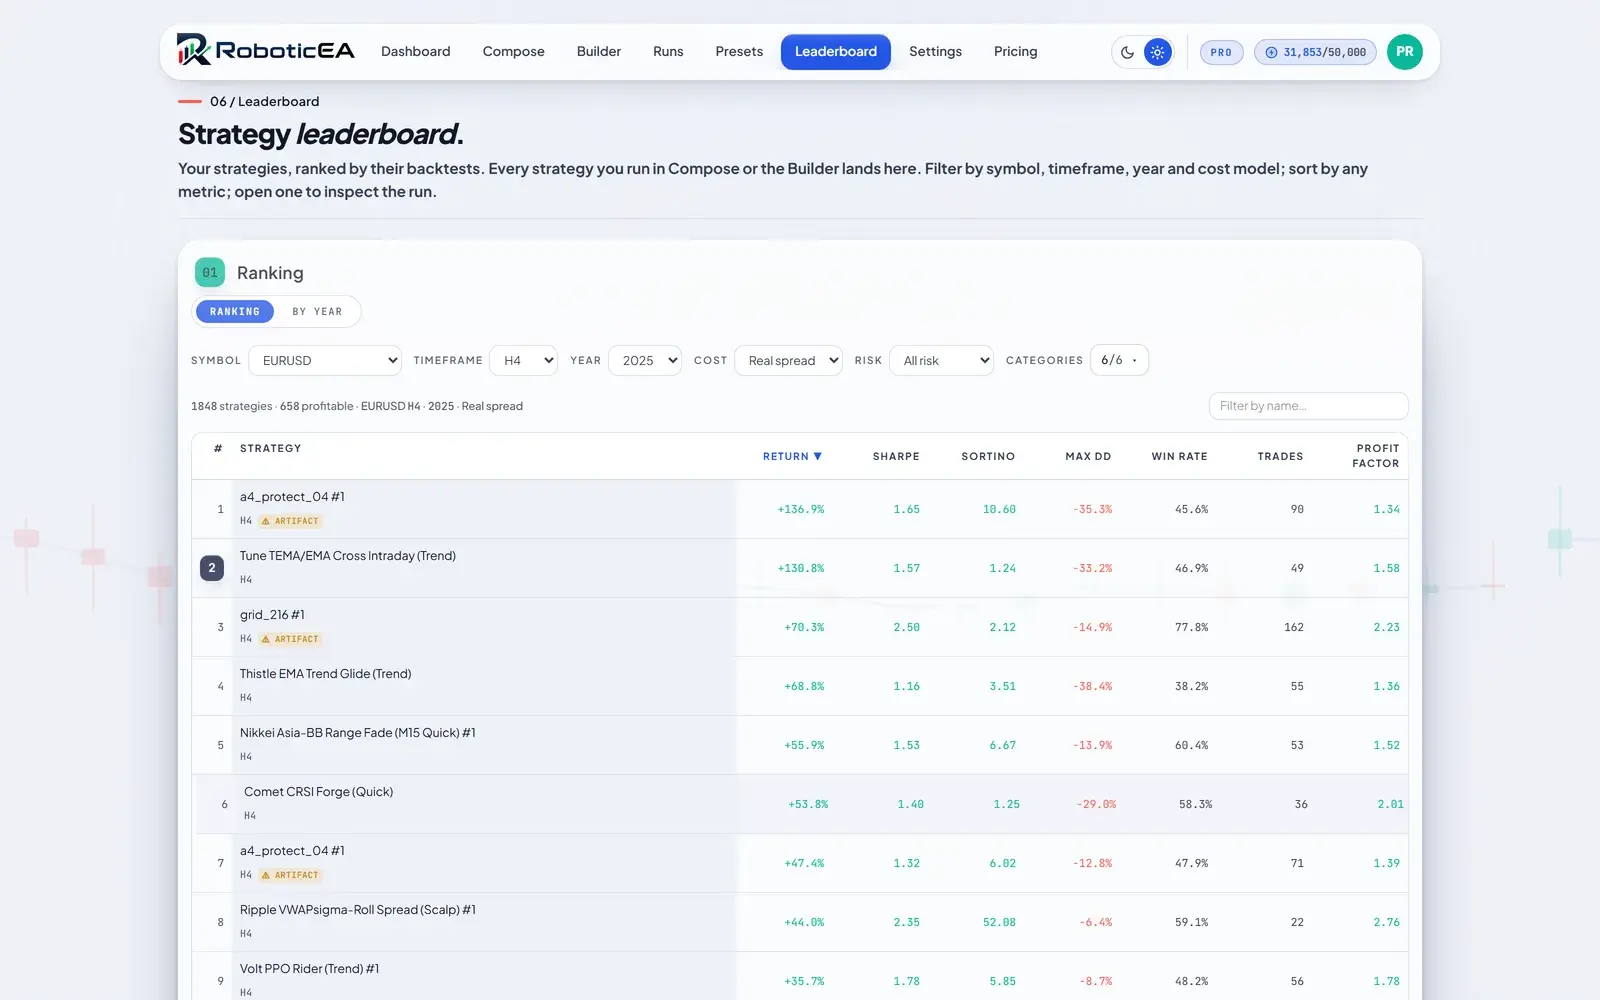
Sorting by return is the obvious move and the wrong one. Sort by max drawdown ascending and the list reorders completely: the strategies at the top of the return column are frequently the ones you could never have held. Read results in this order instead:
- Max drawdown first. This decides whether you can actually run the thing. If it is worse than you can tolerate, nothing else on the row matters.
- Trade count. Under a hundred and you are reading noise. Also check it against the period — 2,000 trades in a year on H4 means something is stacking positions.
- Profit factor. Gross profit over gross loss. Below about 1.2 there is very little room for the spread to widen or your broker to differ from the test.
- Win rate, read backwards. High is suspicious, not good. Above 90% on anything other than a very short-target scalper, assume averaging down until proven otherwise.
- The equity curve shape. Real strategies have ugly curves with flat months and sharp drawdowns. A smooth 45-degree line is the visual signature of the martingale mechanism in failure 3.
- Return, last. Only once the five above are acceptable does the headline number carry information.
The same reading order works on vendor marketing, and it is usually faster: most sales pages lead with win rate and total return and omit drawdown entirely, which answers the question before you have finished asking it. Our guide to AI trading scam red flags covers the rest of the pattern.
10. Step 7 — export and compile for MetaTrader 5
A strategy that only exists inside a web tool cannot trade. At some point it has to become an expert advisor running in a terminal connected to your broker.
Source, not a binary
The export produces a readable .mq5 file, not a compiled .ex5. That difference is the whole argument for building over buying: you can read exactly what your robot will do, confirm the exported logic matches what you tested, and change it.
There is a source preview before you download, and MT5 export is available even on the free tier.
The four-step install
- Export and download the
.mq5file. - Drop it into your terminal's
MQL5\Expertsfolder. - Open it in MetaEditor and compile with F7.
- Attach it to a chart and enable AutoTrading.
Your account-level trading rules travel with it. Flatten before weekend and avoid daily rollover (the 21:00–22:00 UTC window) are on by default and are written into the exported EA as inputs, so the robot behaves the same way in MetaTrader as it did in the backtest rather than quietly dropping the safeguards at the border.
Expect the numbers to differ — and check how much
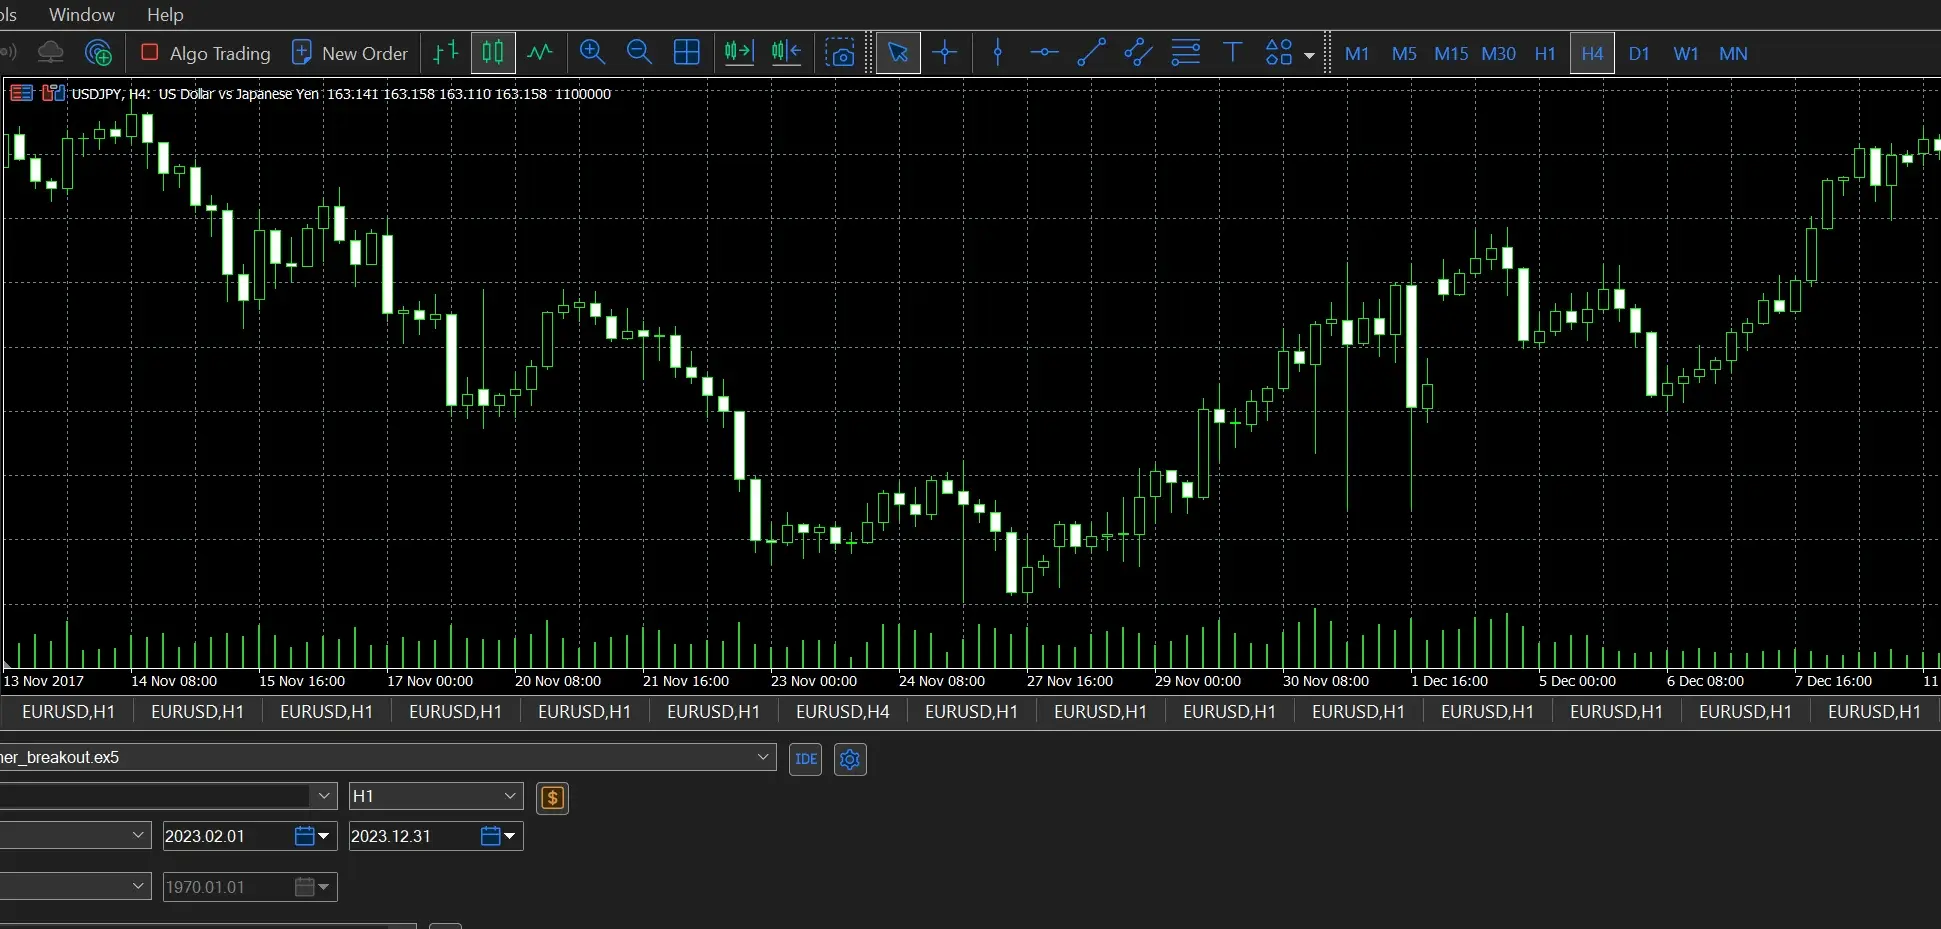
Run it in MetaTrader's Strategy Tester before it goes anywhere near a live account, on your broker's data and spreads. A good builder will be upfront that the MT5 tester will not reproduce its engine's numbers exactly, because your broker's feed, spreads and swaps are not the ones in the backtest — and that is true of every builder in this category, whether or not they say so.
What is unusual is publishing the size of the gap. Their parity study runs 100 EURUSD strategies through both their engine and MetaTrader 5 on identical bars and reports the result: 95% land within 5% on trade count (rising to 97% for ordinary entry/exit strategies), with a median trade-count gap of 0.3% and a median return gap of 1.1 percentage points. Position-stacking strategies — grids and martingales — account for nearly all the remaining disagreement.
The practical heuristic: a few percent difference in trade count between two engines is expected and fine. A large divergence is a signal — your strategy is sensitive to execution details, which means it will also be sensitive to your broker, your latency and your spread. Strategies whose results survive a change of engine are the ones whose results might survive a change of broker. And worth repeating: both sides are simulations. Agreement between two backtests is evidence of consistency, not of profitability.
11. Where AI actually helps — and where it does not
“AI trading robot” is now the default marketing phrase, and it hides two completely different products.
The first is AI in the build step: using a model to propose strategy structures, set parameter ranges from a plain-English description, and generate and score hundreds of candidates far faster than a human could. This is real and genuinely useful — it is what the compose screen in section 4 is doing. It is also where the overfitting risk multiplies, for the reason in section 7: searching a larger space finds more strategies that look good by luck.
The second is AI in the execution step: a black box that decides trades live, in ways nobody can inspect. This is where almost all the scams live, and it is worth being blunt that a system you cannot audit is indistinguishable from a random number generator with good marketing. We covered this in more depth in AI trading in 2026 — does it actually work?
There is also a third position, which is where ChartSnipe sits and which is worth naming because it is not a robot at all: AI as research support for a discretionary trader. You still choose every trade. The AI reads the chart, maps support and resistance, scores the day's macro news, and tracks currency strength across the majors — the preparation work — and then gets out of the way. No orders are placed on your behalf.
These three are not competitors so much as different answers to the question of how much control you want to hand over. Plenty of traders end up doing both: a robot running a well-tested mechanical strategy on one account, and discretionary trading informed by AI research tools on another. What does not work is buying a black box and calling it either one.
12. The pre-live checklist
Before a robot touches funded capital, whether you built it or bought it:
- ✓I can read every rule it follows, including its position sizing. If not, I do not run it.
- ✓It has been tested year by year, not just on one favourable period.
- ✓Spread, commission and swap were charged, and it still works when I make them worse.
- ✓It was tested on data that was not used to choose its parameters.
- ✓Nearby parameter values perform similarly — a plateau, not a spike.
- ✓I know its worst drawdown and its longest losing streak, and I can sit through both.
- ✓It compiled cleanly and ran in MetaTrader's own Strategy Tester on my broker's data, and broadly agreed.
- ✓It has run forward on demo for months at the exact settings I intend to trade.
- ✓I have decided in advance what result makes me switch it off, and written it down.
That last one is the one people skip, and it is the one that matters most. A robot with no shutdown condition is not a strategy — it is a standing order to keep losing until you lose your nerve, which will happen at the worst possible point in the drawdown rather than a planned one.
Frequently asked questions
Do forex robots actually work?
Some do, most do not, and the ones sold to retail traders almost never do. A robot is only a set of rules executed automatically — it has no edge of its own. If the rules have an edge that survives realistic costs and out-of-sample data, automation executes it faithfully. If they do not, automation just loses money faster and without hesitation.
Why do most forex EAs fail after you buy them?
Curve fitting, backtests run without spread, commission and swap, hidden martingale or grid sizing that hides an unbounded liability behind a smooth equity curve, and a single lucky test year that was never checked against the other six. In most cases more than one of the four is present at once.
What is the difference between a trading robot and an expert advisor?
In practice, nothing. “Expert advisor” is the MetaTrader-specific name for an automated program written in MQL4 or MQL5 that runs attached to a chart. “Trading robot” and “trading bot” are the generic terms for the same thing.
Is a 99% win rate forex robot a scam?
Effectively always. A 99% win rate is the signature of a strategy that takes tiny profits and refuses to close losers, usually by averaging down. The wins are small and frequent, the loss is single and catastrophic. Any robot advertised on win rate rather than drawdown, profit factor and out-of-sample performance is showing you the wrong number deliberately.
Can you build a forex robot without knowing how to code?
Yes. No-code builders let you assemble a robot from indicator, entry, exit and sizing blocks, backtest it, and export MetaTrader source you compile yourself. The better ones ship dozens of strategy archetypes, a visual schematic builder, a library of ready-made presets, and one-click .mq5 export — here is what that workflow looks like end to end. You never write MQL5 — but you can read every rule the robot follows.
How do you export a strategy to MetaTrader 5?
Four steps: export and download the .mq5 source, place it in your terminal's MQL5\Experts folder, open it in MetaEditor and compile with F7, then attach it to a chart and enable AutoTrading. Because you receive source rather than a compiled binary, you can read exactly what the robot will do before it places an order.
How much does it cost to build your own trading robot?
Hiring an MQL5 developer typically runs a few hundred to a few thousand dollars, plus revisions each time the rules change. No-code builders are much cheaper — expect a usable free tier and paid plans in the $49 to $129 per month range, typically metered per backtest. The real cost of a robot is never the build; it is the testing you skip.
How long should you backtest a forex robot before going live?
Several years at minimum, covering at least one trending and one choppy regime, then months of forward testing on demo at the exact settings you intend to trade. A backtest is a hypothesis. Forward performance is the only evidence.
Is ChartSnipe a trading robot?
No. ChartSnipe does not place trades and has no connection to your broker. It analyses chart screenshots, maps support and resistance, and publishes daily AI news impact analysis — research support for a trader who makes and executes their own decisions.
Prefer to make the call yourself?
ChartSnipe is the other end of the spectrum from a robot: AI that does the preparation — pattern detection, support and resistance, daily news impact across 12 instruments, live currency strength on all 8 majors — and leaves the decision with you. Two free analyses, no card.