Forex Session Times: Best Time to Trade Each Pair (2026 Guide)
Sydney, Tokyo, London, and New York — which session owns each pair, the typical volatility you should expect, and the exact window to trade EUR/USD, GBP/JPY, USD/JPY, and gold.
Forex trades 24 hours a day for five and a half days a week, but not all hours are equal. The same pair that chops sideways through a dead Asian session can deliver a 60-pip trend move in the first 30 minutes of London. The same cross that rips cleanly during the London-New York overlap can go completely untradable by 8:00 PM UTC. If you do not know which session owns the pair you are trying to trade, you are fighting the market before you have entered.
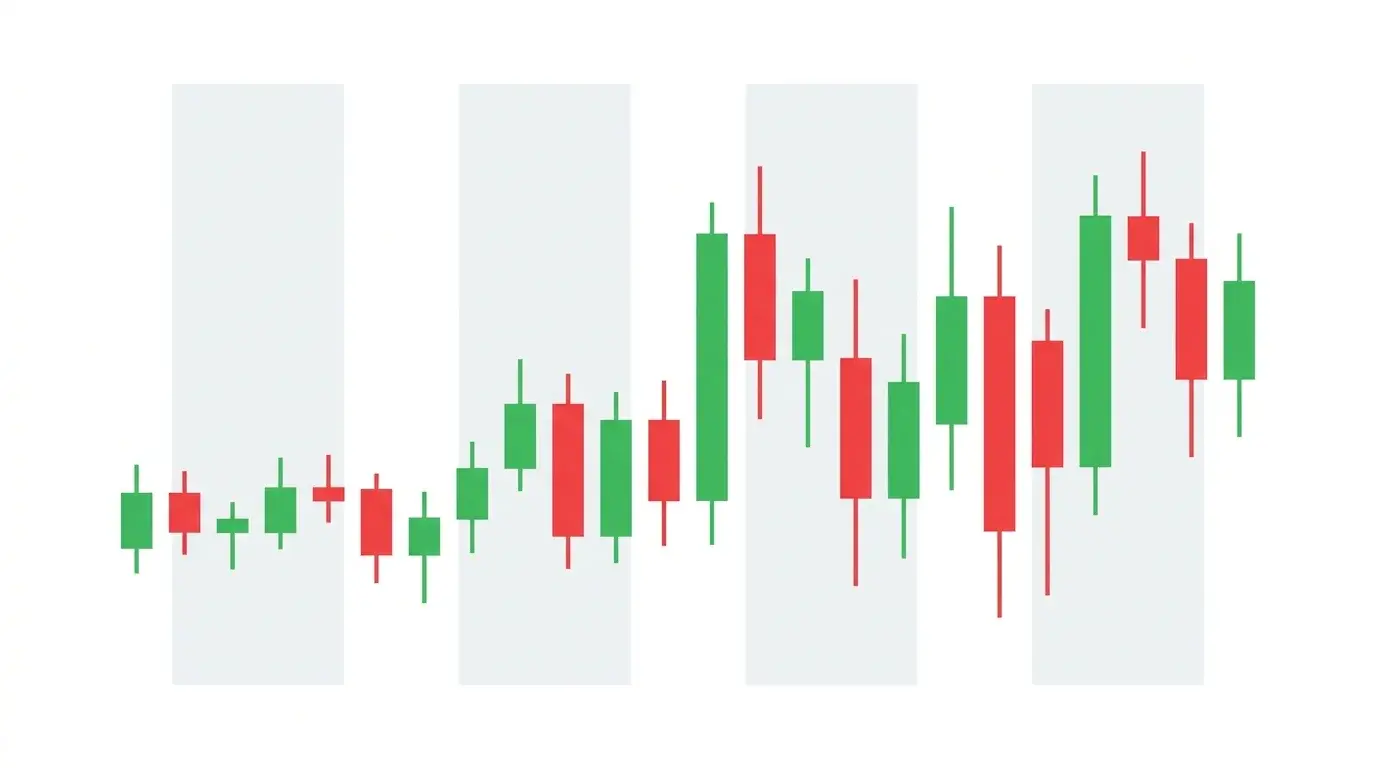
This guide walks through every meaningful window in the forex trading day — from the sleepy Sydney open to the brutal London-New York overlap to the weekend-gap risk at the Friday close. Each section comes with a chart diagram showing what the session typically looks like, the pairs that come alive during it, and the cleanest strategy window within it. Pair this with a live view of ChartSnipe's 32-instrument dashboard and you have the full picture for every trading hour of the week.
Key Takeaways
- →London open (07:00 UTC) delivers the single biggest daily volatility burst. The first two hours own the tape.
- →The London-NY overlap (12:00-16:00 UTC) is where the tallest candles of the day print. Peak volume and cleanest trends.
- →The Asian session is range-fade territory on everything except JPY pairs during BOJ days and AUD/NZD during Aussie data.
- →New York open at 13:00 UTC almost always produces a first-hour reversal — the opening extreme gets faded.
- →Friday NY close carries real weekend-gap risk — flat Friday into any geopolitical headline is a survival habit.
1. Sydney Open (22:00 UTC) — The Quietest Window of the Day
The Sydney open at 22:00 UTC is technically the start of the forex trading week on Sunday and the start of every trading day thereafter. In practice it is almost always the quietest two-hour window of the cycle. London desks are closed. New York desks have gone home. Tokyo is still waking up. The only pairs that move with any conviction are AUD/USD, NZD/USD, and the AUD and NZD crosses — and even those only move when Australian or New Zealand data is on the calendar.
What this means for a trader: do not trade the Sydney open unless you have an Aussie or Kiwi data release to trade. The spreads are wider, the order books are thin, and the candles that do print are often single-desk squeezes that reverse the moment a real bid or offer shows up. The session is most useful as a planning window — review the day ahead, mark your levels, set your alerts.
The one exception worth flagging: the Sunday afternoon Sydney reopen after a weekend of news can produce genuine gap volatility on JPY crosses, gold, and the commodity dollars. If geopolitical headlines hit over the weekend, the first hour of Sydney on Sunday is where the repricing begins — and it can be violent before any major desk is online to stabilise it.

2. Tokyo Open (00:00 UTC) — JPY-Pair Volatility Wakes Up
The Tokyo open at 00:00 UTC is where the Asian session actually comes alive. Japanese exporters, importers, and the Bank of Japan itself are active — and every one of them transacts in JPY. The result is that USD/JPY, EUR/JPY, GBP/JPY, and AUD/JPY get their single most active window of the day in the first two hours after Tokyo opens. Outside of those pairs, volatility remains modest.
The specific flows to watch: Tokyo fix at 09:55 JST (00:55 UTC) is the official BOJ fix where Japanese exporters convert dollar revenues back into yen. The fix has a directional bias month-end that can push USD/JPY 20-40 pips in minutes. And on any day with BOJ commentary, MoF intervention chatter, or CPI/Tankan data, the Tokyo session candles can be the largest of the entire 24-hour cycle for JPY crosses.
For non-JPY pairs, the Tokyo open is still relatively sleepy. EUR/USD, GBP/USD, and the commodity dollars often trade inside a tight 20-30 pip range for the entire Tokyo window. If you are not trading yen, Tokyo is another session to plan around rather than trade through. For the full breakdown of which pairs deserve your attention when, our guide to the forex pairs smart money actually trades ranks them by session personality.

3. The Asian Range (Midnight to Dawn UTC) — Range-Fade Territory
Between roughly 00:00 and 06:00 UTC the market settles into what traders call the Asian range — a tight, mean-reverting box defined by the high and low of the Asian hours. Outside of JPY pairs during data, most major currencies oscillate inside a 30-50 pip range, repeatedly tapping the upper and lower bounds without breaking them. This is the cleanest range-fade environment of the entire 24-hour cycle.
The strategic value of the Asian range is not that you should always trade inside it — it is that you should always mark it. The Asian high and Asian low become critical reference points for the London open. When London breaks one of the boundaries, it is often the intraday trend direction. When London sweeps both boundaries before picking one, it is a stop-run pattern that traps everyone who entered early.
The most common Asian-range trap is getting bored and fading the range one too many times. The third or fourth touch of the Asian high is usually the one that breaks through into the Frankfurt open. Respect the range, but also respect the fact that it has a shelf life — usually six hours, max.

4. Frankfurt Open (06:00 UTC) — European Liquidity Arrives
The Frankfurt open at 06:00 UTC is the unofficial start of the European session and the first real burst of liquidity the market has seen in hours. German, French, and Swiss desks come online. EUR/USD, EUR/GBP, and EUR/CHF get their first proper two-way flow. The candles that print in the first hour of Frankfurt are typically the largest of the entire Asian range, and they frequently break whichever boundary London is going to extend.
The tactical play is to watch the first Frankfurt break of the Asian range. If Frankfurt breaks the Asian high with conviction, London usually extends higher. If Frankfurt breaks the Asian low with conviction, London usually extends lower. Frankfurt is essentially the scout that tells you which side of the range London is going to commit to. It is not always right — but it is right more than it is wrong.
For traders in Asia or the US who cannot stay awake for London, Frankfurt is the earliest session that offers real tradable volatility. The order books are thinner than London proper, so spreads can spike during news releases, but on a clean news-light morning Frankfurt can deliver most of the cleaner moves before London even opens.

5. London Open (07:00 UTC) — The Biggest Volatility Burst of the Day
If there is one window every forex trader should know by heart, it is the London open at 07:00 UTC. London is the largest FX trading hub on earth — roughly 40% of global daily forex turnover routes through it. When London hits the bid, spreads tighten, volume explodes, and the tape finally has the depth to support sustained directional moves. The first 30 minutes of London regularly produces the single biggest candle of the entire 24-hour cycle on GBP/USD, EUR/USD, and USD/JPY.
The classic London setup is the Asian range sweep and reverse. Price runs into the Asian high, takes out the stops sitting just above it, then reverses violently back through the range and breaks the Asian low. Alternatively, price runs the Asian low, then reverses and breaks the Asian high. Either way, the day's dominant trend is usually set within the first hour of London, and chasing the first candle of London is as close to a guaranteed way to get wicked out as exists in forex.
Wait for the first 15 minutes to complete. Mark the high and low of that first bar. When a second candle takes out one of those extremes with conviction and closes beyond it, that is the London open trend direction. If you only trade two hours of forex a day, make them the London open hours — the setup count and the quality both peak here.

6. London Mid-Session — The Cleanest Trending Window
Between roughly 09:00 and 12:00 UTC, London settles into its mid-session stride. The initial breakout volatility from the open has faded, the news schedule is lighter, and the market typically grinds in the direction set during the first hour. This is the highest-probability trend-continuation window of the entire day — pullbacks to the 20 EMA or 50 SMA on the 15-minute chart are cleaner here than in any other window.
The strategic read: if the London open committed to a direction and you missed the initial entry, the mid-session pullback is your second chance. The first pullback to a prior horizontal level, a dynamic moving average, or a Fibonacci 61.8 retrace of the morning impulse usually holds cleanly. By the time the London-NY overlap arrives at 12:00 UTC, the trend has already run further and chasing becomes expensive.
There is one caveat: London mid-session gets destroyed on ECB decision days, UK data days, and the occasional red-folder release in the 09:30 UTC window. If the economic calendar is hot, the clean trend gets replaced with news-driven choppiness. On a clean news-light morning, London mid-session is arguably the single most tradable three-hour window in the entire week.

7. London / New York Overlap (12:00-16:00 UTC) — Peak Volume
The four-hour window from 12:00 to 16:00 UTC is the single busiest block in the forex market. London desks are still active and New York desks have come online. Combined, they account for roughly 70% of daily global FX turnover. The tape gets its tightest spreads, its deepest order books, and its biggest candles. If a trend is going to extend, this is where the extension happens. If a reversal is going to form, this is where the reversal gets confirmed.
The overlap is also where every major US data release lands — NFP at 12:30 UTC, CPI at 12:30 UTC, FOMC at 18:00 UTC (just after the overlap ends). The combination of huge volume and event-driven catalysts means the tallest candles of the week almost always print in this window. For a deeper look at how these releases rank, our high-impact forex news events guide ranks the 15 that actually move pairs.
The tactical read: the overlap either extends the London trend or reverses it cleanly. If London was bullish and New York comes in bullish, expect a clean extension into 16:00. If London was bullish and New York opens with a bearish impulse, the whole morning trend frequently reverses. Watch the first hour of New York (13:00-14:00 UTC) for the tell.

8. New York Open (13:00 UTC) — The Classic First-Hour Reversal
The New York cash equity open at 13:30 UTC (14:30 BST in summer) and the official NY forex session open at 13:00 UTC deliver a characteristic intraday pattern: the first 60-90 minutes very often reverse the morning London direction. US desks take over from tired London desks, reposition portfolios, and frequently take profit on moves that have already run for six hours. The result is a distinct reversal window that traps late London continuation buyers.
The classic setup: London runs EUR/USD up 60 pips over six hours. NY opens at 13:00 UTC, price ticks another 10 pips higher into 13:30, then reverses hard and retraces 40 pips by 15:00. Traders who bought the breakout at the London high get stopped out on the NY reversal. Traders who waited patiently for the NY open extreme and faded it collect the cleanest trade of the afternoon.
Not every day reverses — on strong trend days NY simply extends the London direction. The tell is whether NY makes a new intraday high (or low) with conviction within the first 30 minutes. If it does, the trend extends. If NY fails to take out the London extreme and starts printing rejection candles, the reversal is on and it typically runs until 15:00-16:00 UTC.

9. New York Afternoon — The Fade Into the Close
Between 16:00 and 20:00 UTC, London desks hand off and New York runs the book alone. Volume drops roughly 40% from the overlap peak. Volatility fades. The tape gets quieter, the spreads widen slightly, and the market frequently settles into whatever direction the overlap confirmed. For trend-following traders holding positions from London or NY open, this is the cleanest hold window — the move that built through the overlap continues into the close with minimal drama.
For fresh entries, the NY afternoon is dangerous. The pool of active participants has shrunk, which means a single large order can push price through levels that would have held two hours earlier. Stop-runs become more common. Reversals become sharper. The trading quality degrades even when the direction is clear. Most professional day traders are flat by 18:00 UTC and done for the day.
The exception is FOMC days. On any Wednesday with a 18:00 UTC rate decision, the NY afternoon becomes the main event — the statement, the press conference, and the post-conference drift all land here. Our high-impact news events guide covers the full FOMC playbook.

10. NY Close + Weekend Gap Prep (20:00-22:00 UTC Friday)
The last two hours of the New York session — roughly 20:00 to 22:00 UTC — are the weakest volatility window of the active trading day. Most professional books are already flat. Major banks have marked their positions. The tape is mostly end-of-day housekeeping. Monday through Thursday, this window is simply quiet and unremarkable. Friday is a different story entirely.
Friday 20:00-22:00 UTC is the weekend-gap prep window. Any trader carrying a position into the weekend is exposed to two full days of headline risk with no market to exit through. Geopolitical shocks, central bank surprises, political developments, and war-era headlines all land over the weekend with no possibility of adjusting. The Sunday Sydney reopen frequently gaps 30-80 pips on major pairs after a hot news weekend, which is catastrophic for anyone running tight risk.
The survival habit: be flat into the Friday close unless you have explicit conviction to hold. The expected value of a random weekend hold is negative once you account for the gap-risk tail. In 2026's geopolitical environment — Iran, oil supply disruption, central bank intervention cycles — weekend gap risk is higher than at any point in the last five years. Flatten into 21:00 UTC Friday, mark the NY close, and start fresh at the Sydney reopen on Sunday.

ChartSnipe Pricing
- Free: 2 chart analyses per month + unlimited Trading Quiz
- Pro ($20/month): 120 analyses + Daily News Impact Analysis (BTC, FX, gold, indices)
- Premium ($50/month): 600 analyses + all features including Liquidity Snipe mode
See full pricing on the pricing page.
Frequently Asked Questions
What is the best forex session to trade?
The London session (07:00 to 16:00 UTC) and the London-New York overlap (12:00 to 16:00 UTC) are the two highest-volume, cleanest-trending windows of the entire 24-hour cycle. If you can only trade for a few hours a day, the first two hours of London and the first two hours of the London-NY overlap give you the majority of the week's volatility on the major pairs.
What time does the London forex session open?
The London forex session opens at 07:00 UTC (08:00 London time in winter, 07:00 London time in summer when the UK is on BST). Frankfurt technically opens an hour earlier at 06:00 UTC and delivers the first real European liquidity, but the big volatility burst arrives at 07:00 UTC when London hits the bid.
What is the London-New York overlap?
The London-New York overlap runs from 12:00 UTC to 16:00 UTC (08:00 to 12:00 New York time). This is the four-hour window when both London and New York desks are open and active at the same time. It produces the highest volume and the tallest candles of any window in the 24-hour cycle, especially on major pairs like EUR/USD, GBP/USD, and USD/JPY.
Should I trade the Asian session?
Only if you are trading JPY pairs on a Bank of Japan day, AUD and NZD around Aussie or Kiwi data, or you are specifically running a range-fade strategy against the Asian range high and low. For general trend-following the Asian session is dead quiet, and most of the cleanest price action starts with the Frankfurt open at 06:00 UTC.
When is the worst time to trade forex?
The Sydney session (22:00 to 00:00 UTC) is almost always the quietest window of the day outside of Aussie and Kiwi data releases. The last two hours of New York (18:00 to 22:00 UTC) are also treacherous because desks are winding down, liquidity is thin, and stop-runs are common. Friday afternoon into the weekend close is the riskiest window if you carry positions over the weekend gap.
The Bottom Line
Forex is not a 24-hour opportunity — it is a five-window opportunity wrapped in 19 hours of noise. London open. London mid-session. The London-NY overlap. New York open reversal. And the weekend-gap flat. Those five windows contain almost every clean trade the market has to offer. Everything else is a lower-probability skim.
Build your schedule around those five windows. Mark the Asian range before every London open. Plan for the NY open reversal before every 13:00 UTC. Flatten into every Friday close unless you have a genuine multi-day conviction trade. The traders who consistently pull money out of forex are not the ones who trade more hours — they are the ones who trade the right ones.
Sources & Further Reading
- • BIS Triennial Central Bank Survey — authoritative global FX turnover data by financial centre.
- • CME Group FX — session trading hours and major pair volume profiles.
- • Bank of Japan Statistics — Tokyo fix mechanics and BOJ intervention history.
- • Bank of England Markets — London FX market data and benchmark fixing windows.
- • Reuters Currencies — live coverage of intraday session moves across major pairs.
Related Articles

10 Forex Pairs Smart Money Actually Trades
The 10 pairs institutions actually trade, ranked by liquidity, edge, and session personality.

Currency Strength Meter Guide
How strength meters work, the strong-vs-weak pairing rule, and the four mistakes traders make.

High-Impact Forex News Events
The 15 releases that actually move FX pairs — ranked by pip movement and follow-through.
Written by the ChartSnipe Team
ChartSnipe is an AI-powered chart screenshot analysis tool and daily AI news impact analysis platform for forex, gold, Bitcoin, S&P 500, and Nasdaq traders. Our team combines deep experience in technical analysis, AI vision models, and live market data across 32+ instruments to deliver actionable trading insights.
See every session in context — live prices, strength, and AI-ranked pairs
Daily AI news impact analysis across 32 instruments. Session-aware context for every London open and NY overlap.
Open News Impact Dashboard