
Where Tokyo Steps In on USD/JPY
Japan and the US bought yen together at the end of July, and USD/JPY gave back most of the gain within weeks. It is back near 158, the finance minister is warning again, and every desk is watching 160. Here is how intervention works, why it fades, and how to survive the candle.
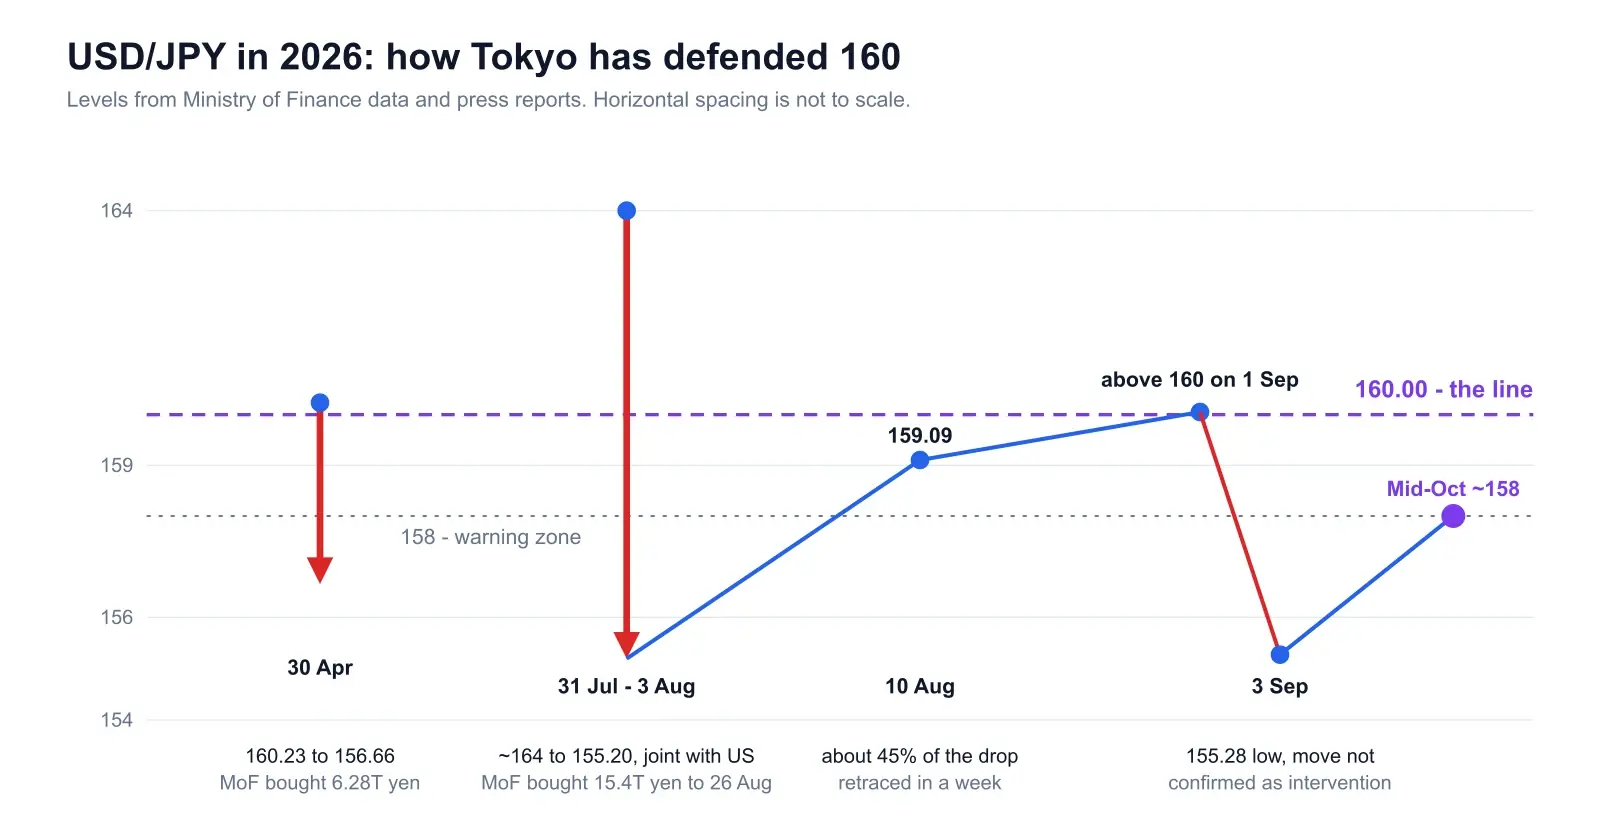
The yen’s chart this year reads like a staircase with a trapdoor. USD/JPY grinds up toward 160, officials get angrier in public, and then a candle of 350 pips or more erases weeks of gains in an afternoon. The trapdoor has opened twice in 2026. Traders who were long into it say the same thing: the stop did not matter, because the fill did not happen where the stop was.
USD/JPY is back around 158, and Finance Minister Satsuki Katayama keeps saying Tokyo and Washington have not changed their stance since the joint operation. That is the setup. For the structural story behind the climb, read why the yen keeps falling in 2026. This piece is narrower: what the Ministry of Finance does, in what order, how you can tell, and what to do with your position while it happens.
Key Takeaways
- →Tokyo defends speed, not a number. 160 is the market’s line, not the ministry’s, and USD/JPY traded above it on 1 September without a confirmed buy.
- →The escalation is a ladder: watching, “respond appropriately”, “decisive measures”, “the time is approaching”, then buying. The last rung comes with no notice.
- →The ministry confirms amounts only afterwards: 6.28 trillion yen on 30 April, and 15.4 trillion yen between 30 July and 26 August.
- →It fades because the Fed at 3.75-4.00% and the BoJ at 1.25% still pay you to hold dollars. About 45% of the July drop was back within a week.
- →Size for a 450-pip gap, not your planned stop. On a 10,000 dollar account at 1% risk that is roughly 0.03 lots.
- →Two meetings are close: the Fed on 28 October and the BoJ on 29-30 October. Both can move the rate gap that actually drives the pair.
1. What happened in 2026
Japan has intervened twice this year, and the first one is the one people forget.
On 30 April, with USD/JPY at about 160.23, the Ministry of Finance sold dollars and bought 6,278.7 billion yen in a single day, a record for one day. The pair fell to about 156.66 and the yen gained as much as 3%, its biggest daily rise in more than three years. Two smaller operations followed on 4 and 6 May, 780.2 billion and 4,675.9 billion yen, for a spring total of 11.7349 trillion yen, according to the ministry’s quarterly table.
The second operation was bigger and different in kind. USD/JPY had pushed to roughly 164, a multi-decade low for the yen, and on Friday 31 July the US Treasury joined in. Japan and the US confirmed it on 3 August: the first joint yen purchase by the two governments in decades. The pair dropped from about 164 to 155.20, its lowest since early May. The ministry’s own figure for 30 July to 26 August is 15,399.3 billion yen, the largest monthly total on record. The US amount was never disclosed.
Katayama’s line on 3 August was that Japan “will not hesitate to conduct further coordinated interventions in the future.” Read that sentence closely. It promises future action and comes right after the first action, which is exactly what you say when you expect to be tested.
And it was tested. USD/JPY was 156.92 on the 3rd and 159.09 on 10 August. By 1 September it was back above 160, as CNBC’s report from 3 September puts it. That is the pattern the rest of this post is about.
2. The ladder: from words to buying
Intervention is rationed. Each rung costs Tokyo more credibility than the one below, so officials climb slowly and the market learns to read the grammar.
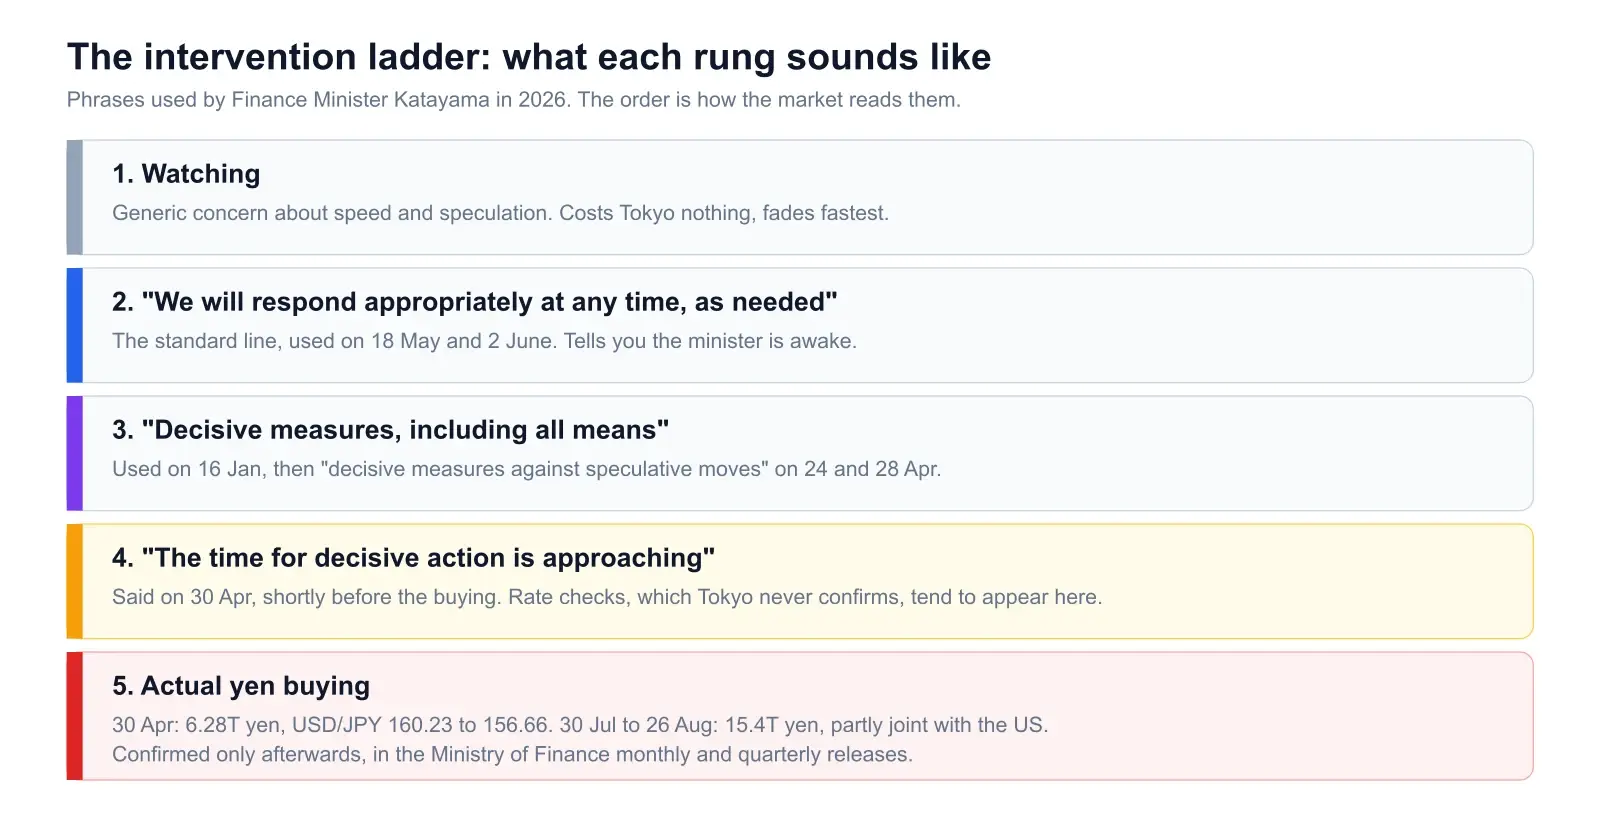
The bottom rungs are close to free. Any official can say a pair is being watched, and traders have heard it so often that it only moves the price for an hour or two. “We will respond appropriately at any time, as needed” is the standard minister line and it appeared on 18 May and 2 June. It tells you the minister is paying attention. It tells you nothing about timing.
The jump that matters is from the word “appropriately” to “decisive.” “Decisive measures, including all means” was used in January, and “decisive measures against speculative moves” came on 24 and 28 April, days before the record buy. Add the extra rung, “the time for decisive action is approaching,” and on 30 April the buying followed within hours.
The rate check
Between the words and the money sits the rate check. Officials ring a few banks for a live USD/JPY quote. They do not trade. The point is to tell dealers, privately, that the authorities are watching the screen. Tokyo never confirms one. The media reports it within minutes through trading-desk sources, and the pair drops 100 to 200 pips on the rumour. A rate check that fails to stop the move is the last warning before the real thing. One that works costs the ministry nothing, which is why it is the favoured tool.
Treat any headline about a rate check as a coin-flip between a one-off drop and the start of a move. Do not buy the first dip.
3. How you find out it happened
Not from the ministry. Not on the day, anyway.
The Ministry of Finance intervention page posts two things. A monthly total, released at the end of each month and covering roughly the 28th of the prior month to the 27th of this one, which is why the July operation appeared as a 30 July to 26 August figure published on 28 August. And a quarterly table with a daily breakdown, released a few weeks after the quarter closes. The April to June table came out on 7 August. The July to September table is due in November.
So in real time you are inferring. The fingerprints are a one-way yen spike of 150 pips or more in minutes, no data release to explain it, thin liquidity, and a flood of “sources say” headlines. The 3 September move shows why that is not conclusive: the yen jumped more than 2% to 155.28 from above 160 in two sessions, and ING and Japan Macro Advisors both doubted it was intervention, pointing to the lack of dislocation in the electronic matching systems and to comments from BoJ Governor Ueda. Vice Finance Minister Mimura said the authorities were “neither satisfied nor reassured” and remained on heightened alert, and Tokyo did not say it had bought.
The practical consequence: the next monthly release lands at the end of October and tells you what happened in September and October, not what is happening. Anyone building a view on that lagging data is working from old information.
4. Why it fades
Intervention changes where USD/JPY trades. It does not change why anyone wants to own dollars against yen.
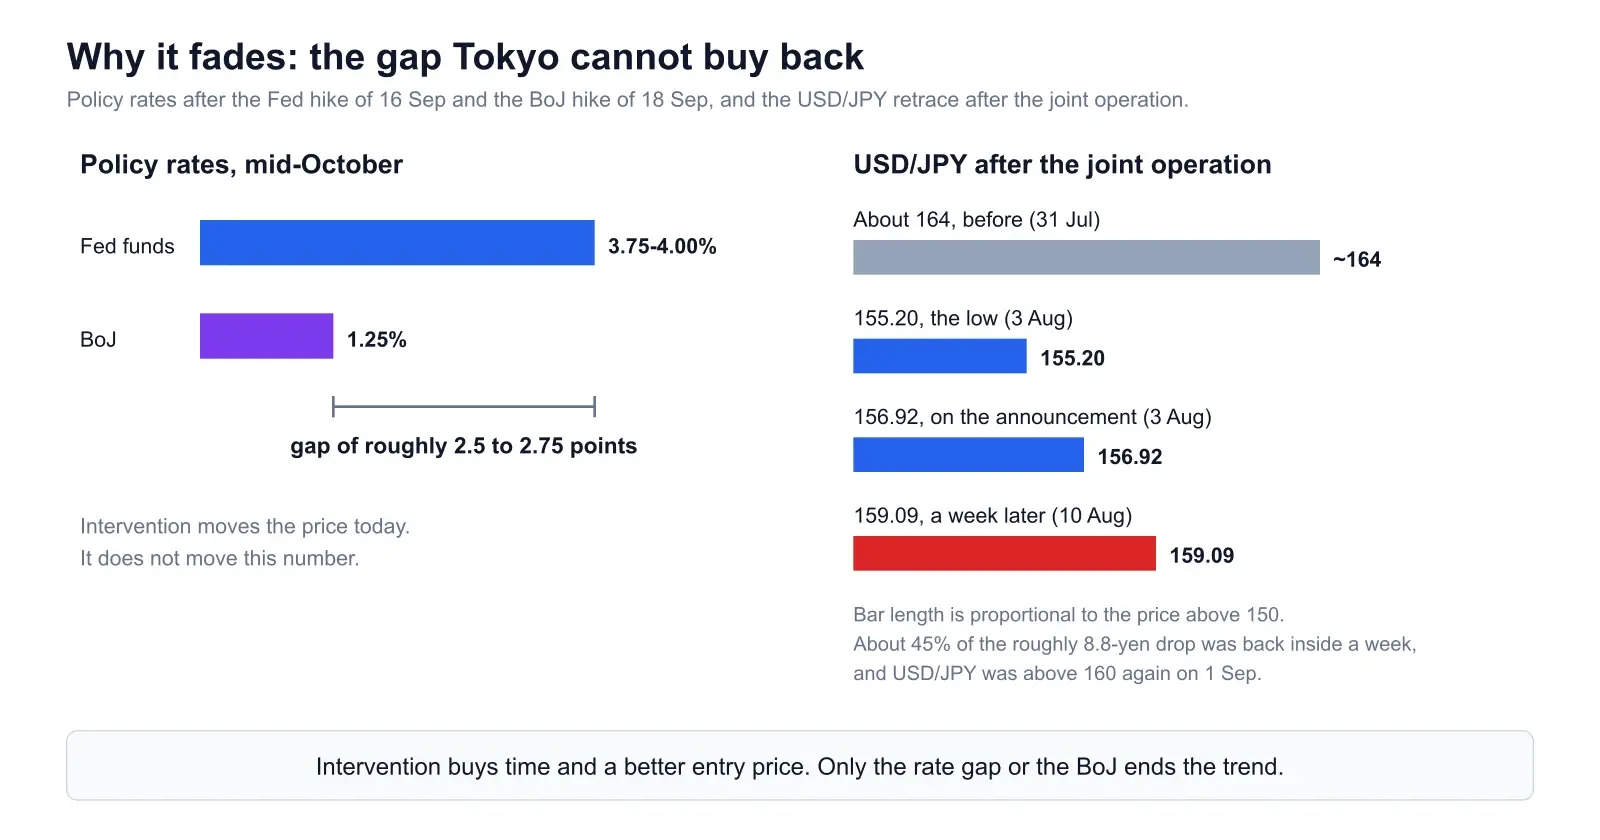
The numbers are blunt. After the joint operation the pair went from about 164 to 155.20, a drop of roughly 8.8 yen. Within a week it was at 159.09, which means 3.9 yen, about 45%, had come back. In the spring operation the pair opened at 160.23 and fell to 156.66, and was back toward 160 within months. A holder of USD/JPY earns carry every night. A seller of dollars-for-yen pays it. Tokyo can move the price once with a large cheque, but while the rate gap stays near 2.5 to 2.75 points, it is only buying a pause.
This is also why the BoJ’s own hikes have not helped much. It raised to 1.25% on 18 September, in a 7-2 vote, and the yen weakened past 157 on the news: the split vote read as hesitation, and Ueda left the next step unclear. We went through that dynamic in the June piece on the yen. The dollar side matters just as much. The Fed’s 16 September hike is covered in our Fed hike breakdown, and the wider picture of why the greenback keeps getting bid is in why the US dollar is strong in 2026.
Analysts at ING make the same point plainly: intervention can cap the pair but struggles to reverse the trend without a change in Japanese policy. The practical reading is that intervention lowers the ceiling for a while and hands carry buyers a cheaper entry. Each time, it is a gift to the next wave of longs.
5. Where the pair stands now
After the dip to 155.28 on 3 September the pair has spent most of the past month in a 156 to 159 range. On 25 September it was falling back toward 158 after a break above the 200-day average. Katayama said Trump had raised concerns about yen weakness in his meeting with Prime Minister Takaichi, and that the principles behind the July operation remained in place. The BoJ hike did not lift the yen. It is back near 158, the zone analysts treat as the warning level, with 160 the line.
Two events inside the next three weeks can change the rate gap. The Fed meets on 28 October, and the Bank of Japan meets on 29 and 30 October. A hawkish Fed or a dovish BoJ takes the pair toward 160 with Katayama’s warnings behind it. A BoJ that signals a faster path, with the next move priced for December, is the one scenario in which the intervention might stick. The FOMC calendar and the Bank of Japan’s English site carry the exact dates. Risk-off shocks cut the other way. The yen is a haven, so when oil spikes and equities fall, USD/JPY can drop with no help from Tokyo, a mechanism we looked at in the oil shock and forex pairs.
6. Managing risk near 158 to 160
Most of the damage in an intervention comes from position size, not direction.
Size for the gap
The 30 April move covered about 357 pips in a short window, from 160.23 to 156.66. The July to August operation covered roughly 880 pips from peak to trough over a few sessions. Size so a 450-pip gap against you is an acceptable loss, not only the 60-pip stop you plan to use. On a 10,000 dollar account risking 1%, that is 100 dollars. One pip on a full lot of USD/JPY near 158 is about 6.3 dollars, so 450 pips on 0.03 lots costs about 85 dollars. That is the number to work from.
A stop is a request, not a guarantee
When the ministry buys, liquidity vanishes on the bid side. A stop at 158.40 becomes a market order and fills wherever the book is, which could be 157.50. We lay out the differences in stop-loss placement methods, but the rule for this pair is simple: put the stop where your trade idea is wrong, not at a round number, and accept that it may fill worse on the day. Round numbers like 158.00 and 159.00 are where everyone else’s stops sit too.
Know the hours
Intervention tends to arrive when liquidity is thin: Japanese holidays, late New York, the hours around a US data release. The 4 and 6 May operations fell in Golden Week, and the July operation was in New York hours on a Friday. A leveraged USD/JPY long held into a weekend or a Tokyo holiday, with the minister in the headlines, is about the riskiest time to carry size. Our session times guide shows where the pair is thinnest.
Remember the crosses
A yen spike hits every yen pair together. If you hold USD/JPY, EUR/JPY and AUD/JPY longs you do not hold three trades, you hold one trade with three times the exposure. The correlation guide explains how to check this before you size anything. Count the whole book, not each line.
Write the plan down in advance
When the candle starts, you will want to improvise. Do it before. Our News Impact analysis flags yen-sensitive events and the risk regime each evening, and the Chart Snipe tool will give you a second read on structure from a screenshot. After the event, put the fill, the slippage and what you did into a trading journal. Nobody models slippage on an intervention day. You only learn your own by recording it.
7. Long or short: both sides of the trade
If you are long
The carry is real and the trend is up, so being long between 156 and 158 is a legitimate position. The skill is in getting out. Take part of the position off before the pair reaches 159.50, since the upside beyond 160 has been worth a few yen at most and the downside has been worth three to nine. Trail the rest, and reduce size before the Fed and BoJ meetings and any weekend where the headlines are loud. If the minister moves from “appropriately” to “decisive,” the rest of the trade is a gift. Take it.
If you are short
Shorting into the zone has an attractive payoff and a bad hit rate. Intervention has come at 160.23, and the pair also traded above 160 on 1 September with no confirmed buying. The risk is being early by several yen. If you take it, stay small, put the stop above the recent highs (above 160.30 or so, not at 160.00 where the market will probe it), and expect to be stopped out more than once. The cleaner version is to wait for the event and sell a rebound after the drop, since the pattern so far is a partial retrace within days. You give up the first few hundred pips for a much better probability.
The honest summary: nobody knows whether the line is 160, 161 or 162, and Tokyo has every reason to keep it that way. What you can control is the size of the loss on the day you are wrong. A trade you can only survive if the ministry is polite is not a trade.
Frequently asked questions
At what level does Japan intervene in USD/JPY?
There is no official level. Tokyo says it responds to the speed and disorder of a move, not to a number. In practice the market treats 160 as the line, because Japan bought yen on 30 April with the pair at 160.23, and treats 158 as the zone where warnings get louder. The speed of a move matters as much as the level.
How do I know Japan has actually intervened?
Not from the ministry on the day. The Ministry of Finance publishes the amount afterwards in a monthly release and a quarterly daily breakdown. In real time you infer it from a violent one-way yen spike in thin liquidity followed by media reports. The 30 July to 26 August total of 15.3993 trillion yen was published on 28 August.
Why does intervention fade so quickly?
Because it changes the price, not the reason for the price. With the Fed at 3.75-4.00% and the BoJ at 1.25%, holding dollars still pays. After the joint operation the pair went from about 164 to 155.20 and was back at 159.09 a week later, retracing about 45%.
Is it safe to short USD/JPY just below 160?
It has a good payoff and a poor hit rate. Intervention can arrive after 160 or not at all, as 1 September showed. Keep size small, put the stop above recent highs instead of at a round number, and expect several stop-outs before the event you are waiting for.
How should I size a position near an intervention zone?
Size so that a 450-pip adverse gap costs no more than you accept losing. On a 10,000 dollar account at 1% risk that is about 0.03 lots. A stop order does not protect you from a gap; it fills wherever liquidity is.
Sources & further reading
- → Ministry of Finance: Foreign Exchange Intervention Operations. The primary source for every amount quoted here.
- → MoF: April to June 2026 daily table. The 30 April, 4 May and 6 May amounts.
- → MoF: 30 July to 26 August 2026 monthly release. The 15,399.3 billion yen total.
- → CNBC: yen jumps to a one-month high on intervention speculation (3 September). The 155.28 low, the 160 breach and the Mimura quote.
- → The Japan Times: record forex intervention total (29 August). Coverage of the monthly release.
- → Federal Reserve: FOMC calendar and statements. The dollar half of the rate gap.
- → Bank of Japan: English site. Policy statements and meeting schedule.
Know the yen risk before the session opens
News Impact scores the calendar, the central-bank flow and the risk regime for the upcoming session, so a USD/JPY position never surprises you on a Fed or BoJ day. Bring your own chart to the Chart Snipe tool for a structure check, and log what happened afterwards.