How to Read a Forex Economic Calendar (Complete 2026 Guide)
The beginner-friendly tutorial that teaches you every column, every impact rating, and the ten events that actually move FX pairs — without the noise.

If you've ever watched EUR/USD rip 80 pips in three minutes and wondered what the hell just happened, the answer is almost always sitting on a forex economic calendar. A scheduled data release just crossed the wires, came in a little hotter or softer than economists expected, and the market repriced the currency in seconds.
The problem is that economic calendars are dense, cryptic, and relentlessly overwhelming for beginners. Forty events a day, half of them in abbreviations you've never seen, numbers flashing red and green, and no one ever explains what any of it actually means for the pair you're trading.
This guide fixes that. By the end of it you'll know exactly how to read every column, which events matter and which you can ignore, how to pre-position before a release, and — if you want to skip the manual reading entirely — how ChartSnipe uses AI to pre-digest the whole calendar into a ranked list of bullish and bearish pairs every single day.
Key Takeaways
- →Every forex economic calendar uses the same six core columns: Time, Currency, Event, Impact, Forecast, and Actual vs Previous.
- →Impact ratings (red, orange, yellow) let you filter out 80% of the noise — focus on red and orange events only.
- →The market move comes from the surprise between Actual and Forecast, not from Actual vs Previous — this is the most common beginner mistake.
- →Ten events drive the vast majority of FX volatility: NFP, CPI, FOMC, ECB, BoE, Core PCE, Retail Sales, GDP, PMIs, and Unemployment.
- →AI tools like ChartSnipe News Impact Analysis pre-digest the full calendar into ranked bullish and bearish FX pairs so you skip 45 minutes of manual research.
What Is an Economic Calendar (and Why Forex Traders Live on It)
An economic calendar is a scheduled feed of upcoming government data releases, central bank decisions, and official speeches that are known to move financial markets. Every major free calendar — Forex Factory, Myfxbook, Investing.com, FXStreet — pulls from the same underlying wire data, so the actual numbers don't differ between them. What differs is layout, filters, and how they present history.
For a forex trader, the calendar isn't an optional extra. It's the single most important pre-market tool you own. Here's why: FX pairs are relative instruments. EUR/USD is literally the price of the euro measured in dollars. Anything that changes how traders value the euro or the dollar moves the pair. And the single biggest driver of currency valuation is interest rate expectations, which are shaped almost entirely by the data you see on the calendar.
The causal chain in one sentence
Hot inflation print → market expects more rate hikes → currency strengthens → pair with that currency on the left moves up, pair with it on the right moves down.
That chain is what you're really trading when you trade news. Every column on the calendar is just feeding you information to help you guess which way that chain will fire. Miss a key release and you're trading blind against people who didn't miss it.
If you've read our guide on high-impact forex news events, you already know which releases matter most. This article is the sibling piece — instead of listing the events, it teaches you how to read the calendar itself.
The 6 Columns You Need to Read
Every economic calendar on the internet uses the same six core columns, even if the order or styling differs. Once you memorize what each one tells you, the entire calendar becomes readable at a glance.
1. Time
The scheduled release time in your configured time zone. Always confirm the calendar is set to your local zone before you do anything else — a 4-hour time zone error is how beginners miss NFP. Releases are usually listed to the minute (e.g. 13:30), and the market reprices in the first 50 milliseconds after the print lands.
2. Currency
The three-letter code for the affected currency: USD, EUR, GBP, JPY, AUD, NZD, CAD, CHF. This is the currency the release is most likely to move. A USD release directly impacts every pair that contains USD (EUR/USD, GBP/USD, USD/JPY, etc.) as well as gold, which prices in dollars.
3. Event
The name of the release — CPI, NFP, Retail Sales, FOMC Rate Decision, ECB Press Conference. Most calendars use abbreviations to save space; click the event to see the full description and a historical chart of previous prints. If you don't recognise an abbreviation, don't guess — read the description.
4. Impact
Usually displayed as a color or bar: red = high, orange = medium, yellow = low. This is the calendar's best estimate of how much the release is likely to move markets based on historical volatility around the same event. We cover this in detail in the next section.
5. Forecast
The consensus expectation from a survey of economists. This number is what matters. The market has already priced in the forecast by the time the release lands, so a perfectly in-line print usually causes nothing. The move comes from the gap between Forecast and Actual.
6. Actual & Previous
Actual is the number that just printed. Previous is the last release's number, giving you context for the trend. For example, a CPI Previous of 3.2% and Actual of 3.5% shows inflation accelerating — even if Forecast was 3.4%, the surprise is positive for the currency because the trend is up.
Beginner mistake: obsessing over Actual vs Previous ("oh good, it's higher than last month") and ignoring Actual vs Forecast. The market already knew the Previous. It's only the surprise relative to Forecast that triggers repricing.
Impact Ratings Explained: Red, Orange, Yellow
Every calendar colour-codes events by expected impact, and this single filter is the most powerful tool you have. Most traders set their calendar to red-only on busy days and red + orange on quieter ones. Here's what each level really means.
Red / High Impact
Tier-1 releases that move 50+ pips in major pairs on a typical surprise: NFP, CPI, FOMC, ECB, BoE, Core PCE. Always worth stopping to read.
Orange / Medium Impact
Tier-2 releases that can move 15-30 pips on a large surprise: Retail Sales, PMI surveys, Unemployment Claims, Durable Goods. Matter more when stacked.
Yellow / Low Impact
Everything else: second-tier surveys, housing sub-indices, minor speeches. Almost always safe to ignore unless you're trading a very illiquid pair.
A note on "high impact" that nobody tells beginners: it's measured by historical volatility, not what's happening right now. During a hiking cycle, CPI is a nuclear event. During a cutting cycle when inflation is already dead, the same CPI release can barely move the pair. Context always beats the colour dot.

Forecast vs Actual vs Previous: The Math That Moves Pips
This is the single concept that separates traders who understand the calendar from traders who don't. The market does not react to the absolute number that prints. It reacts to the surprise — the distance between the actual number and what was already priced in via the consensus forecast.
// The formula, simplified
Surprise = Actual − Forecast
Positive surprise on a "good" release → currency strengthens
Negative surprise on a "good" release → currency weakens
Worked example: US CPI
Say the US CPI calendar row shows: Previous 3.1%, Forecast 3.2%, Actual 3.5%. A beginner might think "inflation only rose 0.4% from last month, no big deal." Wrong. The market had already priced in 3.2%. The surprise is +0.3%, which in CPI land is huge. Traders immediately reprice the Fed's rate path higher, the USD strengthens, EUR/USD drops, USD/JPY rips.
Now flip it: Previous 3.1%, Forecast 3.2%, Actual 2.9%. That's a miss of 0.3%. Inflation is cooling faster than expected, the Fed can cut sooner, USD sells off across the board, and EUR/USD rallies.
Same release, same currency, opposite moves — and the only thing that changed was the surprise direction.
"Good" vs "bad" releases
Every release has a direction that counts as "good" for the currency. Higher is better for CPI, GDP, Retail Sales, NFP, and PMI (for most of the cycle). Lower is better for Unemployment Rate, Unemployment Claims, and Trade Deficit. You need to know which direction "good" means for each release before you can read the surprise.
The Top 10 Events You Must Know
Out of the 40+ events a calendar might list each day, only a handful are consistently capable of creating clean, tradeable moves. Learn these ten and you already understand 90% of what you need to trade news.
| Event | Frequency | Currency | Why It Moves FX |
|---|---|---|---|
| Non-Farm Payrolls (NFP) | Monthly (1st Fri) | USD | Headline US jobs number. Directly shapes Fed policy expectations. |
| CPI (Consumer Price Index) | Monthly | USD, EUR, GBP | Headline inflation gauge. Hot prints mean more hikes, cold prints mean cuts. |
| FOMC Rate Decision | 8x per year | USD | The Fed sets global USD cost. Decision + Powell press conference = maximum volatility. |
| ECB Rate Decision | 8x per year | EUR | Sets eurozone policy. Lagarde press conference often bigger than the decision itself. |
| BoE Rate Decision | 8x per year | GBP | Bank of England decisions and vote splits drive cable volatility for hours. |
| BoJ Rate Decision | 8x per year | JPY | Any shift from ultra-loose policy creates monster JPY moves. Also watch for intervention talk. |
| Core PCE | Monthly | USD | The Fed's preferred inflation gauge. Often more important than CPI for Fed decisions. |
| Retail Sales | Monthly | USD, EUR, GBP, AUD | Consumer strength read. Strong retail = strong economy = hawkish rate bias. |
| GDP | Quarterly | All | Broad growth measure. Recessions start here. Watch advance prints for the biggest moves. |
| PMI Surveys | Monthly | All | Forward-looking business activity. The 50 level separates expansion from contraction. |
The ten releases that account for the majority of daily FX news volatility
We cover the top-tier events in much more depth in our high-impact forex news events guide and dedicate an entire playbook to the biggest one in NFP trading strategy for forex and gold. Consider those required reading once you've finished this guide.
How to Pre-Position Before a Release
Reading a calendar is worthless if you don't translate it into a trading decision. Here's the simple pre-position framework used by most discretionary news traders.
Step 1: Build a bias from the forecast
Before the release, compare Forecast to Previous. If Forecast > Previous, economists already expect improvement — the currency is likely priced for a strong print. A mere in-line number won't move much because that improvement is already baked in. You need an even bigger beat to see follow-through. Know what's priced in.
Step 2: Check DXY and gold context
For every USD release, glance at the DXY (dollar index) and gold before the print. If DXY is already pushing a resistance level and gold is stretched to the downside, a bullish USD surprise can trigger a breakout. If DXY is mid-range and directionless, even a decent beat may fizzle. The market context matters more than the number.
Step 3: Account for session timing
A US release that lands during the London-NY overlap (8:30 AM NY time) gets maximum participation and the cleanest follow-through. The same release landing during Asia session with thin liquidity will spike violently and reverse just as fast. Size down when liquidity is thin.
Step 4: Decide your reaction plan before the release
Write down three scenarios: what you'll do on a big beat, a big miss, and an in-line print. Pre-commit to entries and stops. The moment the number drops is the worst possible time to think — you want to react, not decide.
Warning: never trade through a red release with a tight stop on a pair you can't afford to lose. Spreads blow out to 10x normal in the first 5 seconds, slippage is brutal, and liquidity vanishes. Either size down dramatically or wait 60 seconds for the dust to settle.
The Problem With Raw Calendars
By now you can read an economic calendar. But the honest truth is that reading it properly, every day, for every currency you care about, is a grind. Here's what actually goes wrong for beginners:
- Information overload. Forty events a day, half low-impact, most unrelated to your watchlist. The cost of reading everything is higher than the information you get from it.
- No directional bias. The calendar tells you a release is coming, not whether the pair should go up or down. You're left to interpret every print alone.
- No pair ranking. Which pair has the cleanest setup for a strong USD day? GBP/USD? USD/JPY? The calendar won't tell you.
- No cross-market context. Calendars don't know that oil just spiked, that the BoJ intervened overnight, or that Powell said something hawkish at a dinner speech yesterday.
- No gold, BTC, or index coverage. Calendars only track currencies. If you trade XAU/USD, BTC, or US500, you're reading three different feeds.
- No written reasoning. Even after the release, you're left guessing why the pair moved the way it did. You learn nothing for next time.
This is exactly the problem we built ChartSnipe's AI News Impact Analysis to solve.
How ChartSnipe Solves This: AI News Impact Analysis
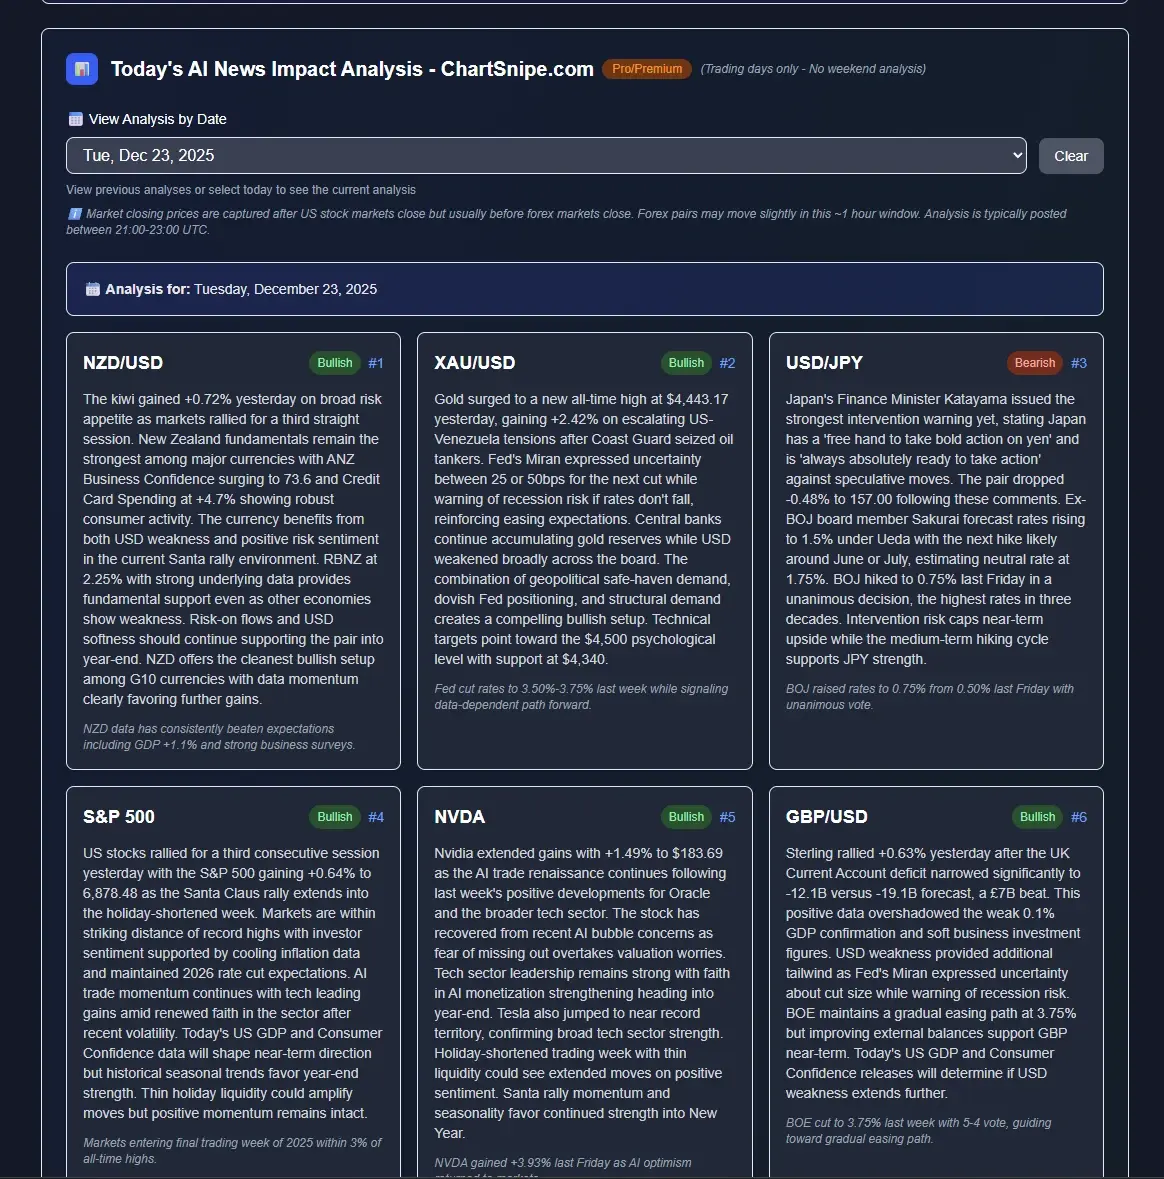
Instead of spending 45 minutes every morning reading the calendar, cross-referencing central bank speeches, and trying to build a bias from scratch, ChartSnipe's daily AI News Impact Analysis does the work for you. Every single trading day, our AI runs a full five-phase research process: it reads the calendar, the overnight news, every major central bank speech, and market price action, then writes a ranked list of the top bullish and bearish instruments with a written reason for every one of them.
What you get every morning
- Top bullish pairs — ranked by conviction, with live prices and the reasoning behind each rank
- Top bearish pairs — same format, so you know what to sell and what to buy
- 12 instrument cards covering the 7 FX majors plus gold, Bitcoin, S&P 500, US Tech 100, and more
- Live price changes updating every 5 minutes so the ranking you see reflects today's tape, not yesterday's
- Written market analysis explaining the catalysts of the day in plain English — no jargon, no guessing
- Reversal risks flagged per instrument so you know where the setup could fail

How ChartSnipe Ranks Economic Events by Severity
A raw economic calendar gives you red, orange and yellow dots and nothing else. The ChartSnipe Risk Analysis panel does the next step for you: it compiles the day's most important events into a short list, stamps each one with a severity badge (HIGH or MEDIUM), and — critically — tags the specific instruments that are likely to move because of it. When you look at the example above, you can see a HIGH-severity Trump-Iran strike headline tagged to AUD/USD, GBP/USD, EUR/USD, S&P 500, US TECH 100, and US OIL in a single row. That is the kind of cross-asset mapping a plain calendar will never give you.
The panel deliberately mixes scheduled calendar events (FOMC meetings, RBNZ rate decisions) with unscheduled newsflow (military strikes, central bank interventions, geopolitical ceasefires). A traditional economic calendar can't show you those second-category items at all, which is why most retail traders get blindsided by them. By ranking everything — scheduled and unscheduled — against the same HIGH / MEDIUM scale, you can see at a glance whether today is driven by a Fed meeting, a Middle East escalation, or both, and which of your watchlist pairs are exposed.
The workflow becomes simple: read the top HIGH row, check which pairs are tagged, and decide whether to trade, reduce size, or sit out entirely. No more scanning forty calendar rows trying to figure out which ones actually matter for the pair you want to trade.

Which Pairs to Trade Around the News
The Risk Analysis panel tells you what is moving the market. The AI Picked Top Pairs panel tells you where to express the view. Once the severity ranking is in place, the AI pushes the twelve best-positioned instruments into two ranked columns: bullish #1 through #6 on the left, bearish #7 through #12 on the right. Each pair has a live percentage move attached, so you can instantly see which side of the DXY chain is actually leading — in the example above XAU/USD is topping the bullish board at roughly +4.3% while US TECH 100 anchors the bearish side.
Beneath the columns sits the "How AI Would Trade Today" commentary — two or three short paragraphs connecting the severity-ranked events from the Risk Analysis panel directly to the ranked pairs. When the commentary references a Trump Iran tariff on a Tuesday afternoon, you can immediately see which pairs the AI believes will absorb that catalyst and in which direction. That is the bridge a normal calendar never provides: from news event, to severity, to specific pair, to written rationale.
For a beginner trying to learn the calendar, this is also an excellent training tool. Read the Risk Analysis panel first, form your own guess about which pairs should be bullish or bearish, then compare it with the AI's ranked list. Over a few weeks you'll internalize which events map to which pairs — and at that point the calendar starts to feel readable rather than overwhelming.
Detailed per-instrument analysis
Click any instrument and ChartSnipe opens a full detailed breakdown: what happened today, what the catalysts are, what the key technical levels are, and what could flip the setup against you. This isn't a signal service — it's a research briefing. The point is for you to understand why something is set up the way it is so you can make your own decision.

You can read a deeper breakdown of how this AI pipeline works in our guide on AI economic calendar analysis, or see how we combine news with chart analysis in AI forex chart analysis 2026.
The shortcut for the rest of us
Learning to read the calendar is important — it builds intuition. But once you understand the mechanics, there's no prize for doing it manually every morning. ChartSnipe News Impact pre-digests the calendar plus all the context around it into a ranked list in under five minutes of your time.
Sample Daily Workflow: 10 Minutes to a Ranked Setup List
Here's the workflow we recommend for new traders who want to use ChartSnipe alongside a traditional calendar. Total time: about ten minutes.
Open Forex Factory or Myfxbook (2 min)
Filter red and orange events only. Scan the day's schedule so you know what's coming and at what time. Write down the two or three releases that affect pairs on your watchlist.
Open ChartSnipe News Impact (3 min)
Head to /newsimpact-2 and read the top bullish and bearish pairs for the day. See which pairs align with your raw calendar reading and which surprise you.
Click into your top 2 instruments (3 min)
Read the per-instrument analysis, key levels, reversal risks, and catalysts. Now you have a directional bias and a risk plan without doing the research yourself.
Screenshot your chart and snipe it (2 min)
Take a screenshot of the chart for your chosen pair and run it through the ChartSnipe tool. You now have both fundamental (news) and technical (chart) confirmation in under ten minutes.
This is the workflow that works. Ten minutes, two sources of confirmation, zero guesswork. Compare that to the alternative of manually reading a 40-row calendar, cross-referencing three news sites, and trying to remember which pair is supposed to be bullish on a hot Retail Sales number.

Why this beats competing tools
Plenty of services will send you news headlines. Very few translate those headlines into a ranked, actionable list of instruments. Even fewer explain why. And none of them — in our experience — combine it with a dedicated chart analysis tool in the same platform. If you want to see how ChartSnipe compares to the alternatives, read Best Chart Analysis Software in 2026 and Does ChatGPT Work for Trading Charts.
Getting access
- Free: 2 chart analyses per month + unlimited Trading Quiz
- Pro ($20/month): 120 analyses + Daily AI News Impact Analysis
- Premium ($50/month): 600 analyses + all features
See the full breakdown on our pricing page.
Frequently Asked Questions
How do you read a forex economic calendar?
A forex economic calendar shows upcoming news events across six columns: Time, Currency, Event, Impact, Forecast, Actual, and Previous. You read it by filtering for high-impact (red) events, checking which currency is affected, noting the forecast and previous values, and then comparing the actual number once it releases. The market reaction comes from the gap between actual and forecast, not from the absolute number itself.
What do the colors on a forex economic calendar mean?
Red means high impact — expect significant volatility in the associated currency (NFP, CPI, FOMC). Orange means medium impact — some volatility, mostly in shorter timeframes (Retail Sales, PMI). Yellow means low impact — usually barely moves the market. Most traders filter out yellow events entirely and focus on red and orange.
What is the difference between forecast, actual, and previous?
Forecast is what economists expect the number to be. Previous is the number from the last release. Actual is the number that just printed. The market reaction is driven by the surprise — the difference between Actual and Forecast. A big beat of forecast is bullish for the currency, a big miss is bearish, and an in-line print usually causes little movement.
Which economic events move forex the most?
The biggest movers are Non-Farm Payrolls (NFP), CPI inflation, FOMC decisions and Powell press conferences, ECB and BoE rate decisions, Core PCE inflation, Retail Sales, GDP, PMI surveys, and Unemployment Rate. Geopolitical events and unscheduled central bank speeches can also create massive moves outside the calendar.
How do I use Forex Factory for beginners?
Start by setting your local time zone in the top-right, filter events to show only red and orange impact, then focus on the currencies in your watchlist. Click on any event to see a description, the historical chart of previous prints, and the forecast. For beginners, the safest approach is to avoid trading during red events and instead wait for the dust to settle before taking positions.
Can AI read the economic calendar for me?
Yes. ChartSnipe runs a daily AI News Impact Analysis that reads the economic calendar, the overnight news, and central bank speeches, then outputs a ranked list of the top bullish and bearish FX pairs for the day, plus gold, Bitcoin, and major indices. It explains why each pair is ranked where it is, so you still learn the reasoning — you just skip the 45 minutes of manual research.
Conclusion
Reading a forex economic calendar is a learnable skill. Six columns, three impact tiers, ten events that matter, and one piece of math that determines every reaction — Actual minus Forecast. Learn those and you'll never be blindsided by a news spike again.
But once you understand the mechanics, the manual reading itself is a grind. That's the gap our AI News Impact Analysis fills. Read the tutorial above, learn what's happening under the hood, and then let the AI do the grind for you while you focus on execution.
Sources & Further Reading
- • Forex Factory Calendar — the most widely used free forex economic calendar
- • Myfxbook Economic Calendar — alternate layout with strong filtering and history charts
- • Federal Reserve — FOMC Calendar — official source for FOMC meeting dates and statements
- • U.S. BLS — NFP Release Schedule — authoritative source for Non-Farm Payrolls releases and revisions
- • Investopedia — Trading the News — foundational article on reacting to economic releases in forex
Related Articles

High-Impact Forex News Events
The full list of releases that actually move FX pairs — with typical pip ranges and expected behaviour.

NFP Trading Strategy Playbook
How to trade Non-Farm Payrolls across forex and gold without getting stopped out by the initial spike.

Currency Strength Meter Guide
Combine the economic calendar with a currency strength meter to confirm directional bias.
Written by the ChartSnipe Team
ChartSnipe is an AI-powered chart screenshot analysis tool and daily AI news impact analysis platform for forex, gold, Bitcoin, S&P 500, and Nasdaq traders. Our team combines deep experience in technical analysis, AI vision models, and live market data across 32+ instruments to deliver actionable trading insights.
Skip the calendar grind. See today's ranked pairs.
ChartSnipe AI News Impact Analysis pre-digests the full economic calendar into a ranked list of bullish and bearish FX pairs every single day.
Open Today's News Impact AnalysisWritten by the ChartSnipe Team — Building the future of AI-powered trading analysis.