
Can AI Actually Do Fundamental Analysis?
Not a yes or a no. FX fundamentals have five separate components, and AI grades very differently on each one. Here is the audit — what it genuinely does better than you, what it structurally cannot do, and where that leaves it in a real trading process.
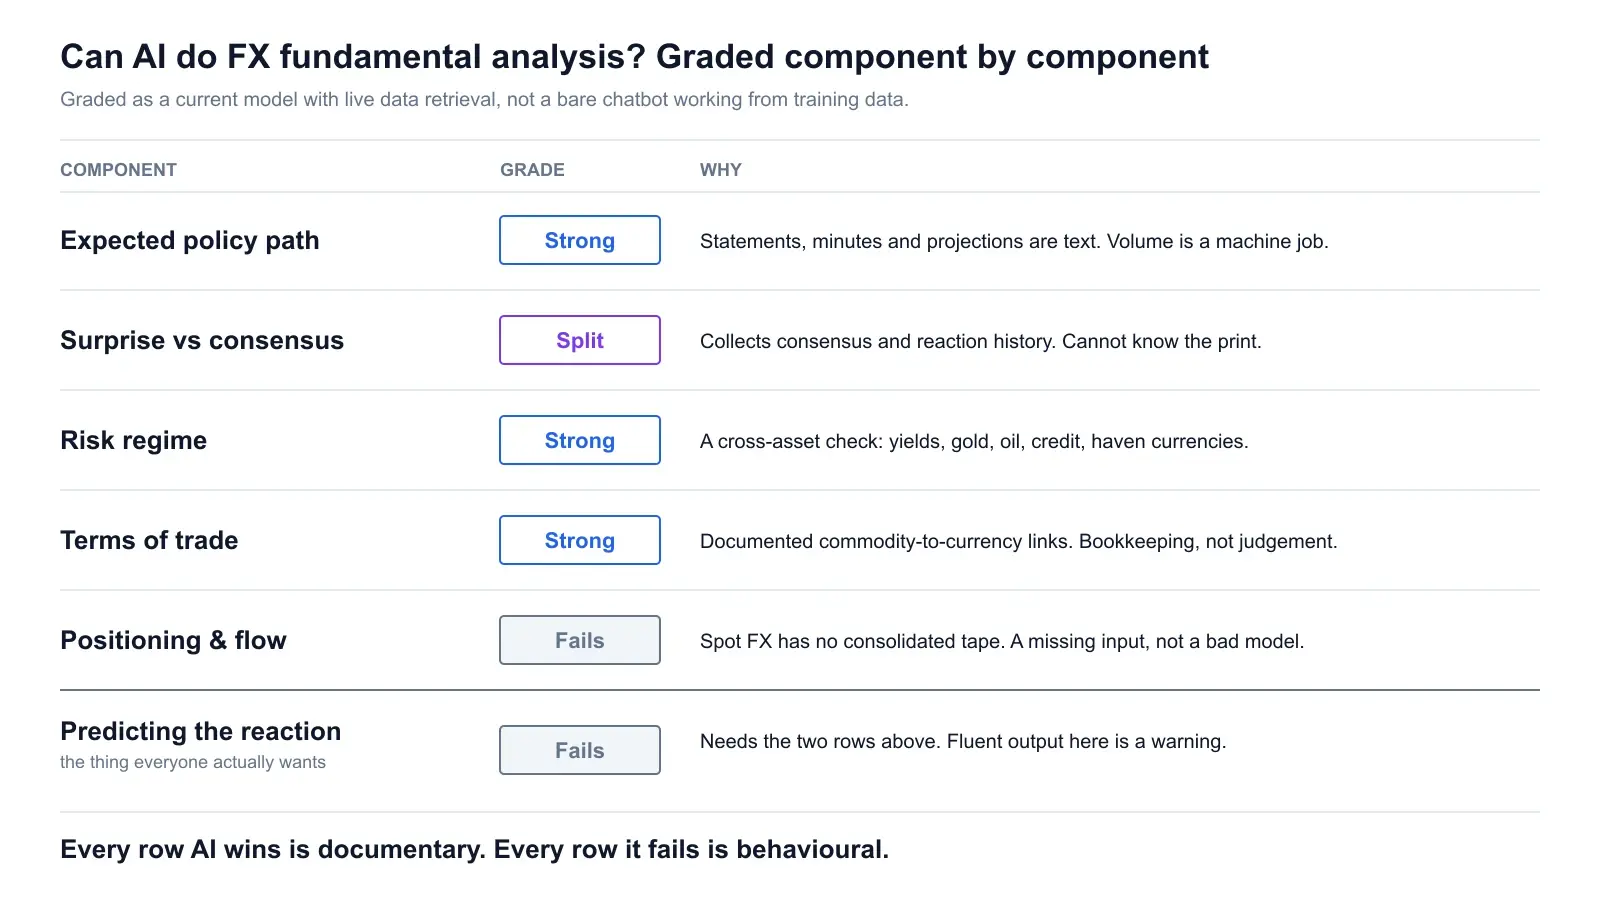
“Can AI do fundamental analysis?” is a badly posed question, and that is why the answers you find are useless. Half of them say yes and show you a chatbot summarising an ECB statement. The other half say no and point at a model that thought the Fed funds rate was still 5.25%. Both are describing something real. Neither is answering anything.
The problem is that “fundamental analysis” is not one skill. In FX it is five distinct jobs stapled together, and they have almost nothing in common. Reading a central bank statement carefully is a reading task. Knowing whether EURUSD is crowded long is not a reading task at all — it is a data-access problem, and no amount of intelligence solves it if the data does not exist publicly.
So this is an audit rather than a verdict. Define the five components first, grade AI on each separately, and the answer falls out on its own. Spoiler, because burying it would be annoying: AI is strong at assembling the fundamental picture and weak at predicting the reaction to it. That is a narrower claim than the marketing makes and a much more useful one, because it tells you exactly where in your process the tool belongs.
Key Takeaways
- →FX fundamentals are five separate inputs: expected policy path, surprise versus consensus, risk regime, terms of trade, and positioning. Grade AI on each, not on the whole.
- →AI wins on synthesis speed, cross-asset consistency, calendar coverage and having no emotional attachment to yesterday’s view.
- →It loses on positioning and flow — the data is not public — and it cannot know a surprise before the print.
- →Language models produce plausible causality on demand. A confident explanation of yesterday’s move is the least trustworthy output in the whole category.
- →Any model is only as current as the data it is fed. Check what policy rate it thinks is in force before you believe anything downstream.
- →Verdict: fundamentals choose the instrument and the direction, the chart chooses the entry and the stop. AI belongs upstream of your chart, not instead of it.
1. What FX fundamental analysis actually requires
Before grading anything, the components. If you cannot name what the job consists of, you cannot say whether a tool does it. FX fundamentals decompose into five inputs, and a currency’s price is a running argument between them.
Component 1 — Real rate differentials and the expected policy path
Money moves toward higher real yield — nominal yield minus expected inflation. But the level of rates is old news the moment it is announced. What moves spot is the change in the expected path: the market has already priced a curve of future policy, and a currency reprices when that curve shifts, not when the current rate is confirmed.
This is why a central bank can hike and the currency can fall. If the market priced two hikes and got one plus a dovish statement, the path shortened and the currency sells off despite a higher rate. Traders who watch the level and not the path spend a lot of time confused. The 2-year yield spread between two economies is the crude version of this and is still one of the better single-number anchors in FX. The FOMC calendar and its projection materials are the primary source for one side of the biggest spread in the market.
Component 2 — Growth and inflation, measured against consensus
A 3.1% inflation print is neither bullish nor bearish. It is bullish if the market expected 2.8% and bearish if it expected 3.4%. Everything in data-driven FX is a surprise measurement, and the number that matters is the residual after consensus has been subtracted.
Which is why the mechanical part of this job is knowing what consensus is, how wide the historical forecast error has been for that specific release, and which currency pairs actually move on it. Our guide to reading the economic calendar covers the forecast/previous/actual mechanics; the high-impact events list covers which releases have historically been worth staying awake for.
Component 3 — The risk regime
The same currency pair behaves differently depending on whether capital is hunting yield or hunting safety. In risk-on, high-beta and commodity currencies bid and funding currencies get sold. In risk-off, the flow reverses hard and carry trades unwind faster than they were built, because unwinding is forced and building was optional.
Regime is not a currency-specific input; it is the multiplier applied to all the others. A hawkish RBNZ in a risk-on tape is a clean NZD long. The same statement during a genuine flight to safety can produce nothing at all. And regimes do get strange: the safe-haven playbook is a tendency, not a law, and there have been episodes where the dollar sold off through a geopolitical escalation because a domestic policy problem outweighed the haven bid.
Component 4 — Terms of trade
For commodity exporters this is close to a first-order input. CAD is levered to crude, NOK to crude and gas, AUD to iron ore and coal, NZD to dairy and soft commodities, ZAR and CLP to metals. When the export price rises relative to the import basket, national income rises and the currency has a structural tailwind that is independent of what the central bank is doing.
The useful subtlety is that terms of trade and rate differentials often point in opposite directions, and which one wins depends on the horizon. Terms of trade dominate over months. Rate expectations dominate over days. A trader looking at a two-day hold is asking a different question from a macro fund looking at a two-quarter hold, and they can both be right about the same currency.
Component 5 — Positioning
The one everybody skips. Positioning is how much of the fundamental view is already in the price and in whose hands. A crowded long reacts to good news with a shrug and to bad news with a stampede, because there is nobody left to buy and everybody left to sell. This asymmetry is why the fundamentally “right” trade so often loses money in the short run.
Hold on to this one. It is where the AI audit gets uncomfortable.
2. The scorecard, component by component
Grades first, reasoning after. “AI” here means a current large language model with live data retrieval — not a bare chatbot working from training data alone, which fails a step earlier for reasons in section 4.
| Component | Grade | Why |
|---|---|---|
| Policy path | Strong | Statements, minutes, speeches and projections are text. Reading all of them for eight central banks is a volume problem, and volume is what machines are for. |
| Surprise vs consensus | Split | Excellent at collecting consensus, sensitivities and reaction history before the release. Zero ability to know the print. The preparation is real; the prediction is not. |
| Risk regime | Strong | Regime is a cross-asset consistency question — yields, gold, oil, equity breadth, credit, the haven complex. Checking twenty markets agree is exactly the tedious work humans skip. |
| Terms of trade | Strong | Stable, well-documented linkages between commodity prices and specific currencies. Little judgement required, plenty of bookkeeping. Machines do bookkeeping. |
| Positioning & flow | Fails | The data does not exist publicly in usable form. This is not a model limitation you can train away — it is a missing input. |
| Predicting the reaction | Fails | Requires the two rows above. Fluent, confident output here should be read as a warning rather than an answer. |
Notice the pattern. Every row AI wins is a documentary task — something written down somewhere that needs to be found, read and reconciled. Every row it fails is a behavioural task — something about what other traders are holding and what they will do next. That is the whole audit in one sentence, and it generalises well beyond FX.
3. Where AI genuinely wins
These are not small advantages, and it is worth being specific rather than gesturing at “speed”.
Synthesis across sources you would not read
An honest daily fundamental prep for the eight majors means: two or three central bank speeches, the previous session’s data across four regions, bond market moves, the commodity complex, any political development with a fiscal angle, and the day ahead’s calendar. Done properly by a human that is two hours before the London open, every day, and almost nobody does it. It is the single most-skipped part of retail trading, not because traders do not know it matters but because it is genuinely a lot of reading with no immediate payoff.
A model does it in minutes and does not get bored on a Wednesday. The output is not better than a good macro strategist’s. It is enormously better than the nothing most people actually do.
Cross-asset consistency checks
This is the one I would defend hardest. Most retail fundamental analysis is single-asset: read a headline, form a view on one pair, trade it. The professional version is a consistency check — if the story is genuine risk-off, then yields, gold, oil, credit spreads and the haven currencies should all be telling the same story, and where they disagree is information.
Bonds not rallying during a supposed flight to safety is a real signal that the market is pricing inflation, not fear. Gold and the dollar rising together says something different from either rising alone. Holding twenty markets in your head simultaneously and noticing the one that does not fit is exactly the kind of pattern check a model is well suited to, and exactly the kind humans skip when they have already formed a view.
It never forgets the calendar
The most expensive retail mistakes are administrative. Entering a swing long ninety minutes before a rate decision. Holding through a CPI print you forgot was scheduled. Sizing normally into a session that has three tier-one releases stacked in a two-hour window. None of these require insight to avoid — they require looking, consistently, at a thing that is published in advance and free.
A system that checks the calendar as a hard step before every setup removes a whole category of loss. That is not clever. It is just reliable, and reliability is what discretionary traders are worst at.
No attachment to yesterday’s view
This one is underrated because it sounds like a personality trait rather than an analytical capability. Once a human has written down a thesis — especially in public, especially after being right once — incoming evidence gets filtered. A model asked fresh each morning has no ego investment in Monday’s call. If Wednesday’s data flips the picture, it flips.
That cuts both ways: it will also flip on noise, because it has no sense of what constitutes a durable change. But narrative stickiness is the more expensive error in practice, and it is the one that turns a small loss into a large one.
4. Where AI fails, and why it is structural
None of these are “the models will get better” problems. Three of the four are permanent.
Failure 1 — It cannot see positioning or flow
Spot FX has no central exchange. It is a decentralised, largely over-the-counter market — the BIS triennial survey measures global turnover in the trillions of dollars per day, spread across bank platforms, ECNs and internalised bank flow. There is no consolidated tape. The volume figure on your retail platform is your broker’s tick count, not the market’s.
The best public proxy is the CFTC Commitments of Traders report. It is released Friday afternoon and reflects positions as of the previous Tuesday — three days stale on arrival, weekly resolution, and it covers listed futures rather than the far larger OTC market. Useful for spotting multi-month extremes in speculative positioning. Useless for knowing whether the market is offside right now.
Why this matters more than it sounds. Positioning is the usual explanation for the most frustrating outcome in fundamental trading: you were right about the data, right about the direction of the surprise, and the pair went the other way. The reason is almost always that the move had already happened in anticipation and the marginal buyer was gone. No AI can tell you that, because nobody outside a handful of dealing desks can.
Failure 2 — It will not know the surprise before it lands
Obvious when stated, routinely ignored in practice. Non-farm payrolls has a wide historical dispersion between consensus and actual, and it gets revised afterwards. CPI beats and misses are not predictable from prior CPI. If a model could forecast the print reliably, so could every bank, and consensus would already contain it — at which point it would stop being a surprise. The category is self-cancelling.
What is legitimate is the preparation around the print: what is priced, which currencies have the highest sensitivity to this specific release, how the pair moved on the last six instances in each direction, and what the scenario tree looks like. That is a real contribution and it is not forecasting.
Failure 3 — It pattern-matches plausible causality
This is the failure mode you should worry about most, because it is invisible. Language models are trained to produce text that reads well. Ask why the dollar fell yesterday and you get a clean, sourced, confident paragraph. You will get one whether the cause was a dovish Fed speaker, a month-end rebalancing flow, a large options expiry at a round number, a single leveraged fund reducing risk, or nothing identifiable at all.
The diagnostic is simple and slightly brutal: ask the same model to explain the opposite move. If it produces an equally fluent, equally sourced explanation — and it will — then neither answer contained information. It was fitting a narrative to an outcome, which is what a next-token predictor does by construction.
Markets genuinely do move for reasons nobody can name at the time. An honest analyst says “flow-driven, no clear catalyst” several times a month. Models say it almost never, because it reads like a non-answer, and the training pressure is toward answers.
Failure 4 — It is only as current as the data it is fed
The fixable one, and by far the most common in the wild. A general-purpose chat model with no live retrieval has a training cutoff and no awareness of where that cutoff sits relative to today. Ask it about ECB policy and it will answer from whenever its data ends, in fluent present tense, with no flag. In a market where the entire game is the change in the expected path, being one meeting behind is not a small error. It inverts the conclusion.
We went through this in more detail in AI forex trading — what works and what doesn’t. The short version: a model with live retrieval and a dated source list is a different product from a chatbot, and the difference is not a matter of degree. Verify against the primary source — the ECB press release archive or the equivalent for whichever bank you care about.
5. The two things a currency actually responds to
Strip the five components down and the price responds to two forces, on two different clocks. Everything else is a way of estimating one of them.
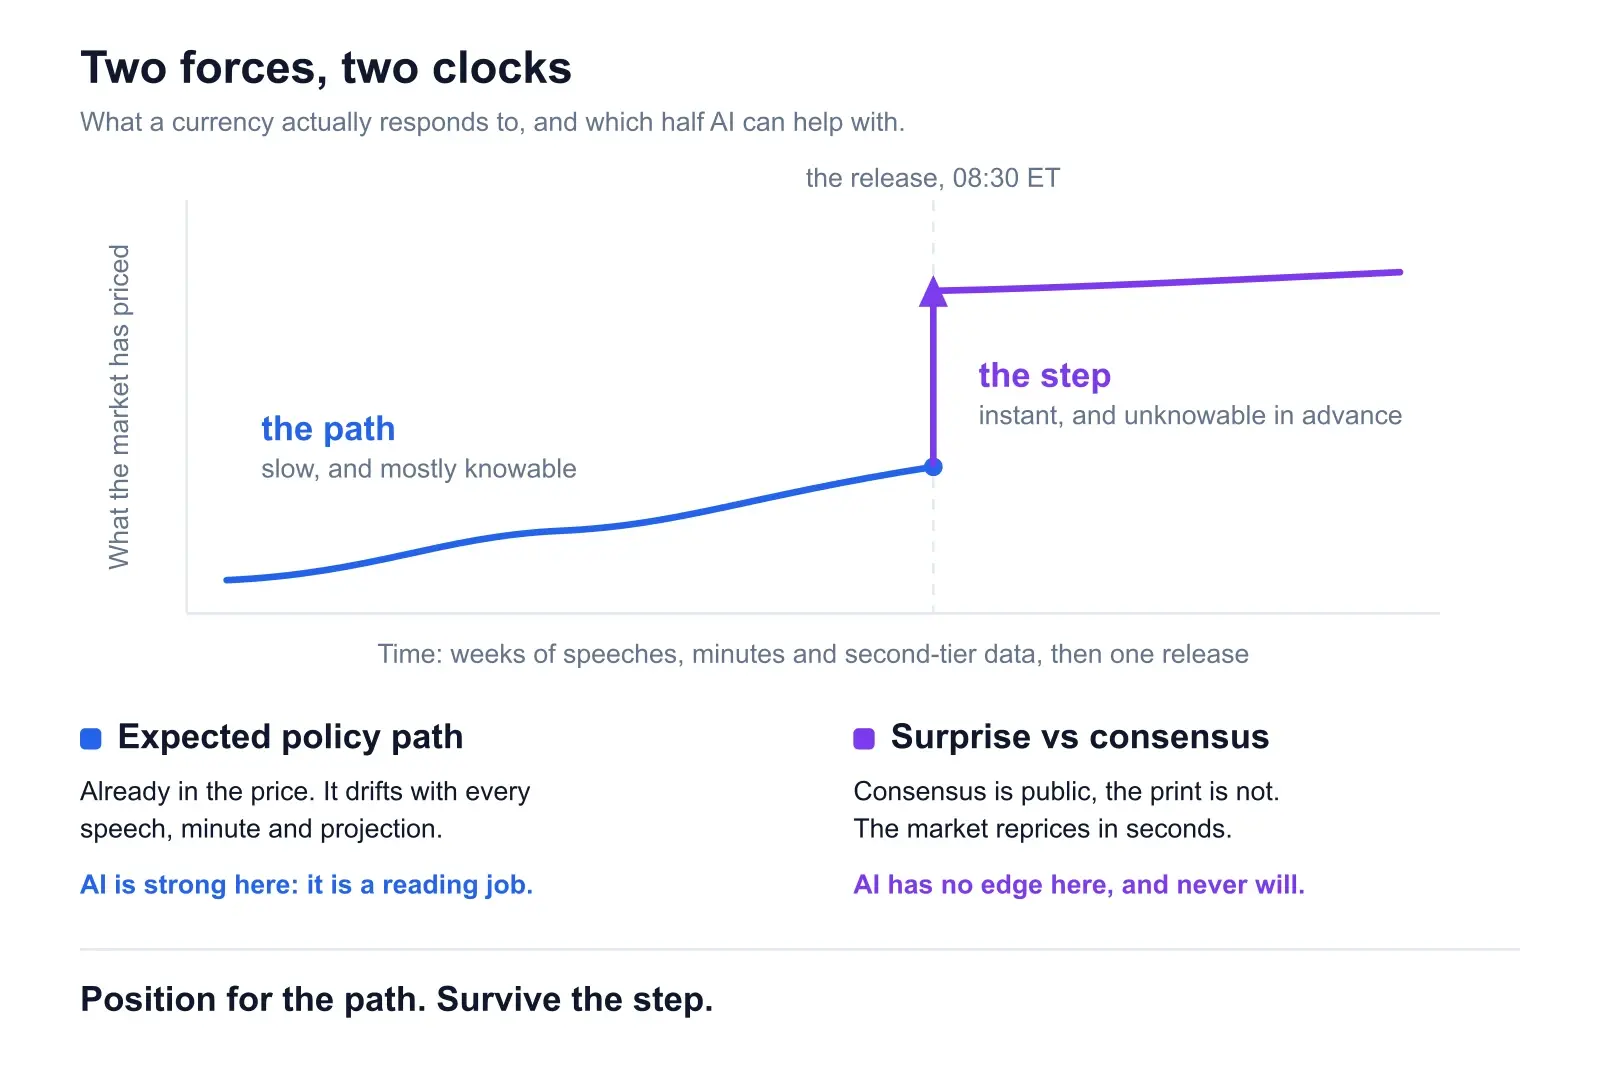
The expected path is slow and mostly knowable. It lives in forward rate pricing, central bank projections, and the accumulated tone of officials. It drifts as speeches and second-tier data accumulate. This is where AI is legitimately good, because tracking a slowly evolving consensus across many documents is a synthesis problem.
The surprise is instant and unknowable in advance. It arrives at 08:30 ET or in a single unscheduled sentence from a governor, and the market reprices in seconds. No model has an edge here, and any that claims one is selling.
The practical consequence: use fundamental work to be positioned correctly relative to the path, and use risk management to survive the step. Traders who invert this — trying to predict the step and managing risk loosely because the path supports them — produce the classic macro blow-up: right thesis, wrong size, stopped out before it paid.
The IMF’s World Economic Outlook press briefing, April 2026. This is what the raw fundamental record looks like before anything compresses it — hours of growth and inflation detail, of which perhaps two sentences change how a currency trades.
6. AI fundamental analysis vs chart analysis
Most of what gets written about AI in trading — including most of what we have written — is about charts: patterns, levels, structure, entries. That is the easier half, and it is worth being explicit about why the two are not substitutes.
| AI on fundamentals | AI on charts | |
|---|---|---|
| Input | Text and macro data from hundreds of sources, quality varying | One image or one price series, complete and unambiguous |
| Question answered | Which currency, which direction, why now | Which level, which entry, where the stop goes |
| Verifiable? | Yes, against primary sources — and you should | Yes, instantly — the level is on your chart or it is not |
| Main failure | Stale data, invented causality, no positioning | Seeing patterns in noise, hindsight-clean levels |
| Timeframe | Days to months | Minutes to days |
| Replaces the other? | No — it has no view on entry or stop | No — it has no view on why price should move |
The two failure modes are almost complementary, which is the argument for running both. A technically perfect short setup on a currency whose central bank turned hawkish overnight is a good-looking trade with the macro against it. A strong fundamental case with no level to enter at is a view, not a trade. Neither is complete alone.
One thing to be accurate about, because it gets conflated: the currency strength meter is not fundamental analysis. The ChartSnipe Strength Index averages each currency’s daily percentage change across the seven major pairs it trades against, inverting the sign where it is the quote currency. That is a clean way to see which currency is actually being bought — and it is derived entirely from price. It measures the market’s answer, not the reasons for it.
7. What “assembled fundamentals” actually looks like
Abstract arguments about AI capability get a lot clearer with an artefact in front of you. This is our own News Impact Analysis, which publishes on trading days only, between 20:00 and 23:00 UTC, for the session ahead. The design choice worth arguing about is that every instrument gets a bias and the written reasoning behind it rather than a score.
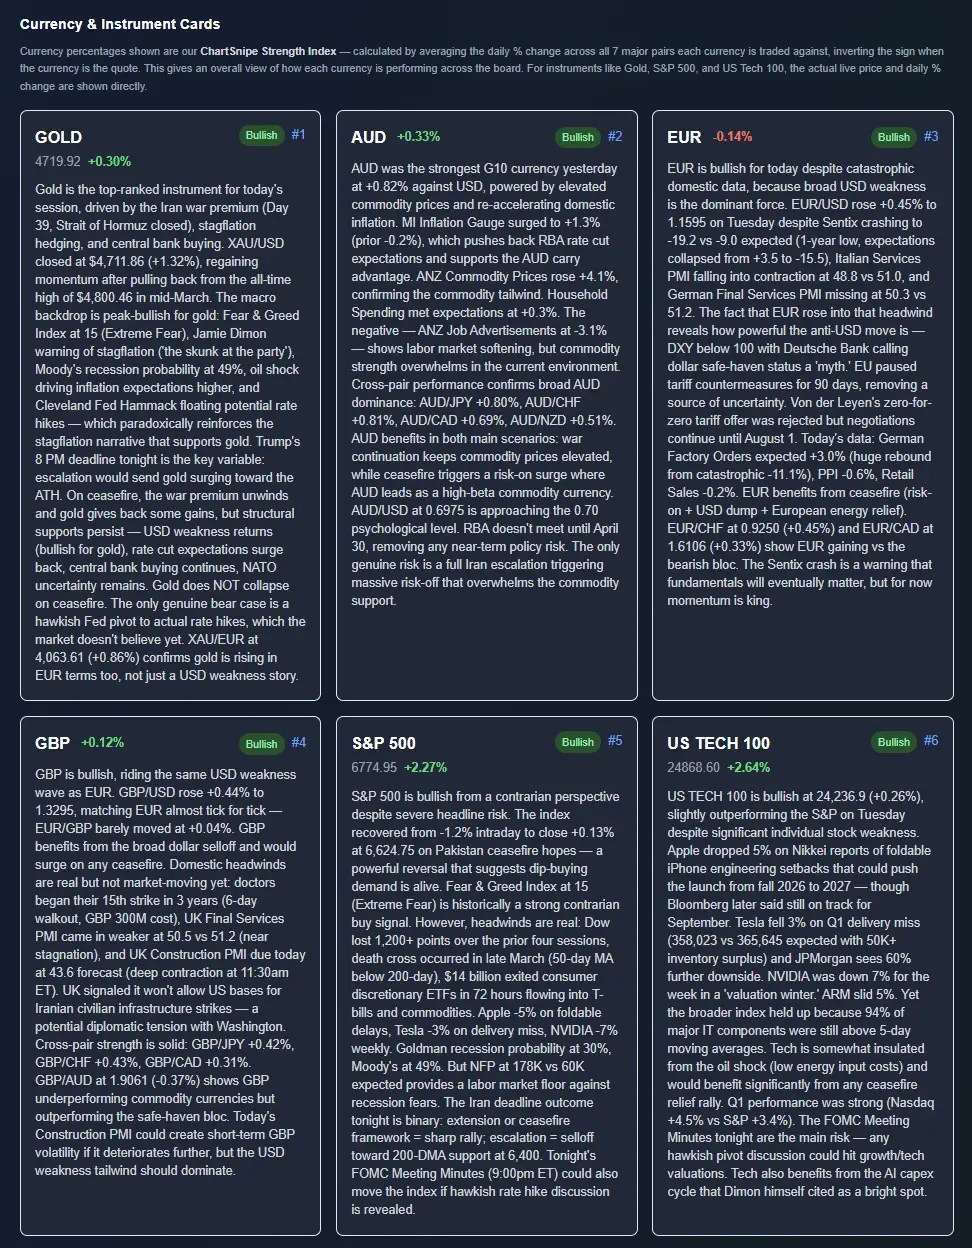
Read the EUR card in that screenshot and you can see the components from section 1 doing their work explicitly. It calls EUR bullish despite bad domestic data — Sentix crashing to −19.2 against −9.0 expected, Italian services PMI falling into contraction at 48.8 against 51.0 — because broad dollar weakness dominates. That is surprise-versus-consensus and risk regime being weighed against each other, and the conclusion is stated with the tension left visible rather than smoothed away.
The reason that matters for this article: a written argument is auditable. If the card says NZD is bullish because 18 of 28 economists now expect the RBNZ to hike to 2.50% by year-end, you can check that claim and disagree with it. A number between 0 and 100 gives you nothing to disagree with. Given everything in section 4, a fundamental tool that hides its reasoning behind a score is asking for a kind of trust it has not earned.
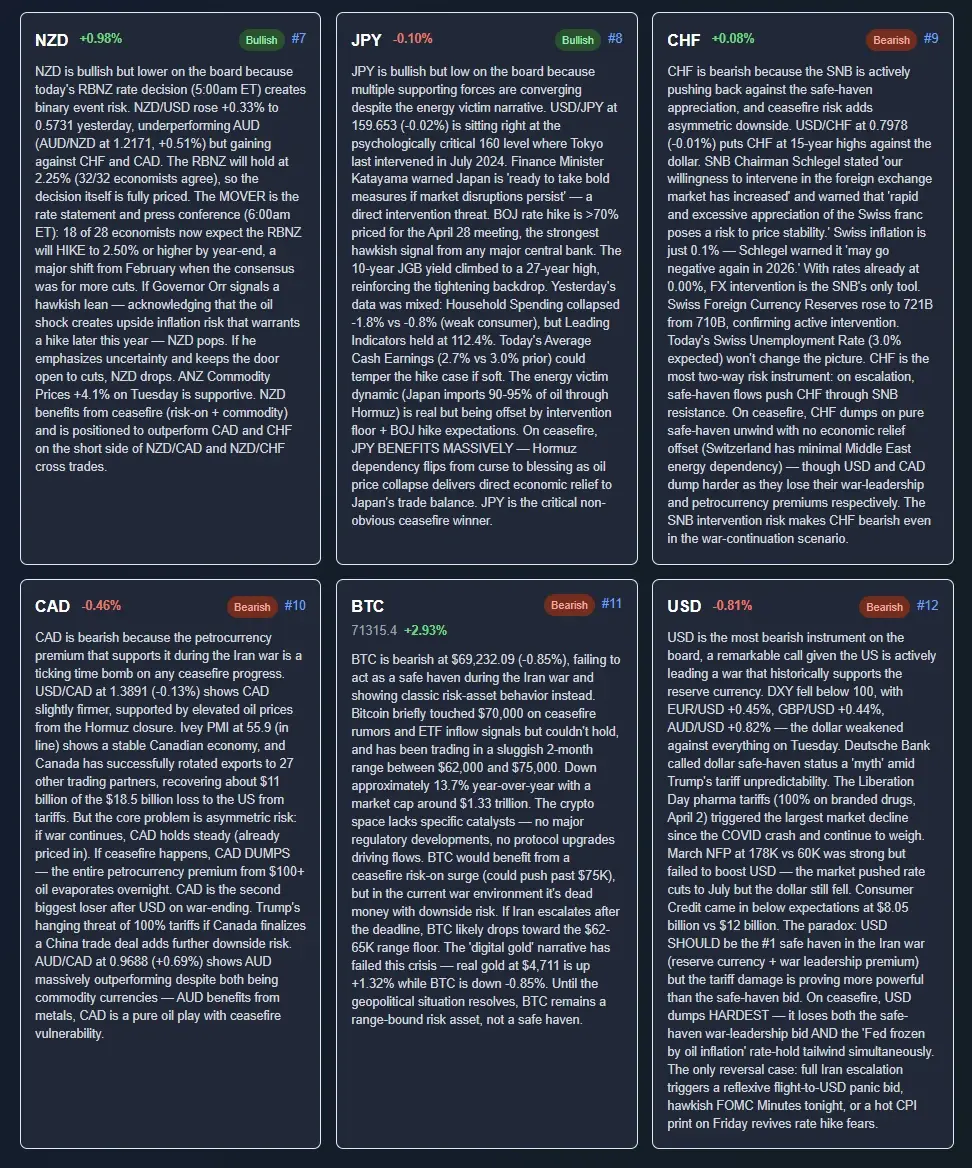
The long-form section is where the tension lives
Cards are per-instrument. The Professional Analysis section underneath is where the session-level argument gets made, and it is deliberately long, because compressing macro into bullets is how you lose the part that mattered.
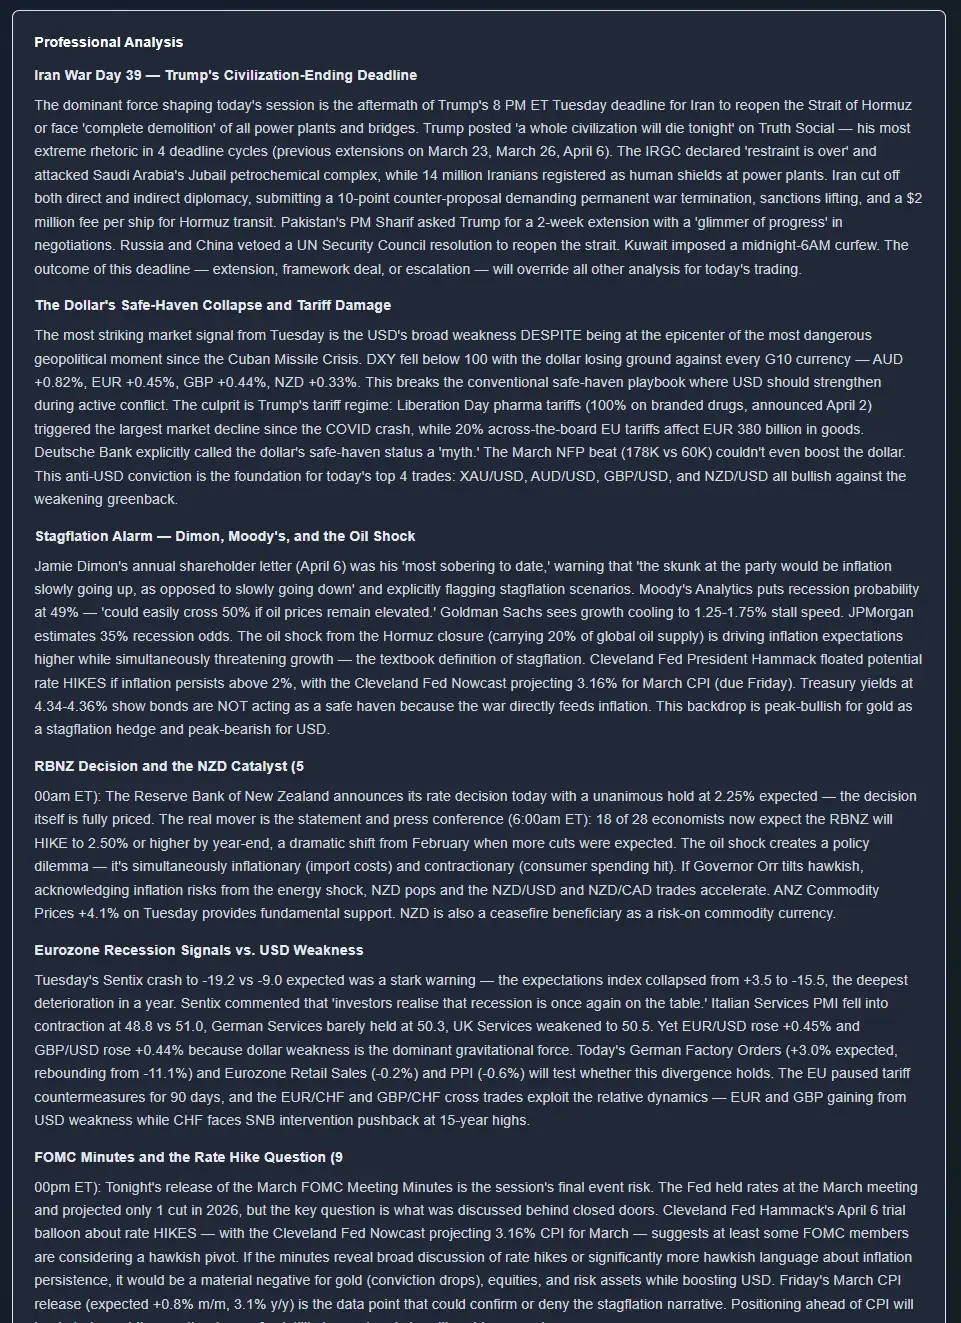
That second heading is the example I would point at for what “good” looks like. The textbook says the dollar bids in a crisis. It was not doing that. A weak analysis restates the textbook; a useful one names the contradiction and offers a mechanism. Whether the mechanism was right is a separate question — but at least it is a claim you can test, which is the whole standard.
The full analysis covers 12 AI-ranked pairs with bullish or bearish calls, a “How AI Would Trade Today” summary, a Risk Analysis block laying out scenarios by severity, trigger, impact and affected pairs, the 12 instrument cards above, the long-form section, plus an economic calendar and live prices across 32 instruments. It is Pro and Premium only — free accounts see an admin-featured past-day preview so you can judge the format before paying, and there is no weekend edition because there is no weekend session.
The published methodology line is deliberately narrow about what it claims: the AI “scans and synthesizes global financial news, official statements, central bank speeches, and economic calendar events to identify the highest-impact factors moving markets.” Scan, synthesize, identify. Not predict. That is the assembling job from the hero image, and it is the job the audit says is actually doable.
8. A working order of operations
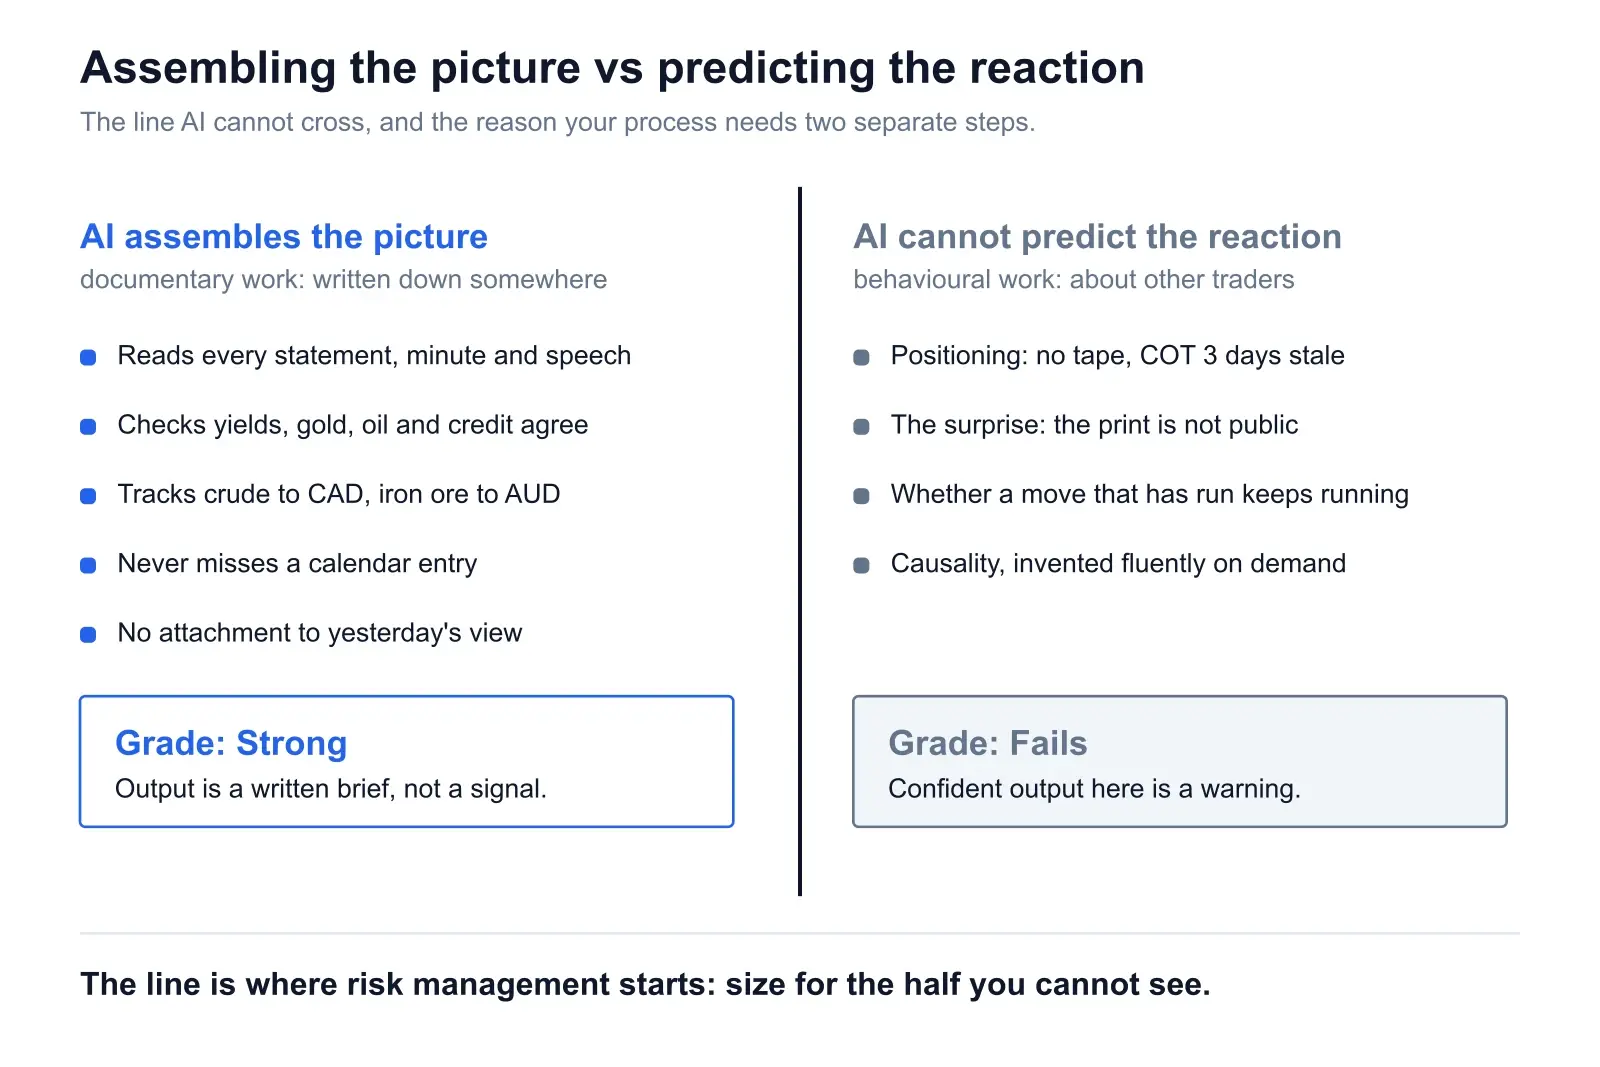
Given the audit, the sequence that follows is fairly forced. Fundamentals upstream, chart downstream, risk sizing to absorb the part nobody can see.
Step 1 — Assemble the picture (AI, minutes)
What changed in the expected policy path overnight? What data printed and how did it land against consensus? What is the risk regime, and do the cross-asset markets agree with it? Any terms-of-trade shift for the commodity currencies? Output is a written brief, not a signal.
Step 2 — Verify the load-bearing claims (you, 3 minutes)
Pick the two or three facts the whole conclusion rests on and check them at the source. A policy rate, a data print, a statement. Current policy rates by country takes ten seconds to confirm and catches failure 4 dead.
Step 3 — Choose the instrument, not the trade
Fundamentals narrow the universe. If the picture is strong CAD and weak JPY, you are looking at CADJPY and at the dollar crosses of both — and you are not looking at EURGBP today. That is the entire contribution, and it is a large one.
Step 4 — Take the entry from the chart
Now, and only now, the technical work: structure, level, invalidation, stop placement. The macro view has no opinion about where to get in, and pretending otherwise produces entries at terrible prices in the right direction. Chart analysis is a separate step with a separate tool.
Step 5 — Size for the invisible input
You do not know the positioning. Assume you are late. Size so that being right about the direction and wrong about the timing is survivable, because that is the most common outcome in fundamental trading by a wide margin.
Step 6 — Re-run the brief tomorrow, from scratch
Do not ask the model to update yesterday’s view; ask it fresh. Updating inherits the previous narrative, which throws away the one behavioural advantage AI has over you.
9. How to stress-test an AI macro read in 60 seconds
Four questions. They catch most of what goes wrong, and they work on any tool including ours.
- “What policy rate do you believe is currently in force for each currency in this pair, and as of what date?” If it cannot answer with a date, it is guessing from training data. Everything downstream is suspect. This single question kills most of failure 4.
- “What would have to be true for this view to be wrong?” A real analysis has a falsifier and can name it in one sentence. If the answer is vague or generic — “unexpected geopolitical events” — there was no analysis, just a summary with a direction attached.
- “How much of this is already priced?” The honest answer is usually “a lot, and I cannot measure how much.” A tool that confidently quantifies how much is priced without referencing forward pricing is inventing it.
- “Now argue the opposite case as strongly.” The comparison is the test. If the bear case is as fluent and as well-sourced as the bull case, the original was narrative generation. If the bear case is visibly thinner, the evidence was doing real work.
Question four is the one worth building a habit around. It costs nothing and it separates a genuine asymmetry from a well-written paragraph faster than any other check I know.
10. The verdict
Can AI do fundamental analysis? It can do the assembling — and the assembling is most of the work by volume and almost none of it by difficulty at the decisive moment.
Reading everything, reconciling it, catching where markets disagree with the story, tracking the calendar, and writing down a coherent picture of what is currently priced: AI does this faster than you, more consistently than you, and without getting attached to it. If you currently do none of this because it is two hours of unglamorous reading — and most retail traders do none of it — then the improvement is not marginal.
Predicting the reaction is a different job and AI does not do it. It cannot see positioning, cannot know the surprise, and will fabricate causality on request with total confidence. Those are not bugs awaiting a better model. Two of the three are missing data, and the third is what the technology fundamentally is.
So: upstream of your chart, not instead of it. Fundamentals answer which instrument and which way. The chart answers where in and where out. AI is now genuinely good at the first question and has no view on the second. A trader who uses it for the first and their own chart work for the second has a complete process. A trader who asks it for a trade has outsourced the one part it cannot do.
That is a smaller claim than the industry makes and it is the one that survives contact with a live account. If you want the broader argument about where AI does and does not add value across the whole trading workflow, we made it here.
Frequently asked questions
Can AI actually do fundamental analysis?
Partly, and the split is clean. AI is strong at assembling the fundamental picture: reading dozens of central bank statements, speeches, releases and cross-asset moves in minutes and writing down what they collectively imply. It is weak at predicting the reaction, because that depends on positioning it cannot see and surprises that have not happened yet. Treat the output as a fast, well-sourced briefing and it earns its place. Treat it as a signal and it will be confidently wrong at the worst moments.
What does forex fundamental analysis actually require?
Real rate differentials and the expected policy path; growth and inflation measured against consensus rather than against zero; the risk regime; terms of trade for commodity currencies; and positioning. A view that skips any of the five is incomplete, and positioning is the one skipped most often.
Is AI good at macro analysis for forex?
It is good at the documentary parts — central bank language, minutes, calendars, historical analogues, cross-asset consistency, terms-of-trade linkages. It is bad at the behavioural parts — how stretched positioning is, who is forced to cover, and whether a market that has already run will keep running. Macro is roughly two thirds documentary and one third behavioural, and AI handles the first two thirds.
Why does AI explain market moves backwards?
Because a language model produces plausible text, and after a move the most plausible text is a causal story. Ask why EURUSD fell and you always get an answer, with the same confidence whether the cause was a central bank comment, an options expiry, month-end flow or nothing identifiable. The tell: the same model would explain the opposite move just as fluently. Post-hoc explanation is the least reliable thing AI does in trading and unfortunately the thing it does most eagerly.
AI fundamental analysis versus chart analysis — which is better?
They answer different questions. Fundamentals tell you which currency should be under pressure and why, with no opinion on entry or stop. Charts tell you levels, structure and risk placement, with no opinion on whether a central bank is about to shift. Fundamentals first to choose the instrument and direction, chart second to time the entry. The reverse order produces technically clean trades that fight the macro.
Can AI see forex positioning and order flow?
No. Spot FX is decentralised, so there is no consolidated tape and no public volume. The closest proxy is the CFTC Commitments of Traders report, published Friday afternoon for positions as of the previous Tuesday — three days stale on arrival, weekly resolution, futures only. Bank flow is proprietary. Every retail trader and every AI is working without the input that most often explains why a currency ignored its own fundamentals.
Will AI know a data surprise before it lands?
No. A surprise is the gap between consensus and the print; consensus is public and the print is not. What AI can do is tell you which releases have the widest historical forecast error, which currencies are most sensitive to each, what is already priced, and what the reaction function looked like in both directions. That is preparation, not prediction, and any tool claiming to forecast the number is selling something.
How current is an AI model when it analyses fundamentals?
Only as current as the data it is fed. A general chat model with no live retrieval will discuss a policy rate that changed four months ago in fluent present tense, because its training data ends somewhere and it cannot know that. Before trusting any macro output, ask what policy rate it believes is in force and check it against the central bank. If the rate is wrong, everything downstream is wrong.
Sources & further reading
Primary sources beat summaries, including ours. These are the ones worth having bookmarked if you do any fundamental work at all.
- Federal Reserve — FOMC calendar, statements and projectionsMeeting dates, statements, minutes and the dot plot. The expected-path input for the dollar, straight from the source.
- European Central Bank — press releasesRate decisions and monetary policy statements as published, so you can check any summary against the actual language.
- Bank for International Settlements — triennial FX surveyThe structural picture of the FX market: turnover, instrument mix and where the volume actually sits. Useful context for why positioning is invisible.
- IMF — World Economic OutlookGrowth and inflation projections by country, twice a year. The medium-horizon backdrop against which individual data prints get judged.
- Trading Economics — current policy rates by countryThe fastest way to confirm what rate is actually in force. Ten seconds, and it catches the most common AI macro failure.
See the fundamental picture assembled, with the reasoning shown
News Impact publishes on trading days between 20:00 and 23:00 UTC for the session ahead: 12 ranked pairs, risk scenarios, 12 instrument cards with written reasoning rather than a score, and a long-form Professional Analysis section. Full analysis is Pro and Premium; free accounts see a featured past-day preview so you can judge the format first.
Keep reading
- → AI forex trading — what works and what doesn’t
- → AI trading in 2026 — does it actually work?
- → How to read an economic calendar properly
- → The high-impact forex news events that actually move price
- → Currency strength meters — the complete guide
- → Trading the news — NFP, CPI and FOMC
- → Why the US dollar is strong — a DXY breakdown