Currency Strength Meter: The 2026 Guide for Forex Traders
How currency strength meters actually work, the single most powerful strategy to use them, and why live AI-driven strength indices are replacing the legacy BabyPips-era tools.

Every profitable forex trader eventually learns the same lesson: you are not trading a currency, you are trading a pair. And a pair is just two forces pushing in opposite directions. A currency strength meter is the tool that tells you which of those forces is actually winning across the market — not just in one chart.
If you have spent any time on the BabyPips forum you have seen the endless threads about strength meters. Traders swear by them, argue about them, rebuild them in MT4, and post screenshots demanding to know which one is best. The reason it keeps coming up is simple: when you pair the strongest currency with the weakest currency, you stop fighting the market.
This guide covers everything you need. The math behind the number, the 8 majors, how to read a meter, the strong-versus-weak rule, the mistakes that kill most traders who try to use them, and how ChartSnipe's live Currency Strength Index combines real-time price data with AI news impact analysis to give you context — not just numbers.
Key Takeaways
- →A currency strength meter turns 28 pair charts into 8 simple numbers — one per major currency — by averaging a currency's percentage change across the 7 pairs it trades in.
- →The 8 majors covered are USD, EUR, GBP, JPY, CHF, CAD, AUD, and NZD — together they account for the vast majority of global FX turnover.
- →The core strategy is the strong-versus-weak pairing rule: buy the strongest currency against the weakest currency so two directional forces work in your favour.
- →Strength meters are lagging by design — use them to confirm bias and rank pairs, never as a standalone entry signal, and always combine them with news context and chart confirmation.
- →ChartSnipe's live Currency Strength Index combines real-time price data across 28 pairs with daily AI News Impact analysis so you see both what is moving and why, in one workflow.
1. What Is a Currency Strength Meter (and Why It Matters)
A currency strength meter is a tool that measures the relative strength of individual currencies by aggregating their behaviour across multiple pairs. Instead of looking at EUR/USD in isolation, it asks a much more useful question: is EUR strong across the board, or is USD just weak?
That distinction is the whole game. If EUR/USD is rising because EUR is strong everywhere, EUR/JPY and EUR/GBP are probably ripping too. If EUR/USD is rising only because USD is getting hammered, then AUD/USD, GBP/USD and NZD/USD are likely moving in sync — and the real trade might be the cleanest of those, not EUR/USD.
The core idea in one sentence
A currency strength meter turns 28 pair charts into 8 simple numbers — and those 8 numbers tell you where the real directional flow is.
Every serious institutional trader reads flow this way. Hedge funds do not stare at one chart at a time — they look at relative strength across the board and pick the cleanest expression of a theme. A currency strength meter gives retail traders the same lens.

2. The Math: How Currency Strength Is Actually Calculated
There are several formulas out there, but the most widely used — and the one that powers ChartSnipe's Currency Strength Index — is the average percentage change method. The logic is clean: a currency trades against 7 other majors, so average its percentage change across those 7 pairs and you have a single number that represents its directional behaviour.
Here is the formula for USD strength, spelled out in plain terms. Every pair is measured against the session open (or the daily open, depending on the timeframe you pick):
Pay attention to the signs. When USD is the quote currency (EURUSD, GBPUSD, AUDUSD, NZDUSD), a rising pair means USD is getting weaker, so the sign is inverted. When USD is the base currency (USDJPY, USDCHF, USDCAD), a rising pair means USD is getting stronger, so the sign stays positive. Get that wrong and your meter will be upside down.
Worked example: If EURUSD is +0.40%, GBPUSD is +0.25%, AUDUSD is +0.30%, NZDUSD is +0.20%, USDJPY is −0.15%, USDCHF is −0.10%, and USDCAD is +0.05%, then USD strength = avg(−0.40, −0.25, −0.30, −0.20, −0.15, −0.10, +0.05) = −0.19%. USD is broadly weak today.
You do the same calculation for EUR, GBP, JPY, CHF, CAD, AUD, and NZD. Rank the 8 numbers from most positive to most negative and you have your strength meter. That is it. No neural network, no proprietary black box — just clean, auditable math.
This is exactly how ChartSnipe's engine calculates strength in src/lib/currencyStrength.ts, updated every 5 minutes from live IC Markets data. No lag, no stale quotes, no manual refresh.

3. The 8 Major Currencies You Need to Watch
Every real strength meter covers the same 8 currencies. These are the ones with deep liquidity, freely floating exchange rates, and heavy institutional flow. Exotics like TRY, ZAR, and MXN can be interesting on news days but they are not core meter currencies.
Driven by the Fed, NFP, CPI, 10-year yields and the DXY. Also the primary safe haven in risk-off episodes.
Driven by ECB, German bund yields, eurozone HICP, and political risk. Largest pair weight in EUR/USD.
BoE, UK CPI, gilt yields. High beta, prone to big intraday moves during London session.
BoJ policy, yield differentials, carry trade flows. Traditional risk-off currency — but not always.
SNB, safe haven flows, European stress. Tends to correlate inversely with EUR/USD.
BoC, crude oil (WTI), and US data given trade linkage. Petro-currency dynamics matter.
RBA, iron ore, China data. Classic risk-on commodity currency. High beta in risk episodes.
RBNZ, dairy prices, China sentiment. Correlates tightly with AUD but smaller liquidity.
The 28 possible combinations of these 8 currencies are the core forex majors and crosses. ChartSnipe's analysis tool covers all 28 plus gold, Bitcoin, S&P 500 and US Tech 100.
4. How to Read a Currency Strength Meter
The colour coding is universal across every decent meter: green means the currency has strengthened since the reference point, red means it has weakened. The deeper the shade, the bigger the move. Easy so far.
The harder question is what counts as a meaningful move. Most experienced meter traders use rough intraday thresholds like these:
| Strength % | Interpretation | Action |
|---|---|---|
| > +0.30% | Clear strength, broad buying | Candidate for long side |
| +0.10 to +0.30% | Mildly bid | Wait for confirmation |
| −0.10 to +0.10% | Flat / indecisive | Avoid — no edge |
| −0.10 to −0.30% | Mildly offered | Wait for confirmation |
| < −0.30% | Clear weakness, broad selling | Candidate for short side |
These thresholds are guidelines, not laws — NFP day is not the same as a quiet Monday. But the principle is: you want extremes, not middles. Trading the middle is where retail traders bleed.
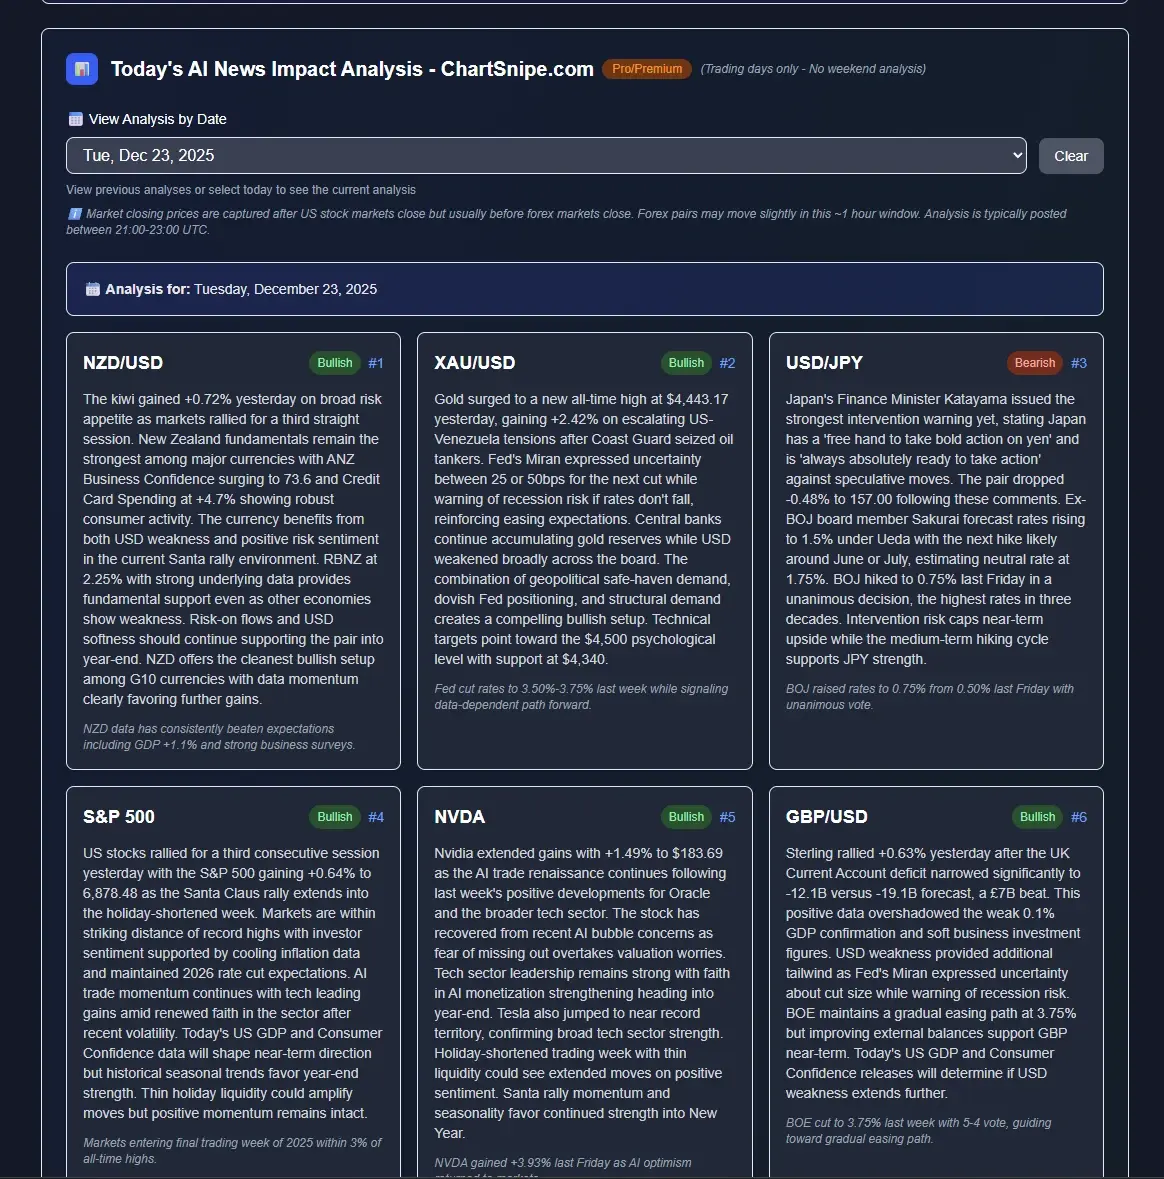
How ChartSnipe shows live currency strength
In practice, ChartSnipe does not hand you a raw colour bar. It breaks the 8 majors into per-currency cards, each one labelled with a strength state — “weakening”, “firming”, “falling”, “steady” — plus a one-sentence driver pulled from the day's news flow. That turns the meter from a number into a narrative. You do not just see that GBP is red; you see why it is red.

The other four majors live on a twin row underneath. The state labels on the USD, CAD, NZD, and CHF cards are where the strong-versus-weak rule actually starts to write itself. If USD reads “firming” while JPY reads “falling”, you already know your cleanest trade on the board is long USD/JPY before you have opened a single chart. If CHF is “falling” on the same day that AUD is “firming”, the pair that best expresses the theme is AUD/CHF — even though most retail traders would never look at that cross.

How to actually read the cards: glance at the state label first (it is the summary), then the one-line driver underneath (that is the why), and only then dig into the percentage. The order matters. Traders who start with the percentage get anchored to a number that might be 0.05% away from a completely different verdict; traders who start with the state label end up with a qualitative read that holds even if the tick ticks over.
5. The Strong-vs-Weak Pairing Rule — The Most Powerful Strategy
Here is the strategy. The whole reason currency strength meters exist. The strong-vs-weak pairing rule is disarmingly simple: every day, pair the strongest currency with the weakest currency and trade that pair in the direction of the stronger one.
The rule in one line
Buy the strongest against the weakest. That is the whole strategy.

Why does this work? Because you are aligning two directional forces in your favour instead of fighting them. When you buy EUR/USD because EUR is strong and USD is weak, you have two separate tailwinds pushing the pair. When you buy EUR/USD because EUR is strong but USD is also strong, you have a tug-of-war and the pair grinds sideways.
Concrete example. Suppose today's strength ranking looks like this:
The cleanest trade is long AUD/JPY. AUD is the strongest, JPY is the weakest, so the pair has both forces working in the same direction. Not EUR/USD, not GBP/USD — AUD/JPY. This is what a strength meter is actually for: it tells you which pair to trade, not just where the market is going.
For a detailed real-world walkthrough using this strategy around high-impact data releases, see our NFP Trading Strategy guide — the strong-vs-weak rule is exactly how we rank instrument reactions during the NFP window.
6. 4 Mistakes Most Traders Make With Strength Meters
Strength meters are powerful but they are not magic. Here are the four biggest mistakes that destroy edge — every one of them is common on the BabyPips forum.
Mistake #1 — Treating It Like a Leading Indicator
A strength meter reflects price that has already moved. It tells you what is happening, not what will happen. Using it as a standalone buy-or-sell signal is a guaranteed way to buy tops and sell bottoms. Use it to rank pairs and confirm direction, never as the sole trigger.
Mistake #2 — Ignoring the News Context
If USD is the strongest currency on the board because the Fed just shocked the market hawkish, that strength is real and has room to run. If USD is the strongest simply because Asian session flows ticked it up by 0.12%, that is noise. Always know why a currency is strong. See our economic calendar guide for how to check.
Mistake #3 — Ignoring the DXY
The Dollar Index (DXY) is the single most important forex chart on the planet. If DXY is breaking a multi-month level, every USD pair on your meter is about to get dragged in that direction. Never trade a USD pair without glancing at DXY first.
Mistake #4 — Single-Timeframe Tunnel Vision
The meter on the 15-minute chart might scream “long GBP” while the daily meter shows GBP has been the weakest currency of the week. Which one is right? Both — but the higher timeframe wins. Always check at least two timeframes and only take trades where both agree.

7. Best Timeframes for Currency Strength
Different trading styles need different strength windows. Here is what works:
| Style | Window | Why |
|---|---|---|
| Scalping | Since session open (5m–1h) | Captures intraday flow bursts |
| Day trading | Since daily open (24h) | Most common meter window |
| Swing trading | Weekly open or 5-day % | Filters noise, captures theme |
| Position trading | Monthly % change | Aligns with central bank cycles |
ChartSnipe uses the session-open window by default, refreshed every 5 minutes from live IC Markets data. Session boundaries are handled server-side so your meter never resets mid-session or shows stale quotes after a Netlify cold start — a detail most cheap meters get wrong.
8. Combining Strength With News Impact — ChartSnipe's Edge
Every other meter on the market shows you the what. Only ChartSnipe shows you the why. The News Impact dashboard pairs the live Currency Strength Index with a full AI-generated analysis of every fundamental driver moving markets that day: central bank speeches, data releases, geopolitical events, Trump statements, cross-market correlations.
That context changes how you use the meter. Instead of seeing “USD +0.42%” and guessing, you see “USD +0.42% — driven by stronger-than-expected CPI and hawkish Powell remarks, with conviction score 8/10 and reversal risk low.” That is the difference between trading blind and trading with context.
Why context changes everything
A strength meter tells you USD is strong. News impact tells you why, how sustainable it is, what could reverse it, and which pair expresses it best. The meter alone is a compass. The meter plus news impact is a map.
For more on how the AI analysis layer works, see our AI Economic Calendar Analysis guide and AI Forex Chart Analysis guide.

9. Walkthrough: Using ChartSnipe's Live Currency Strength Index Daily
Here is the exact daily routine that turns a strength meter from a toy into a trading tool. It takes about 4 minutes.
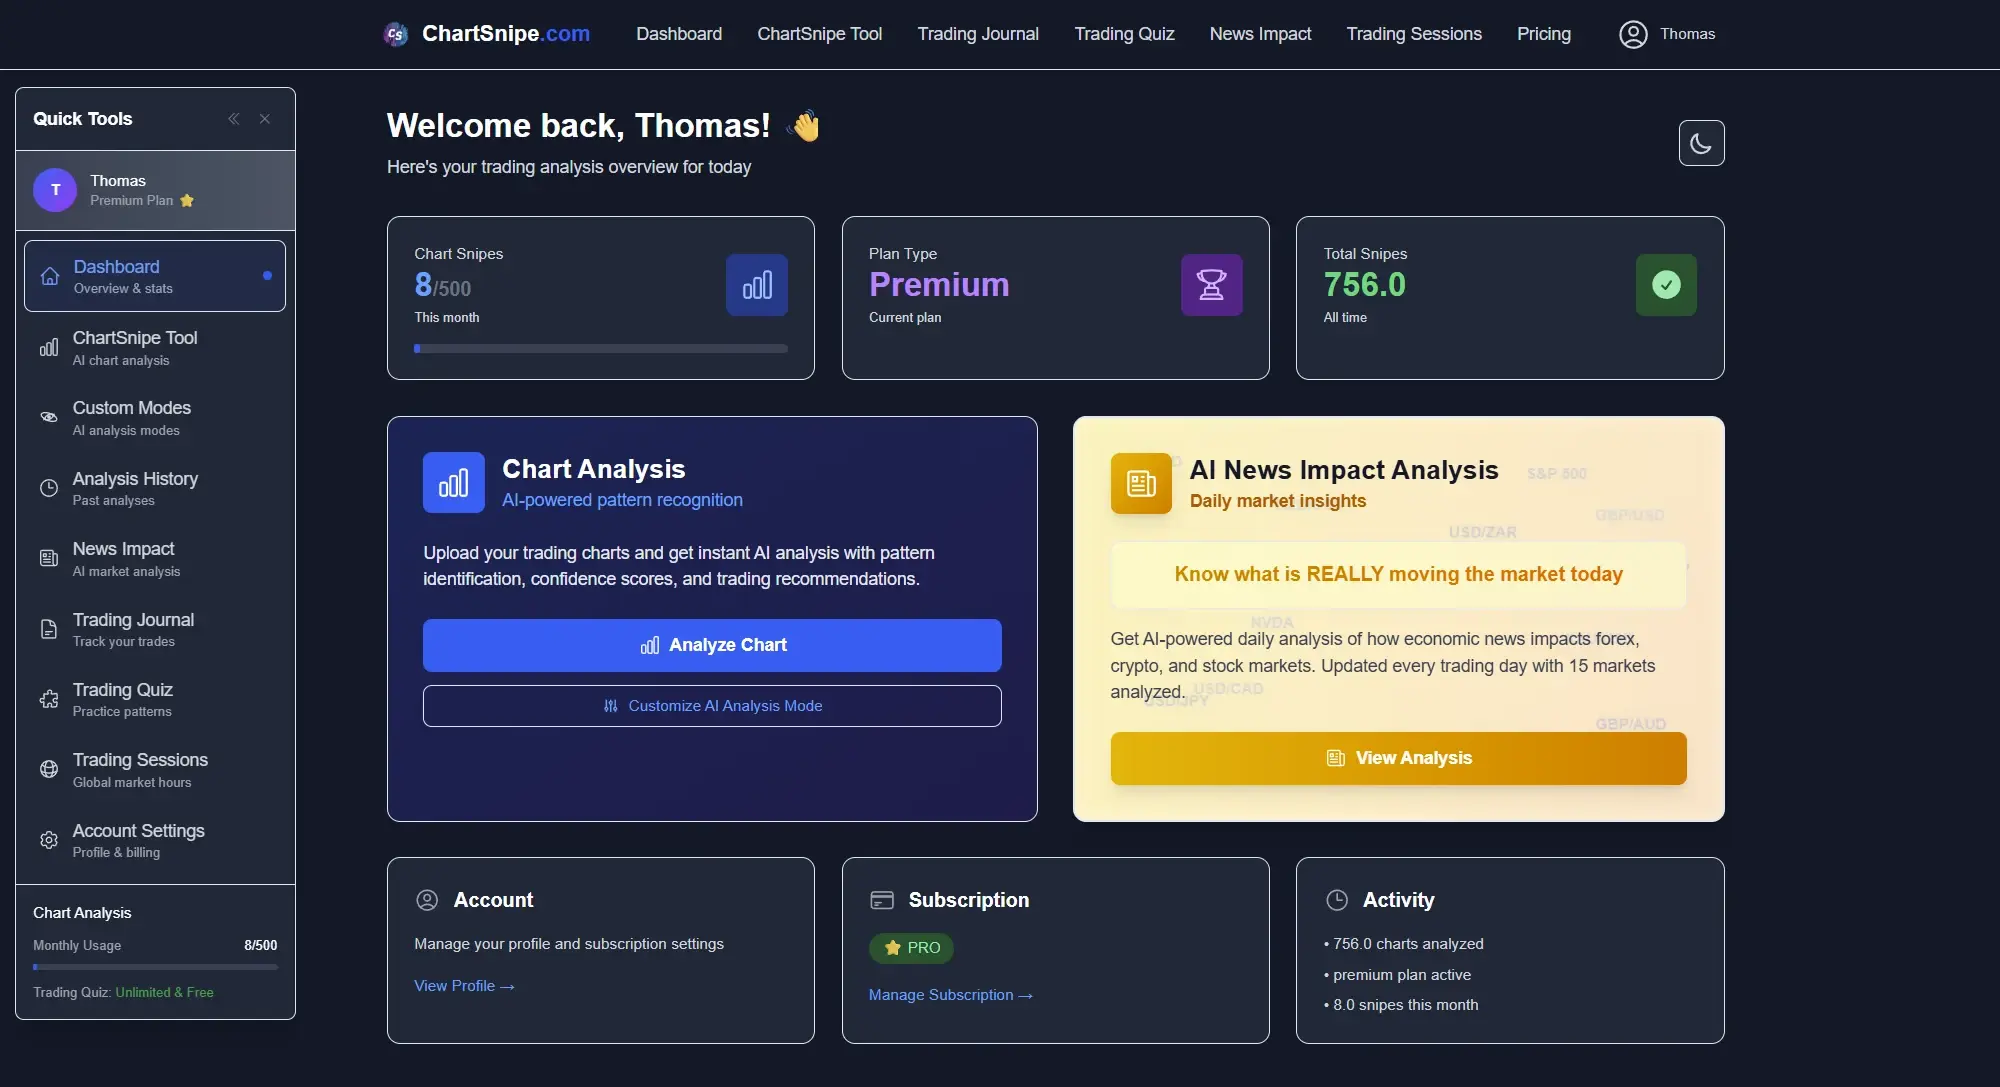
Open the News Impact dashboard
Head to /newsimpact-2. You see all 12 instruments ranked live with current strength percentages.
Identify the extremes
Scan the 8 FX currency cards. Who is deep green? Who is deep red? Ignore the middle four.
Read the AI news context
Expand the top bullish and top bearish cards. Read the fundamental driver. Is it a durable theme or a one-off spike?
Pair strongest with weakest
Build your trade idea. If AUD is strongest and JPY is weakest, the pair is AUD/JPY long. Write it down.
Confirm on the chart
Take a screenshot of AUD/JPY and drop it into ChartSnipe's analysis tool. If the technical picture agrees with the meter, you have a trade. If it disagrees, skip.
That is the whole workflow. Strength tells you the pair, news impact tells you the why, chart analysis confirms the entry. Three layers, one decision.
10. Popular Currency Strength Meters Reviewed
Every forex trader has their favourite. Here is how the most-discussed meters stack up on the things that actually matter: live updates, news context, mobile access, and whether the math is transparent.
| Meter | Live? | News Context | Mobile | Price |
|---|---|---|---|---|
| ChartSnipe | Yes, 5 min | AI-powered, daily | Yes | From free |
| BabyPips MarketMilk | Yes | Minimal | Yes | Free / paid tiers |
| MT4 / MT5 indicator | Depends on feed | None | Desktop only | Free |
| Myfxbook | Yes | None | Limited | Free |
| Forex Factory script | Delayed | None | No | Free |
| TradingView CSM scripts | Yes | None | Yes | Free / Pro |
The BabyPips MarketMilk tool is genuinely good and rightly popular on the forum, but it does one thing: show you numbers. MT4 indicators are a decent starting point if you live in MetaTrader, but they vanish the moment you close the terminal. ChartSnipe is the only option that bundles strength, news impact, and chart analysis in one workflow — which is why it is our recommendation.
See pricing details on the ChartSnipe pricing page — the free tier is enough to try the Currency Strength Index and the full News Impact dashboard.
Frequently Asked Questions
What is a currency strength meter?
A currency strength meter is a tool that ranks the 8 major currencies (USD, EUR, GBP, JPY, CHF, CAD, AUD, NZD) by relative strength, usually by averaging the percentage change of each currency across the 7 pairs it trades in. It helps forex traders identify the strongest and weakest currencies so they can pair them for higher-probability trades.
How is currency strength calculated?
Currency strength is calculated by averaging the percentage change of a currency across the 7 major pairs it trades in. For USD, the formula is: USD strength = avg(−EURUSD %, −GBPUSD %, −AUDUSD %, −NZDUSD %, +USDJPY %, +USDCHF %, +USDCAD %). The signs are inverted when USD is the quote currency so that positive numbers always mean the currency is stronger.
How do you trade with a currency strength meter?
The most common strategy is the strong-versus-weak pairing rule: buy the strongest currency against the weakest currency. If USD is the strongest and JPY is the weakest, you go long USD/JPY. This aligns two directional forces in your favour instead of fighting them. Always confirm the move on the chart before entering.
What is the best currency strength meter?
The best currency strength meter is one that updates in real time, covers all 8 majors, and — most importantly — shows strength in context of news and fundamental drivers. ChartSnipe combines a live Currency Strength Index with daily AI News Impact analysis so you see both what is happening in price and why, in one workflow.
Why do currency strength meters disagree with each other?
Different meters use different timeframes, formulas, and data sources. Some weight pairs by volume, some use simple averages, some use tick data versus end-of-bar data, and some reset at different session opens. The underlying math matters less than using one meter consistently and combining it with fundamentals and chart confirmation.
Is a currency strength meter a lagging indicator?
Yes. A strength meter reflects price action that has already happened. It is best used to confirm a bias, rank pairs, and select the cleanest expression of a theme — not as a standalone entry trigger. Combine it with news catalysts, key levels, and chart patterns for higher-probability trades.
Conclusion: Strength Is Context
A currency strength meter is one of the most underrated tools in forex. It does not tell you where the market is going — it tells you which pair best expresses where the market already is. That alone is enough to transform a trader's win rate, because most losing trades come from picking the wrong pair, not the wrong direction.
The math is simple: average the percentage change across 7 pairs. The strategy is simple: buy strongest, sell weakest. The mistakes are predictable: lag, no news context, ignoring DXY, single-timeframe tunnel vision. And the fix is simple too — use a meter that updates live, check the fundamentals behind every number, and confirm on the chart before you pull the trigger.
That is exactly what ChartSnipe's News Impact dashboard delivers. Live Currency Strength Index, AI-generated news context, and instant chart confirmation, all in one place. Stop guessing which pair to trade — let the data rank them for you.
Sources & Further Reading
- • BabyPips — Currency Strength Meters — beginner-friendly primer on the concept and common formulas
- • Investopedia — Currency Strength — definition, methodology, and interpretation
- • Myfxbook — Currency Strength — live currency heatmap and aggregated positioning data
- • TradingView — Currency Strength Ideas — community-published strength scripts and trade examples
- • Federal Reserve — Foreign Exchange Rates (H.10) — official USD reference rates against all major currencies
Related Articles

NFP Trading Strategy Playbook
The full 2026 playbook for trading Non-Farm Payrolls on forex and gold, with the DXY reaction chain.

How to Read a Forex Economic Calendar
Decode red-impact events, consensus, and the release priorities that feed directly into strength readings.

High-Impact Forex News Events
The news releases that reshape currency strength rankings and how to trade each one.
Written by the ChartSnipe Team
ChartSnipe is an AI-powered chart screenshot analysis tool and daily AI news impact analysis platform for forex, gold, Bitcoin, S&P 500, and Nasdaq traders. Our team combines deep experience in technical analysis, AI vision models, and live market data across 32+ instruments to deliver actionable trading insights.
See today's live Currency Strength Index
Open the ChartSnipe News Impact dashboard and see which currency is strongest right now, with full AI-generated context. Free to try.
Open Live Strength IndexWritten by the ChartSnipe Team — Building the future of AI-powered forex analysis.