
How to Trade VWAP Bands (and When Not To)
The bands in VWAP are standard deviation lines around the day's volume-weighted average price. Here is how they are built, how to read them, when a fade back to VWAP works, when price just rides the band, and why spot forex traders should be careful with all of it.
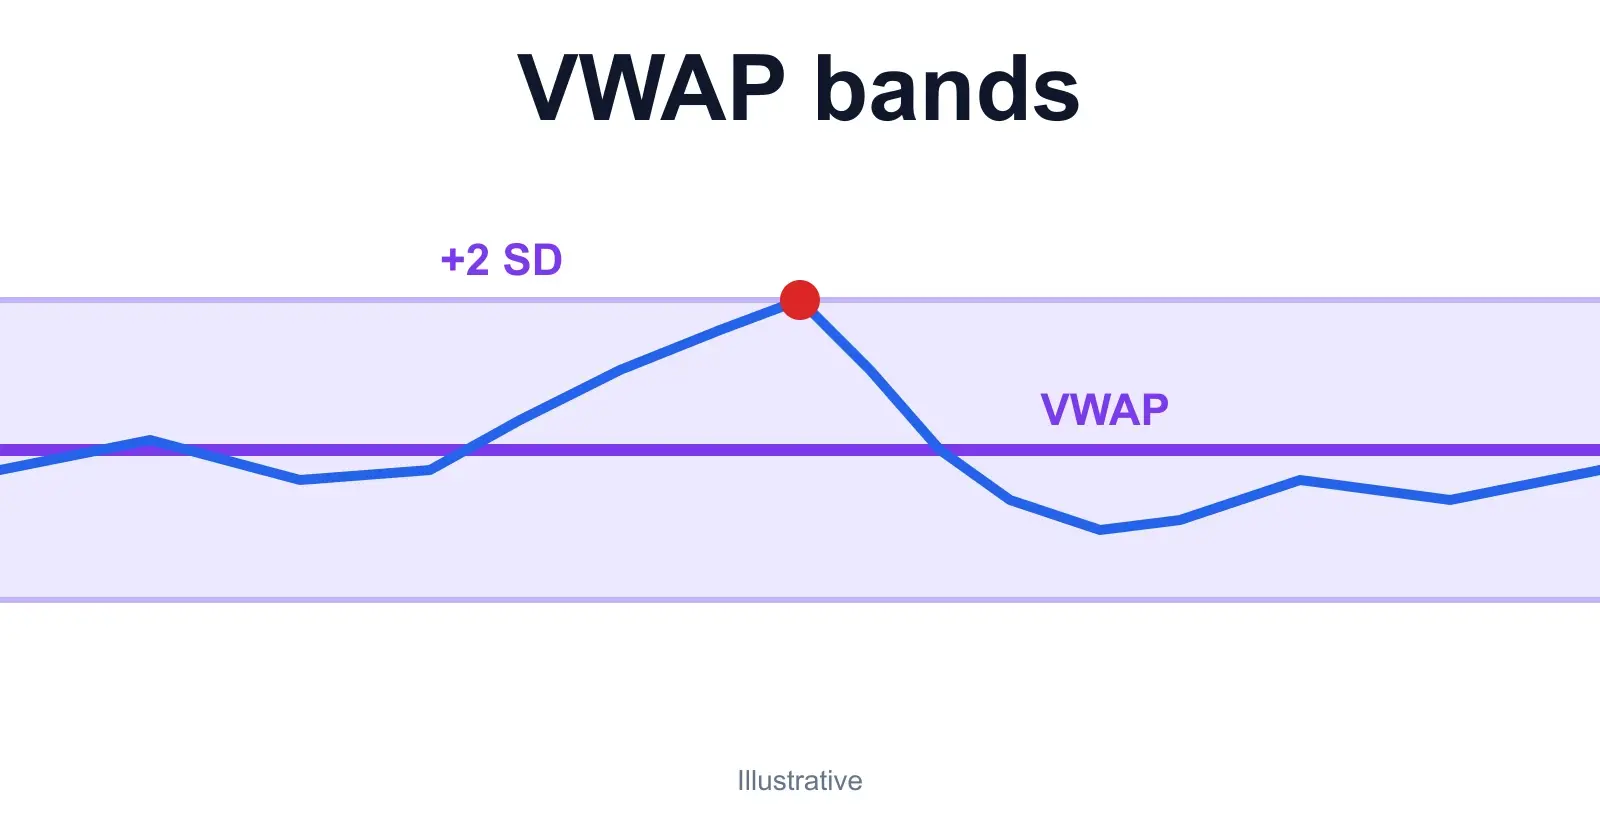
The bands in VWAP answer one question: how far has price stretched from where the day's volume actually changed hands? VWAP is the average price weighted by volume. The bands sit one and two standard deviations above and below it, so a candle at the upper 2 SD band is a statement that price is far from the volume-weighted average, measured against the day's own volatility. They do not say what happens next.
What happens next depends on the kind of day. On a range day, a stretch to +2 SD tends to snap back toward VWAP, and a tight-stop fade pays. On a trend day, price rides the +1 to +2 SD zone for hours and the same fade is a slow way to lose. Most of the work in trading VWAP bands is telling those two days apart, and being honest about the data underneath. If you trade spot forex, the volume is tick volume, which changes how much weight the bands deserve. That caveat gets its own section below.
Key Takeaways
- →VWAP = cumulative (typical price x volume) / cumulative volume. The bands are VWAP plus or minus 1 and 2 volume-weighted standard deviations. Five bars in our example give VWAP 100.60 and SD 0.52.
- →The bands widen when the day gets volatile. A +2 SD fade is only as good as the band is wide, and a band that is widening fast is a warning, not an invitation.
- →Range day: fade 2 SD back to VWAP. Trend day: buy pullbacks to VWAP and the 1 SD band instead. Decide which day it is before you place the trade.
- →Spot forex has no consolidated volume, so VWAP there is a tick-weighted average. Treat it as a reference line and a volatility ruler, not as proof of where size traded.
- →Session VWAP resets each day. Anchored VWAP does not. Pick the one that matches the question you are asking.
1. What VWAP trading is
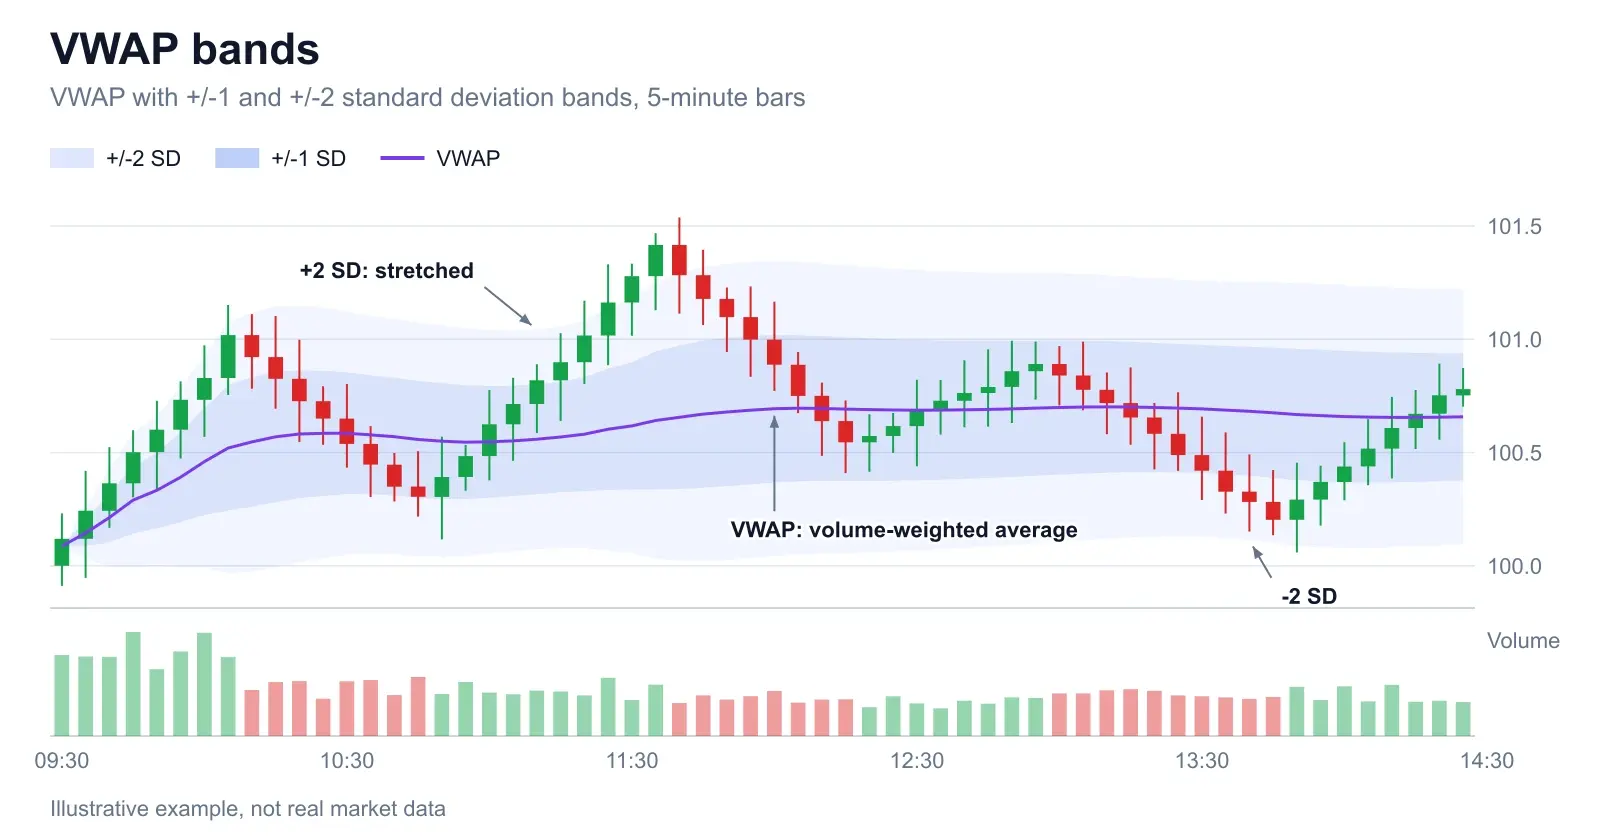
VWAP, the volume-weighted average price, is the average price of the session with each price weighted by the volume traded there. Unlike a simple moving average it is volume-weighted, so heavy-volume prices count for more. Investopedia notes that institutional buyers use VWAP to move into or out of a position with as little market impact as possible, and will try to buy below it or sell above it. A fund working a large order wants a fill near VWAP so its own order does not move the market. That is why price so often reacts around it. Plenty of participants have it on their screens, and some have it in their order instructions.
VWAP trading is just using that line as a reference. Above VWAP, the average buyer today is in profit. Below it, the average buyer is under water. The bands add the missing dimension: not just which side of the average price is on, but how far, in units of the day's own spread.
2. How to calculate VWAP and the bands
Three steps, and you can do them in a spreadsheet. First, the typical price of each bar: (high + low + close) / 3. Second, VWAP: the running total of typical price times volume, divided by the running total of volume. Third, the spread: the volume-weighted variance of typical price around VWAP, whose square root is the standard deviation. The bands are VWAP plus and minus 1 and 2 of those.
Here it is on five invented 5-minute bars. Bar 1 has a high of 100.6, a low of 99.8 and a close of 99.6, so the typical price is 300.0 / 3 = 100.00, on volume of 4,000. Bar 2 gives 301.5 / 3 = 100.50 on 2,000. Bar 3 gives 303.0 / 3 = 101.00 on 3,000. Bar 4 gives 301.2 / 3 = 100.40 on 1,000. Bar 5 gives 304.2 / 3 = 101.40 on 2,000.
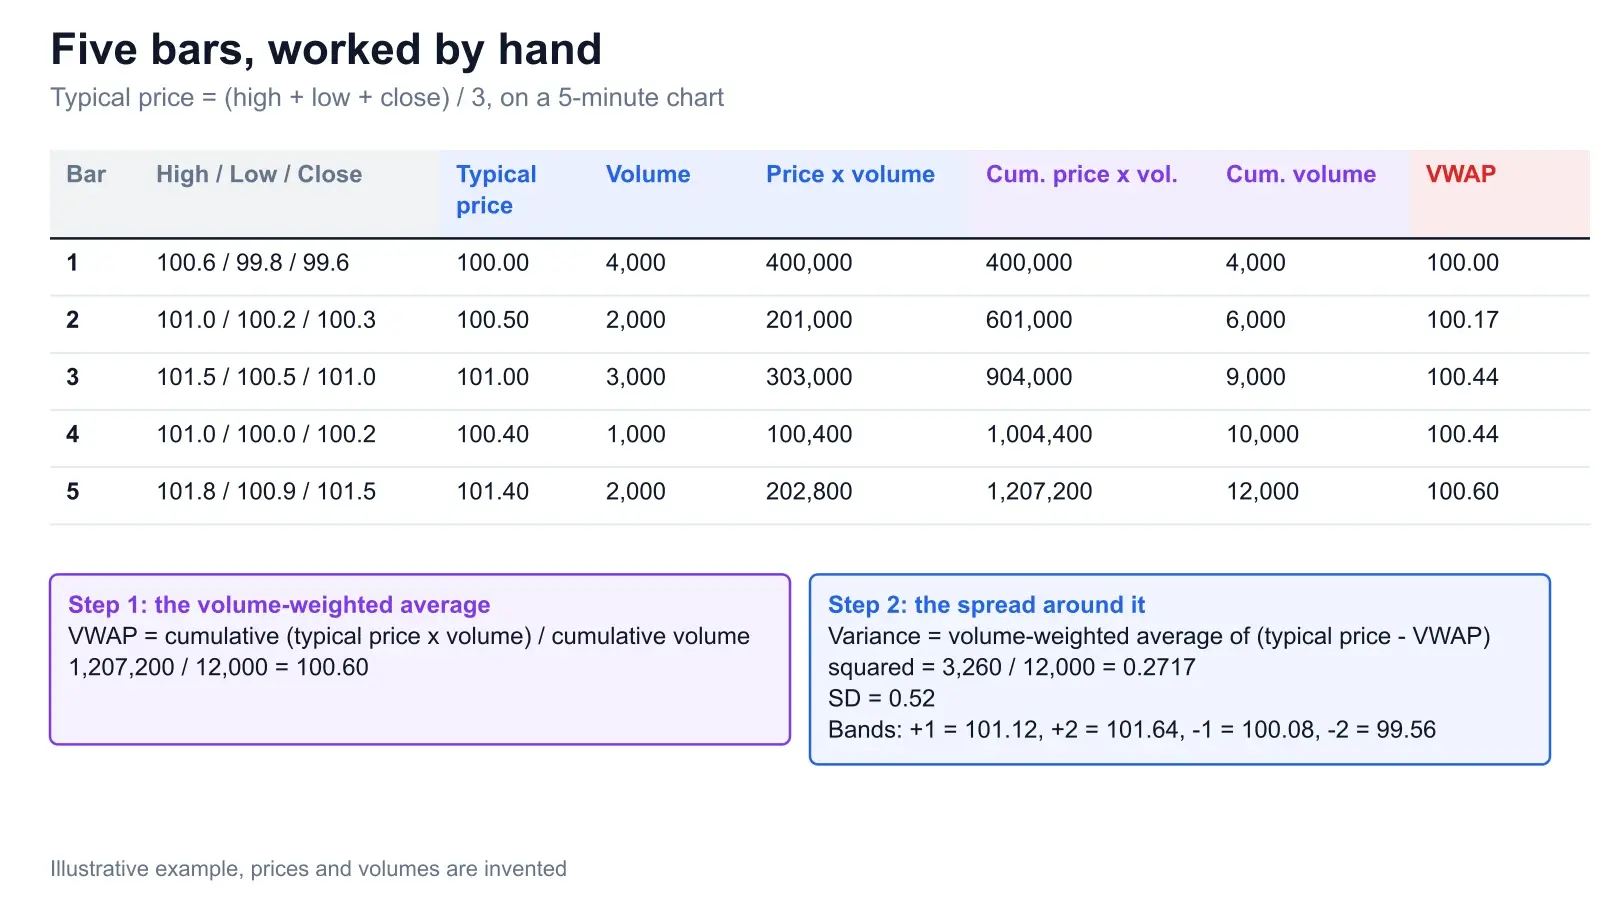
Multiply each typical price by its volume: 400,000, 201,000, 303,000, 100,400 and 202,800, which sum to 1,207,200. Total volume is 12,000. VWAP is 1,207,200 / 12,000 = 100.60. Note how bar 4, with only 1,000 of volume, barely moved the line. Volume is the weight.
Now the spread. The distance of each typical price from 100.60 is -0.60, -0.10, +0.40, -0.20 and +0.80. Square each and weight by volume: 0.36 x 4,000 = 1,440; 0.01 x 2,000 = 20; 0.16 x 3,000 = 480; 0.04 x 1,000 = 40; 0.64 x 2,000 = 1,280. That sums to 3,260. Divide by 12,000 and the variance is 0.2717, so the standard deviation is 0.52. The bands: +1 SD at 101.12, +2 SD at 101.64, -1 SD at 100.08, -2 SD at 99.56.
Two caveats. After bar 1 the standard deviation is exactly zero, because there is only one price, so the bands start with no width at all. That is why the first 15 to 30 minutes of any VWAP chart should be ignored. And platforms differ in small ways: some use the close instead of typical price, some use a different deviation formula. TradingView's VWAP documentation, for example, defaults the source to hlc3, builds its bands from standard deviations since the last anchor, and lets you set that anchor to a session, week, month and more. The shape is the same, the third decimal is not.
One more point about the standard deviation label. For data that is roughly normally distributed, about 68% of values fall within one standard deviation and about 95% within two, per the 68-95-99.7 rule. Do not carry those percentages over to VWAP bands. Intraday prices are not normally distributed, the bands are computed on a running sample that includes the move you are looking at, and the tails are fat. The bands are a ruler, not a probability table.
3. Why the bands widen
The bands are not a fixed envelope. They breathe with the day's variance. In a tight morning range, almost every price is close to VWAP, so the standard deviation is small and the bands hug the line. When a big directional move arrives, the new prices are far from the old average, variance builds, and the bands open up.
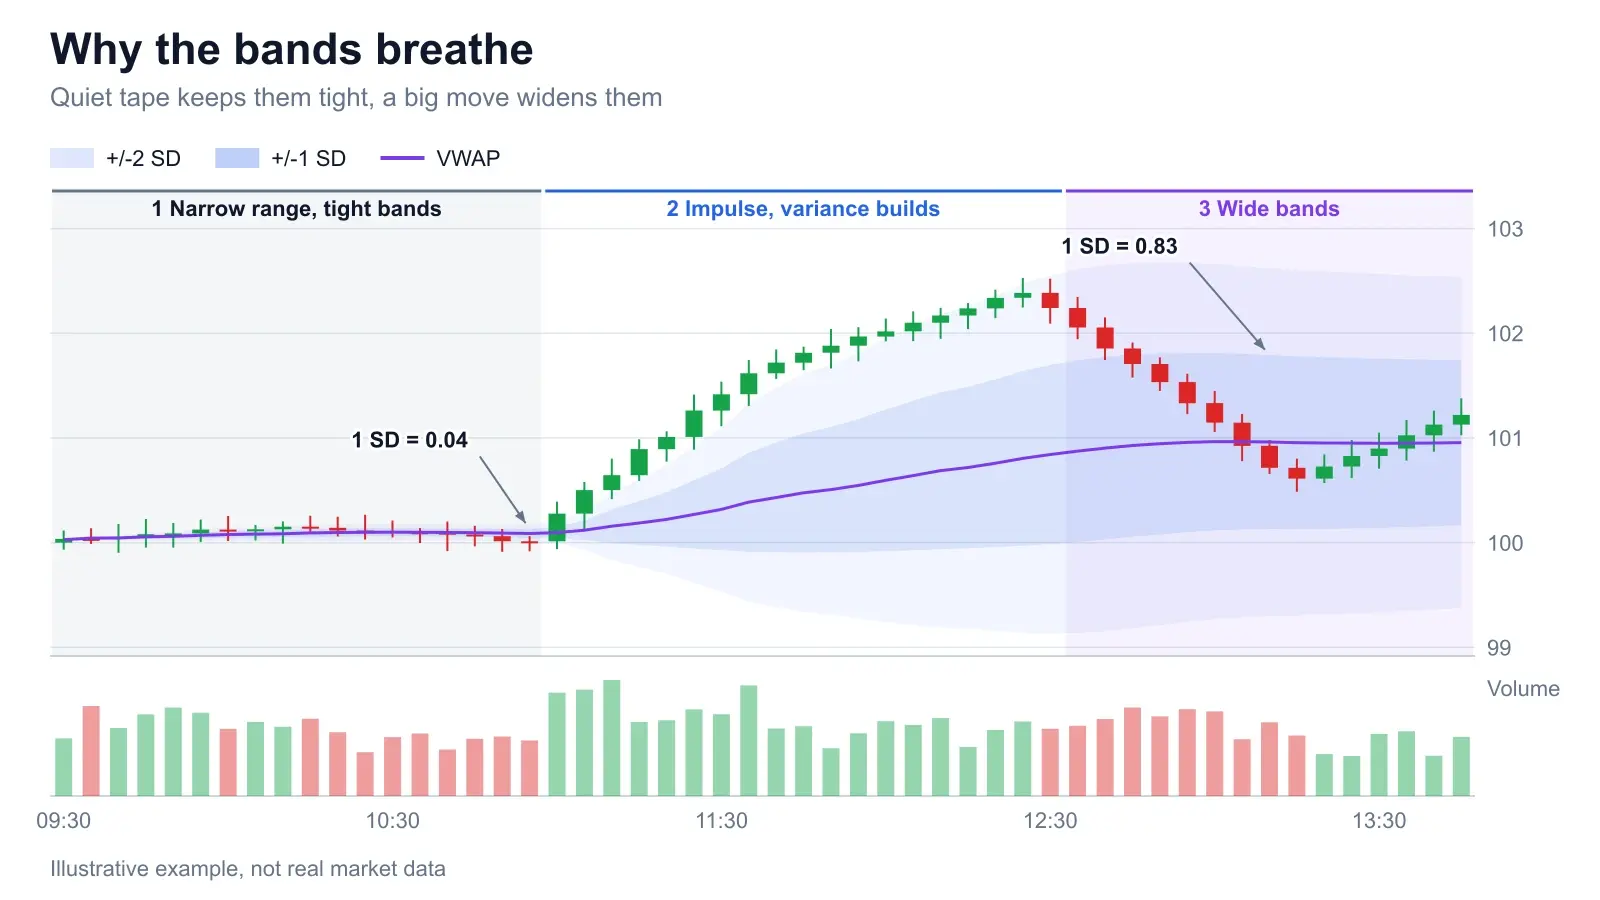
This has a practical consequence that new traders miss. A touch of +2 SD in a quiet tape is a few cents from VWAP and is almost noise. A touch of +2 SD after an impulse is more than a dollar away and means something. Always read the width of the band alongside the position of price in it. And a band that is widening quickly while price pushes along it is the single clearest sign that you are not in a mean-reverting session.
4. How to use VWAP bands
Read the bands as zones. Between -1 and +1 SD is the fair-value zone, where most of the day's trade happens. Between 1 and 2 SD is stretched. Beyond 2 SD is extended: price has gone further than the day's volatility has so far justified. Then add the one thing the bands cannot tell you, which is the type of day.
A simple test, applied after the first hour: does VWAP slope, and do the last 6 to 10 closes sit on one side of it? If price keeps crossing VWAP and the line is flat, you have a range day and mean reversion is the better bet. If VWAP is sloping and price is holding on one side, you have a trend day and fading is the wrong side. This is a judgement, not a formula, and you will get it wrong. That is why every trade below has a stop.
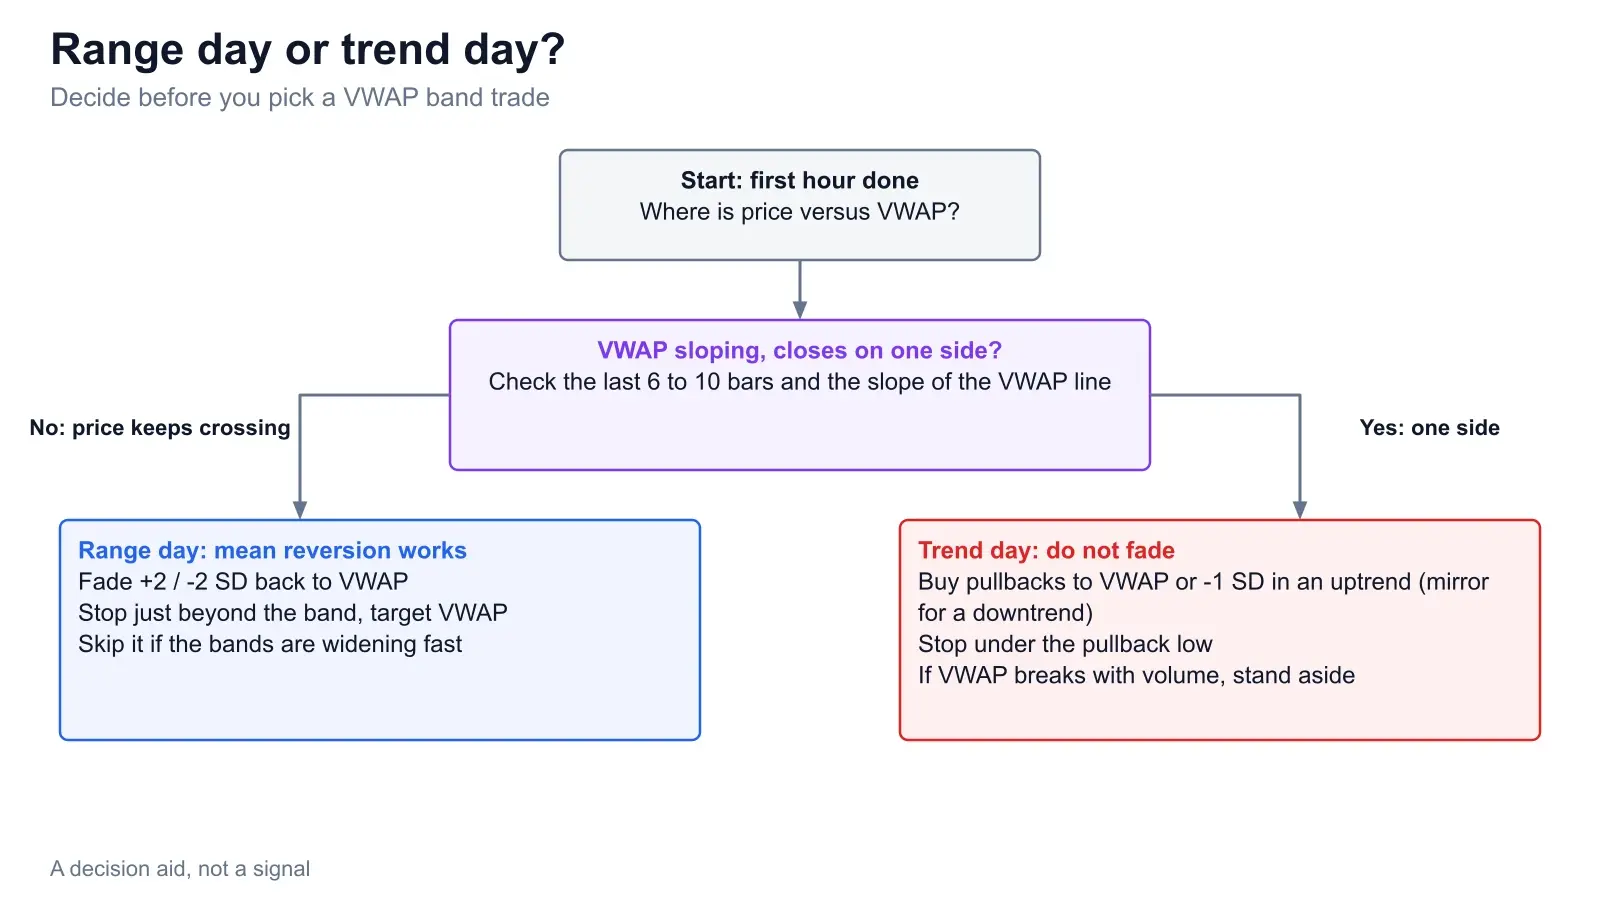
Day type is not random, either. Scheduled news is a common trigger for a trend day, so check the economic calendar before you decide to fade anything. A fade into a CPI or payrolls release is not mean reversion, it is a bet against a catalyst.
5. The mean-reversion fade
The classic VWAP bands trade is the fade. On a range day, when price pushes up to the +2 SD band and stalls, you short with a stop just beyond the band and a target at VWAP. The logic is simple: price is far from the average, there is no new information, and the average acts like a magnet.
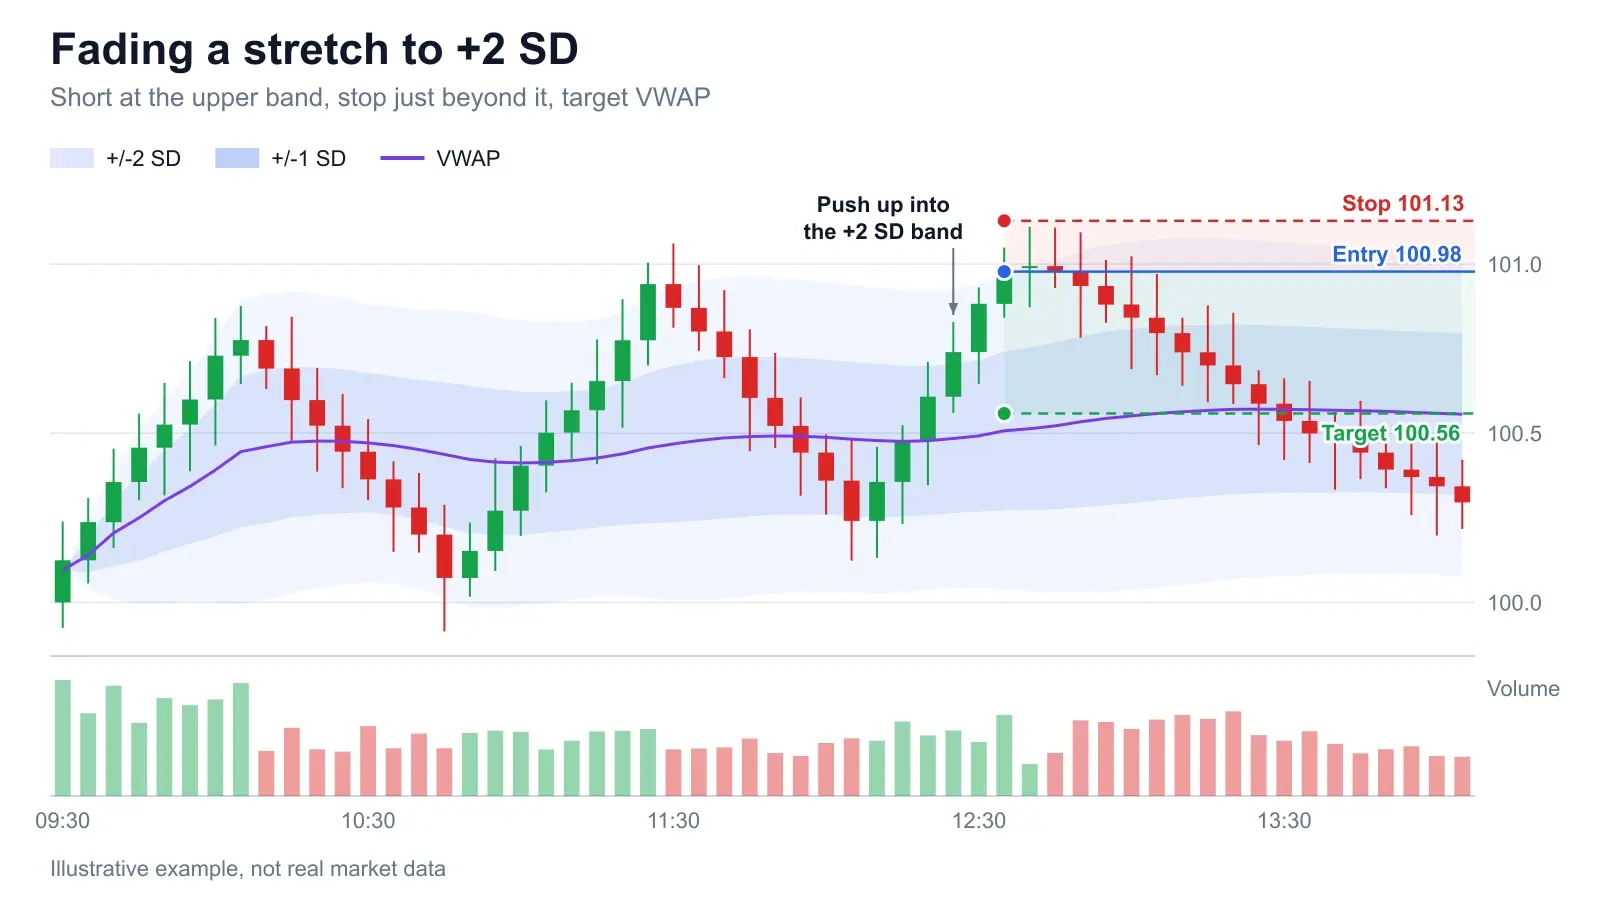
The numbers on this chart are our own worked example. Entry 100.98, stop 101.13, risk 0.15. Target 100.56, reward 100.98 - 100.56 = 0.42. That is a reward-to-risk of 0.42 / 0.15 = 2.8 to 1. Risking $100 sizes the trade at $100 / 0.15 = 666 units, and hitting the target pays 666 x 0.42, about $280. At 2.8 to 1 you break even if the trade wins 1 / (1 + 2.8) = 26.3% of the time. For the wider principle, see our risk-reward ratio examples.
Now the part that goes missing in most explainers. That 2.8 only exists because the stop is tight, and the stop is only tight because the band is narrow on a quiet range day. The win rate is not given by the arithmetic. It is given by whether the day stays a range day, and the strategy has no way to know that in advance. Fades tend to work in a quiet midday lull and fail when news arrives. Look for a visible reason price is stretched with no follow-through, such as volume drying up on the push, and skip the trade when the bands are opening quickly.
6. When a trend rides the band
On a trend day the same setup does the opposite. Price reaches +2 SD, you short, and nothing happens except that price keeps walking along the band while VWAP rises underneath it.
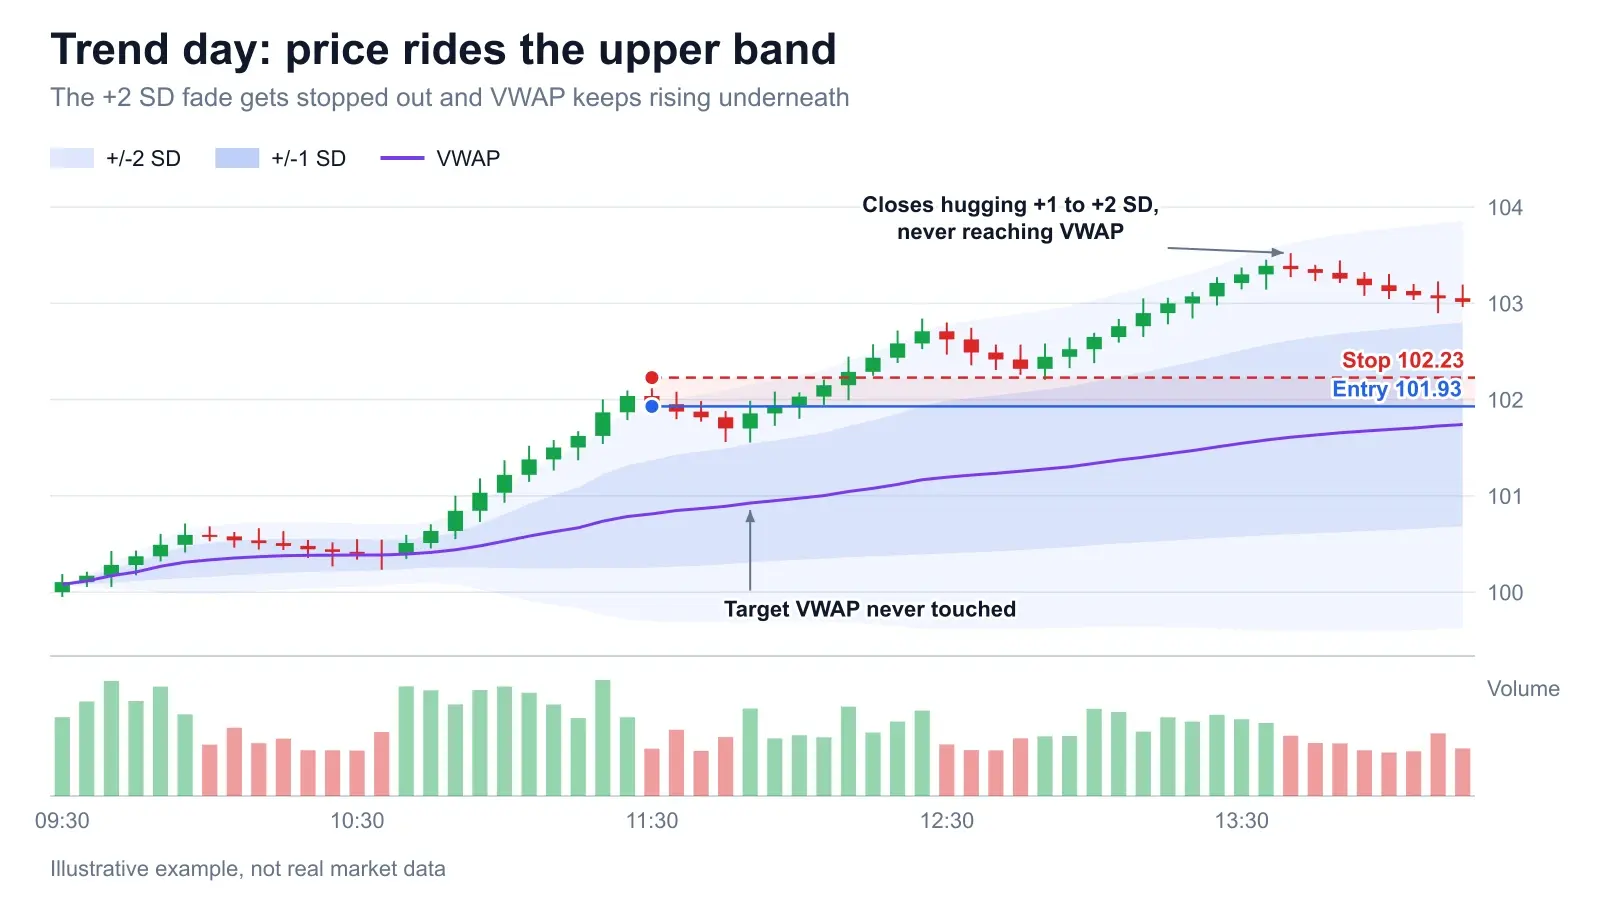
Same arithmetic, opposite result. The short entered at 101.93 with a 0.30 stop loses $100 at a 333-unit size ($100 / 0.30). A trader who skipped the stop and waited for VWAP would have watched the price finish about 1.1 above the entry, roughly a $360 loss on the same 333 units, with VWAP still 1.3 below the close. The fade did not fail because the band was wrong. It failed because the day type was.
The signs of a band ride: VWAP slopes in one direction, the closes cluster between +1 and +2 SD rather than reaching VWAP, pullbacks stop at +1 SD or at VWAP itself, and the bands keep widening. When you see that, a +2 SD touch is not a reversal signal. It is trend strength. Compare with the traps and fakeouts we have covered: a failed break gives you a reason to fade. A band touch on its own does not.
7. How to trade VWAP in a trend: the pullback
If price is trending and VWAP is sloping the same way, the better VWAP trade is with the trend. Wait for a pullback on lighter volume to VWAP or the 1 SD band, enter when it holds, and put the stop below the pullback.
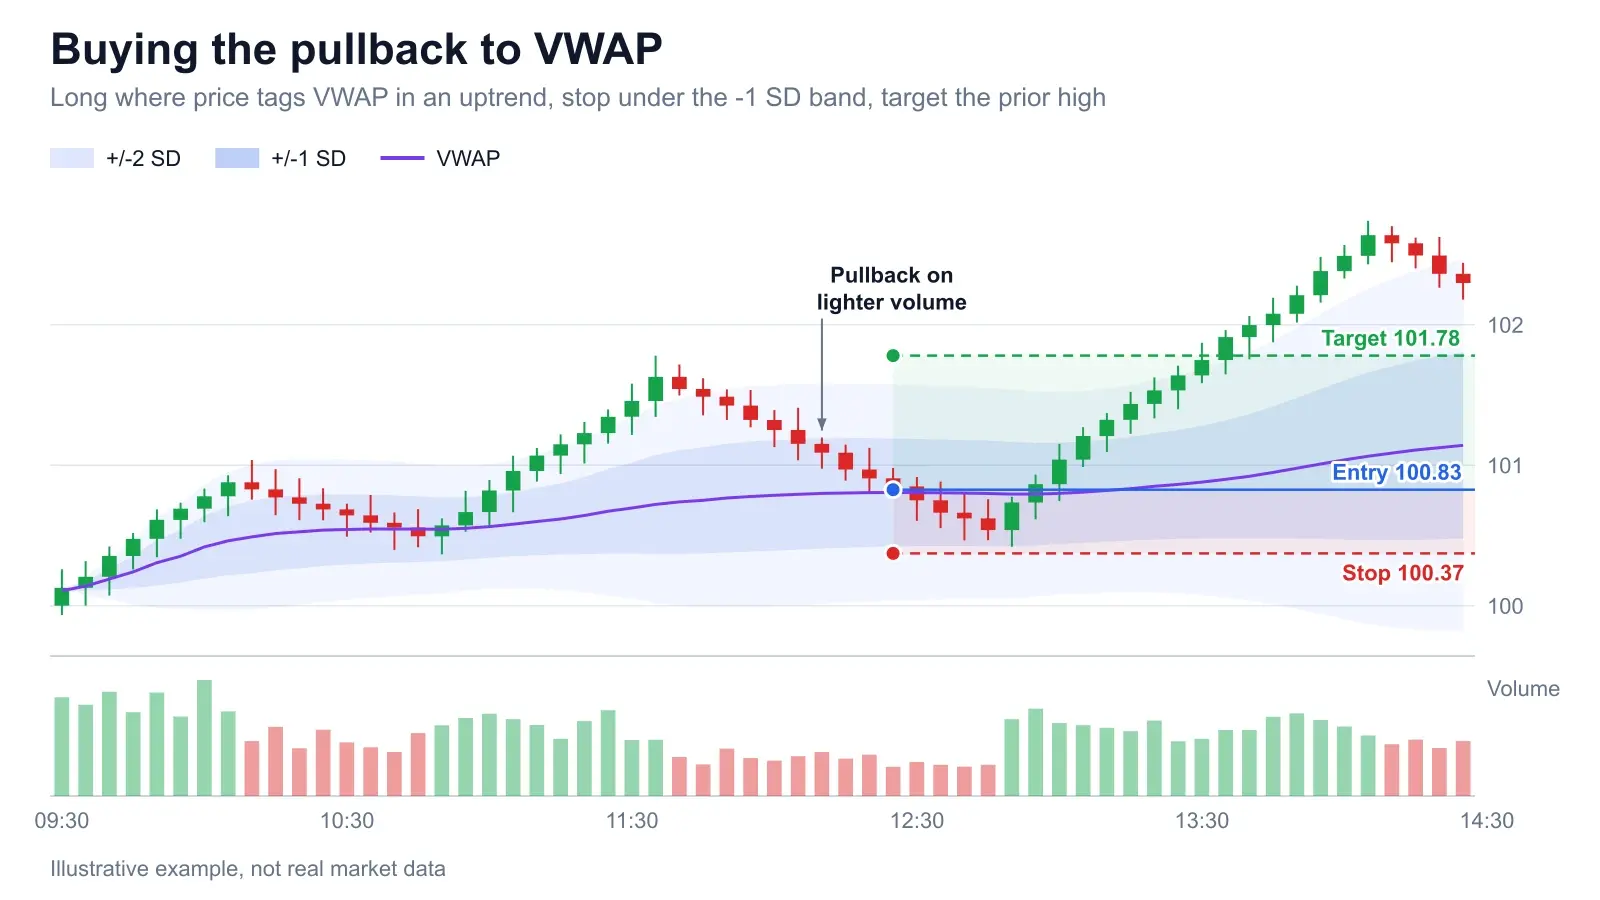
Our worked numbers: entry 100.83, stop 100.37, risk 0.46. Target 101.78, reward 0.95. Reward-to-risk is 0.95 / 0.46 = 2.1 to 1. At $100 of risk the size is $100 / 0.46 = 217 units, and the target pays 217 x 0.95, about $206. Notice that the target is the prior high, not a band. Bands move, and a target that moves while you hold is a target you will talk yourself out of. Where you place the stop is its own subject, covered in our stop-loss placement guide.
The pullback trade can fail too. If price slices through VWAP with volume rather than tagging it and bouncing, the trend premise is gone and the stop does its job. That is the point of the stop being under the -1 SD band rather than at VWAP: the band gives the trade room to breathe, and the break of it is information.
8. Session resets, anchored VWAP and settings
Session VWAP starts fresh when the session starts. Yesterday's volume has no vote. That is the right tool for judging where today's buyers and sellers stand. Anchored VWAP is different: you choose the starting bar, often a swing high, a gap, a news candle or an earnings bar, and it accumulates from there, so it shows the average price of everyone who traded since that event.
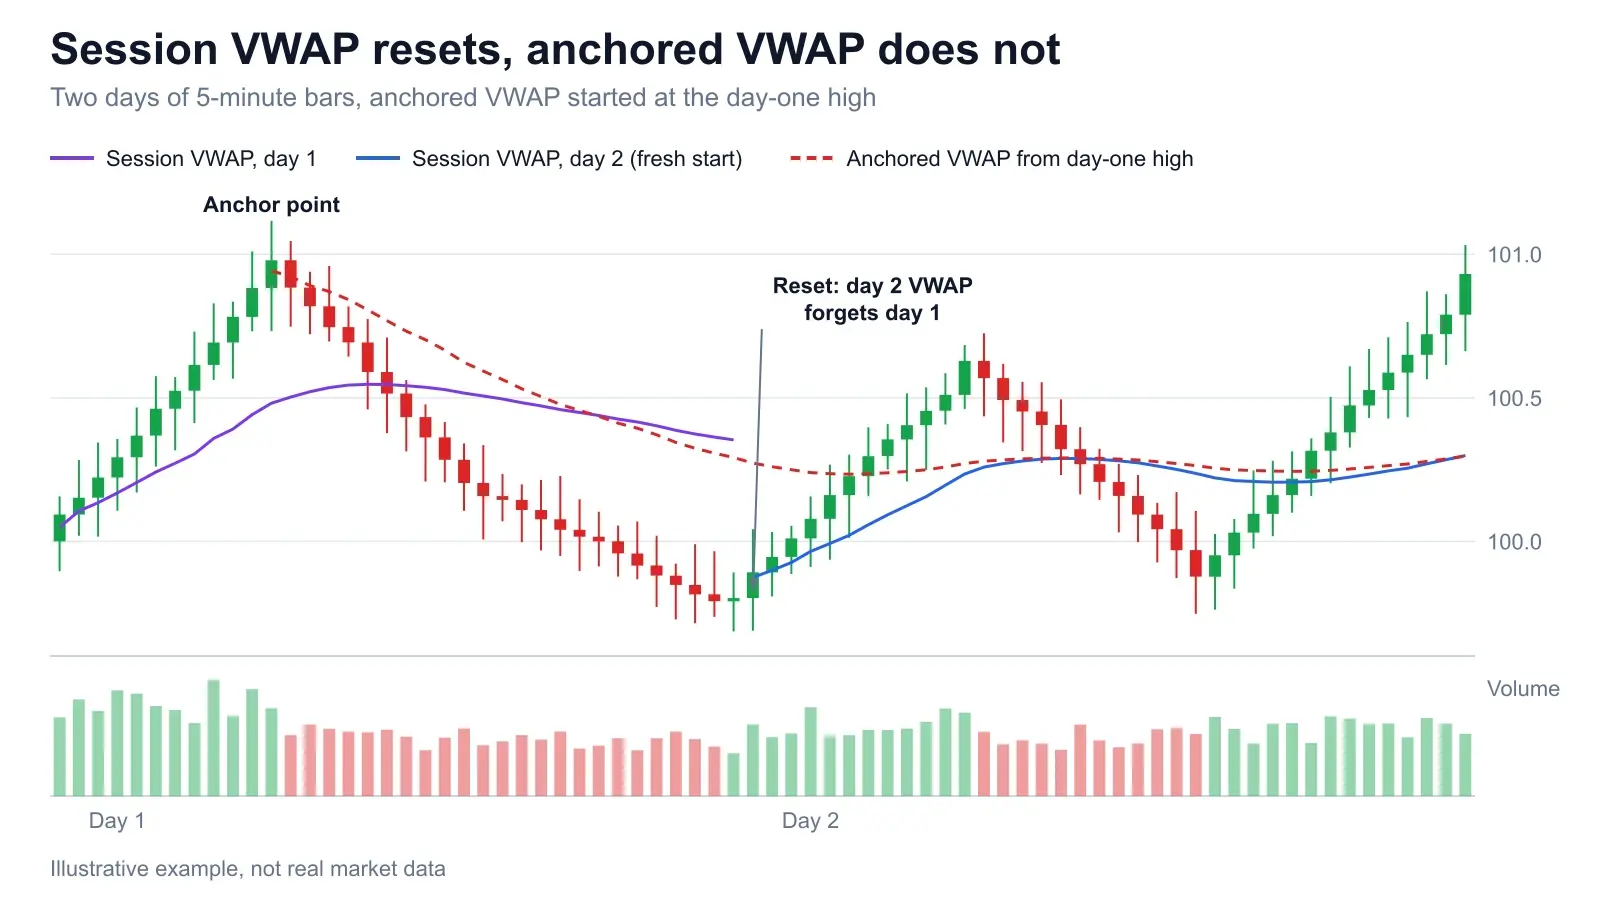
Use session VWAP and its bands for intraday fades and pullbacks. Use anchored VWAP when you want to know whether the people who bought the high are in profit, which is a swing-trading question. When the two lines converge, as on the right side of the chart, the old volume has been outweighed and the choice stops mattering.
On settings, there is no best one, and anyone selling you one is selling a backtest. A sensible default: session VWAP, typical price as the source, bands at 1 and 2 standard deviations, on a 1 to 5 minute chart, ignoring the first 15 to 30 minutes. If you find that a 1.5 or 2.5 multiplier makes your backtest look good, you have probably fitted noise. For the wider picture on whether indicators carry any edge, our ranking of technical indicators by actual edge is the honest starting point: indicators describe, they rarely predict. And one more distinction that gets asked: VWAP is the volume-weighted mean, while the point of control is the single busiest price. They can sit far apart in a lopsided session.
9. The forex problem: tick volume
This is the part most VWAP guides skip, and our readers are forex heavy, so here it is plainly. VWAP needs volume. Spot forex has no central exchange. Investopedia describes it as an over-the-counter market with no single centralized exchange, and the Bank for International Settlements says FX markets globally can be characterised as OTC markets, with turnover of $7.5 trillion a day in April 2022. Because of that structure, there is no consolidated tape, and none of that turnover prints to a public volume feed you can load on a retail chart.
What your chart shows instead is tick volume: the number of price updates your broker received in each bar, not the number of units traded. This is our own reasoning rather than a published finding: tick count tends to rise when the market is busy, so it is not meaningless, but it is one broker's feed, it differs between brokers, and a bar with 500 ticks of 0.1 lot is the same as a bar with 500 ticks of 50 lots. So VWAP on a spot pair is really a tick-weighted average price.
What survives: the line is still a clean session average, and the bands are still a fair measure of how stretched price is against the day's own range, because the standard deviation does not care what the weights mean. What does not survive is the story that VWAP marks where institutional size traded. In FX, treat it as a reference line, weight it less than you would on an equity index or a futures contract, and do not build a thesis on the volume. If you want real volume on a currency, use the futures (6E for EUR/USD, for example), which trade on an exchange.
FX also has a session problem. Depending on your platform's reset time, session VWAP can restart in the middle of the Asian session. Anchor to the London open or the New York open instead, and use our forex session times guide to pick the one that fits the pair you trade.
Frequently asked questions
How do you use VWAP bands?
Treat VWAP as the day's fair value and the +1/+2 SD and -1/-2 SD bands as a ruler for how stretched price is. On a range day, fade moves to the 2 SD band back toward VWAP with a stop just beyond the band. On a trend day, do not fade. Buy pullbacks to VWAP or the 1 SD band in an uptrend (mirror it in a downtrend) and stand aside if VWAP breaks on volume.
How do you calculate VWAP and its bands?
VWAP is the running sum of typical price times volume divided by the running sum of volume, where typical price is (high + low + close) / 3. The bands come from the volume-weighted variance of typical price around VWAP: the standard deviation is its square root, and the bands sit at VWAP plus or minus 1 and 2 standard deviations. In the worked example, five bars give VWAP 100.60 and a standard deviation of 0.52.
Does VWAP work in forex?
Only partly. Spot forex is over the counter, with no central exchange or consolidated volume, so retail charts use tick volume, which counts price updates rather than units traded. VWAP and its bands still work as a session reference and a volatility ruler, but the claim that they show where the volume traded is weak. Futures such as 6E or ES report real volume.
What is the difference between VWAP and anchored VWAP?
Session VWAP resets at the start of each session or day. Anchored VWAP starts from a bar you choose, such as a swing high, a gap or an earnings bar, and keeps accumulating, so it remembers everything traded since that anchor. Session VWAP tells you about today. Anchored VWAP tells you about the average holder since an event.
What are the best VWAP settings for day trading?
There is no best setting. A sensible default is session VWAP on a 1 to 5 minute chart, typical price (hlc3) as the source, and bands at 1 and 2 standard deviations. Ignore the first 15 to 30 minutes, when there are too few bars for the bands to mean anything. Tuning the multiplier until a backtest looks good mostly fits noise.
What is the difference between VWAP and the point of control?
VWAP is the volume-weighted mean price. The point of control is the single price level where the most volume traded, the mode. In a lopsided session they can sit far apart: VWAP is pulled toward the tail of the distribution, while the point of control stays at the busiest price.
Sources & further reading
- → Investopedia: VWAP, the definition, institutional use as a benchmark, and the daily restart.
- → TradingView: VWAP indicator documentation, source, anchor period and standard deviation band settings.
- → Investopedia: Forex, why spot FX is an over-the-counter market with no central exchange.
- → Bank for International Settlements: Triennial Survey 2022, FX as an OTC market and $7.5 trillion daily turnover.
- → Wikipedia: 68-95-99.7 rule, what one and two standard deviations cover for normal data, and why fat tails break it.
Is it a range day or a trend day?
Upload a screenshot of your VWAP chart to the Chart Snipe tool for a second read on trend, structure and risk before you take the fade. Then log the trade in the journal so you can see which day types your fades actually pay on.