Bull Trap & Bear Trap Patterns: Avoid Fakeouts
How to identify and trade the 12 most dangerous trap patterns that wipe out retail traders every single day. Stop being the exit liquidity.
Every trader remembers the first time they got trapped. You saw the breakout, you entered with conviction, and within minutes the market reversed and ran your stop. That wasn't bad luck. That was by design. Institutional traders, market makers, and algorithms deliberately engineer false breakouts to generate the liquidity they need to fill massive orders in the opposite direction.
Bull traps and bear traps are the single biggest reason retail traders lose money. Studies consistently show that over 70% of retail traders are unprofitable, and a massive portion of those losses come from entering breakouts that immediately reverse. These aren't random market fluctuations. They are calculated moves designed to trigger clusters of stop losses sitting at obvious support and resistance levels. Understanding smart money concepts and liquidity is the first step to seeing these traps before they spring shut.
This guide covers 12 trap and fakeout patterns that every serious trader must recognize. These are not theoretical concepts from a textbook. They are battlefield-tested patterns that appear on every instrument, every timeframe, every single trading day. Learn them, or keep funding the accounts of those who already have.
Trap Patterns: Where Retail Traders Get Destroyed
Trap patterns are the purest form of market deception. They exploit the most basic instinct traders have: the fear of missing out and the panic of seeing price move against them. Institutions know exactly where retail stop losses sit because the levels are painfully obvious. Round numbers, prior swing highs and lows, trendline touches. Every textbook teaches traders to place stops at the same locations, which makes those stops a target, not protection.
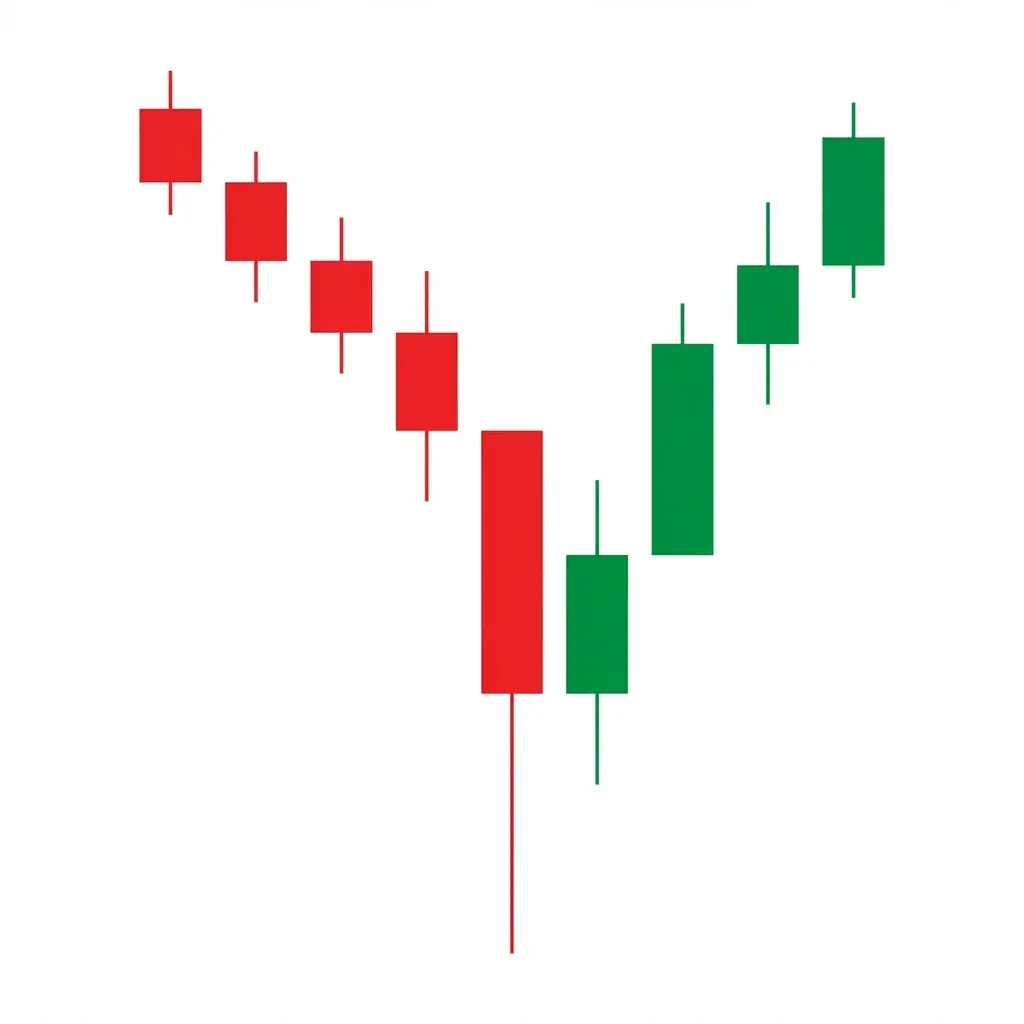
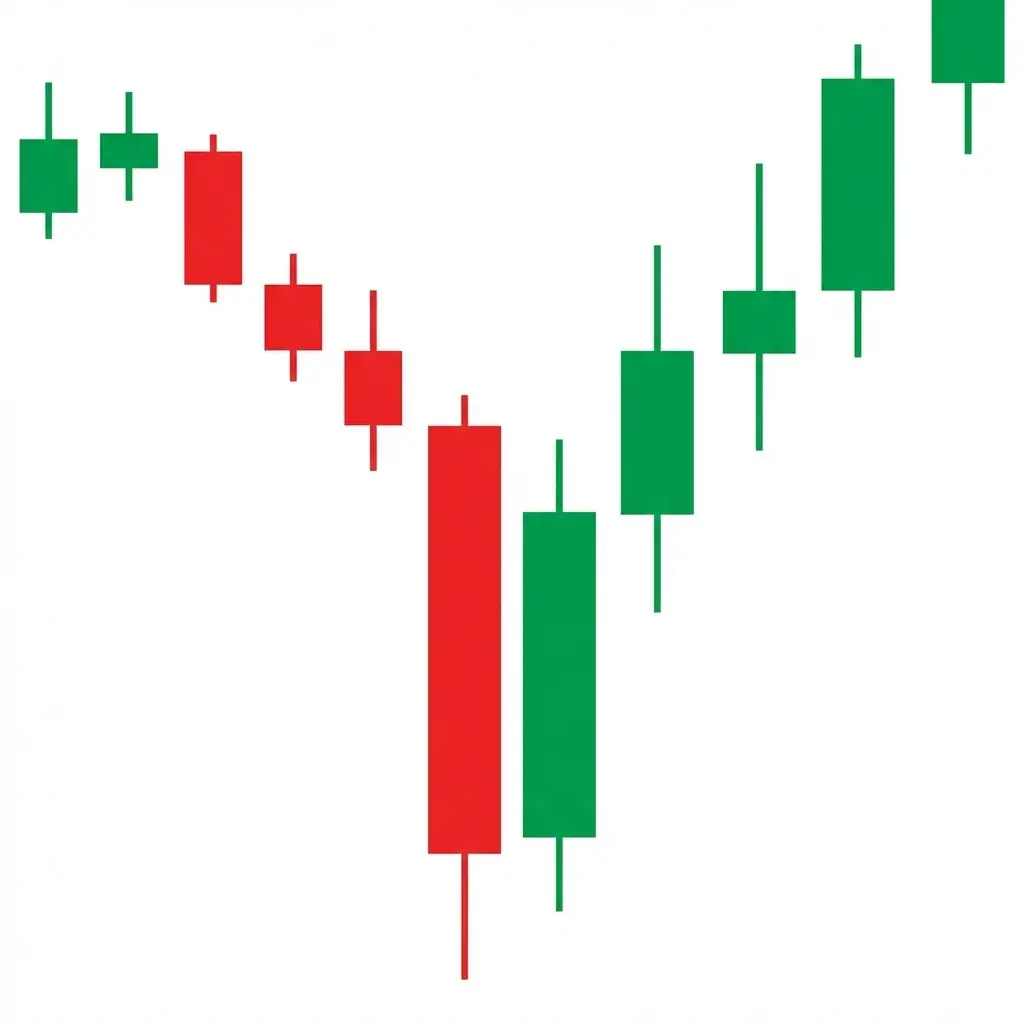
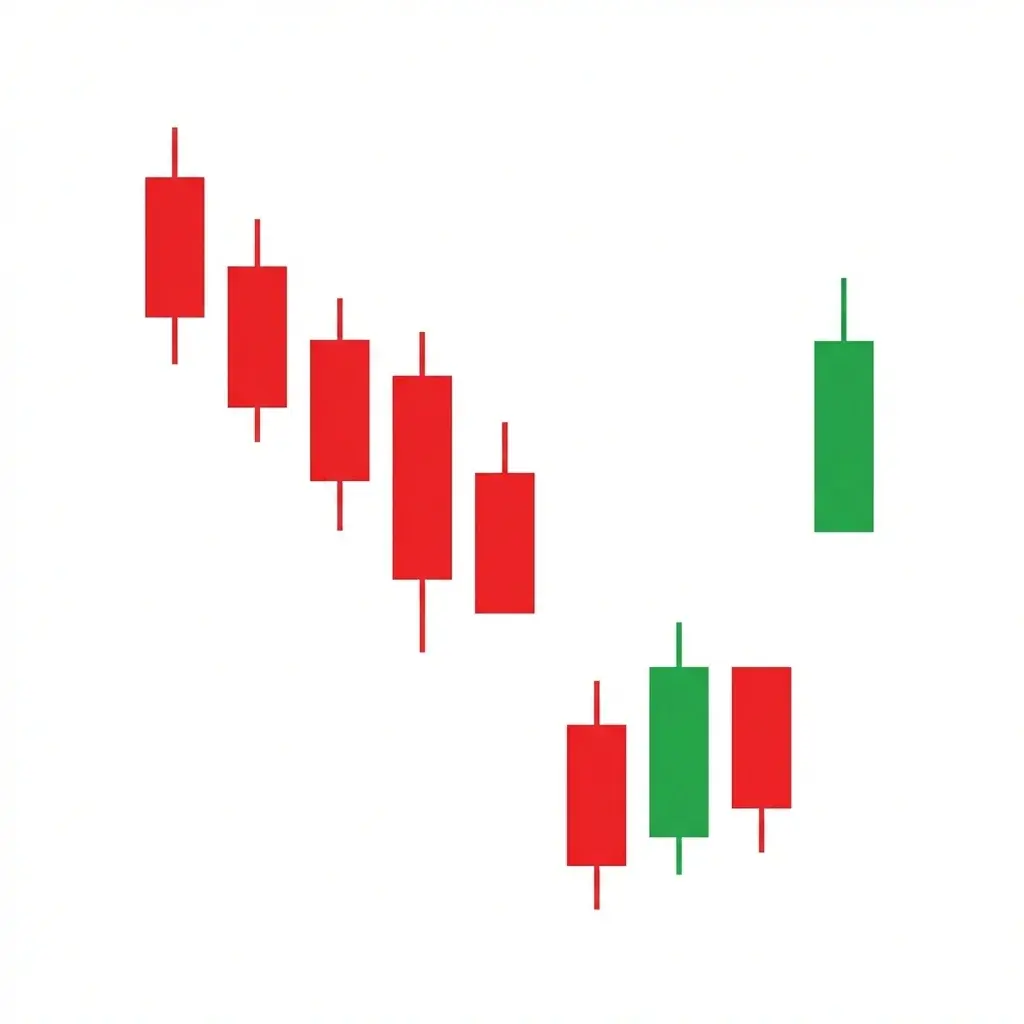
1. Bear Trap Pattern (Bullish)
What it looks like: Price breaks below a well-established support level, convincing traders that a breakdown is underway. Shorts pile in, stops on existing longs get triggered. Then, without warning, price reverses and rockets back above the broken support. The breakdown was a lie. The candle that breaks support often has a long lower wick, showing that sellers were absorbed by large institutional buy orders lurking below.
What it signals: A bear trap is one of the clearest signals of institutional accumulation. Smart money needs liquidity to build large positions, and they get that liquidity by triggering the sell stops clustered below support. Every retail stop loss that gets hit becomes a market sell order, and institutions are on the other side absorbing that selling. The more obvious the support level, the bigger the trap. This is liquidity engineering in its most naked form.
How to trade it: Never short a breakdown in isolation. Wait for confirmation. If price breaks below support but closes the candle back above it, that is your signal. The reclaim of the broken level is where you enter long, with your stop below the trap wick. Even better, wait for a retest of the support level from above after the reclaim. The risk-to-reward on a confirmed bear trap trade is exceptional because the stop is tight and the move can be explosive.
2. Bull Trap Pattern (Bearish)
What it looks like: Price punches through resistance with what appears to be strong momentum. Breakout traders rush in, buy stops get triggered above the level, and for a brief moment it looks like the resistance has been conquered. Then price stalls, reverses, and slams back below the broken resistance. The breakout candle often leaves a long upper wick, the scar of trapped buyers. This formation is closely related to patterns you may recognize from double tops and head and shoulders patterns.
What it signals: A bull trap signals institutional distribution. Large players need buyers to sell into, so they allow price to break above resistance to trigger the flood of buy orders from breakout traders and stop-loss orders from shorts. Once they have enough liquidity, they dump their positions. The more hyped the breakout level, the more effective the trap. Bull traps frequently occur at all-time highs, round psychological numbers, and well-publicized resistance zones where retail attention is highest.
How to trade it: The safest approach is to wait for the candle close. A breakout that closes back below resistance is not a breakout. It is a trap. Enter short on the close back below the level with your stop above the trap wick. Aggressive traders can look for rejection candles like shooting stars or bearish engulfing patterns at the resistance level as early entry signals. Volume divergence, where the breakout occurs on declining volume, is a powerful confirmation that the break lacks institutional backing.
The Dead Cat Bounce: The Cruelest Trap of All
The dead cat bounce is particularly devastating because it preys on hope. After a savage decline, traders desperately want to believe the bottom is in. The bounce looks real. The relief feels genuine. And then the floor drops out again.
3. Dead Cat Bounce (Bearish)
What it looks like: After a sharp sell-off, price bounces and recovers a portion of the decline, typically 20-40% of the prior move. The bounce can last anywhere from a few candles to several sessions, giving the illusion that the selling is over. Volume on the bounce is usually lower than the volume on the decline. The bounce often stalls at a prior support level that has now become resistance, or at a key moving average like the 20 or 50 period.
What it signals: The dead cat bounce is driven by short covering and bargain hunting, not genuine institutional buying. Shorts take profits after a big move, creating temporary buying pressure. Retail traders see the bounce and interpret it as a reversal, entering long positions. But the underlying selling pressure hasn't changed. The fundamental or technical reason for the decline is still intact. The bounce is simply a pause before the next leg down, and every buyer during the bounce becomes trapped.
How to trade it: The dead cat bounce is a shorting opportunity, not a buying opportunity. Wait for the bounce to stall at a logical resistance level, whether that is a prior support zone, a moving average, or a Fibonacci retracement level. Enter short when you see rejection at that level, confirmed by a bearish candle pattern. Your stop goes above the bounce high. The key filter is volume: if the bounce is happening on declining volume, it is almost certainly a dead cat. Real reversals require volume to confirm that institutional buyers have stepped in.
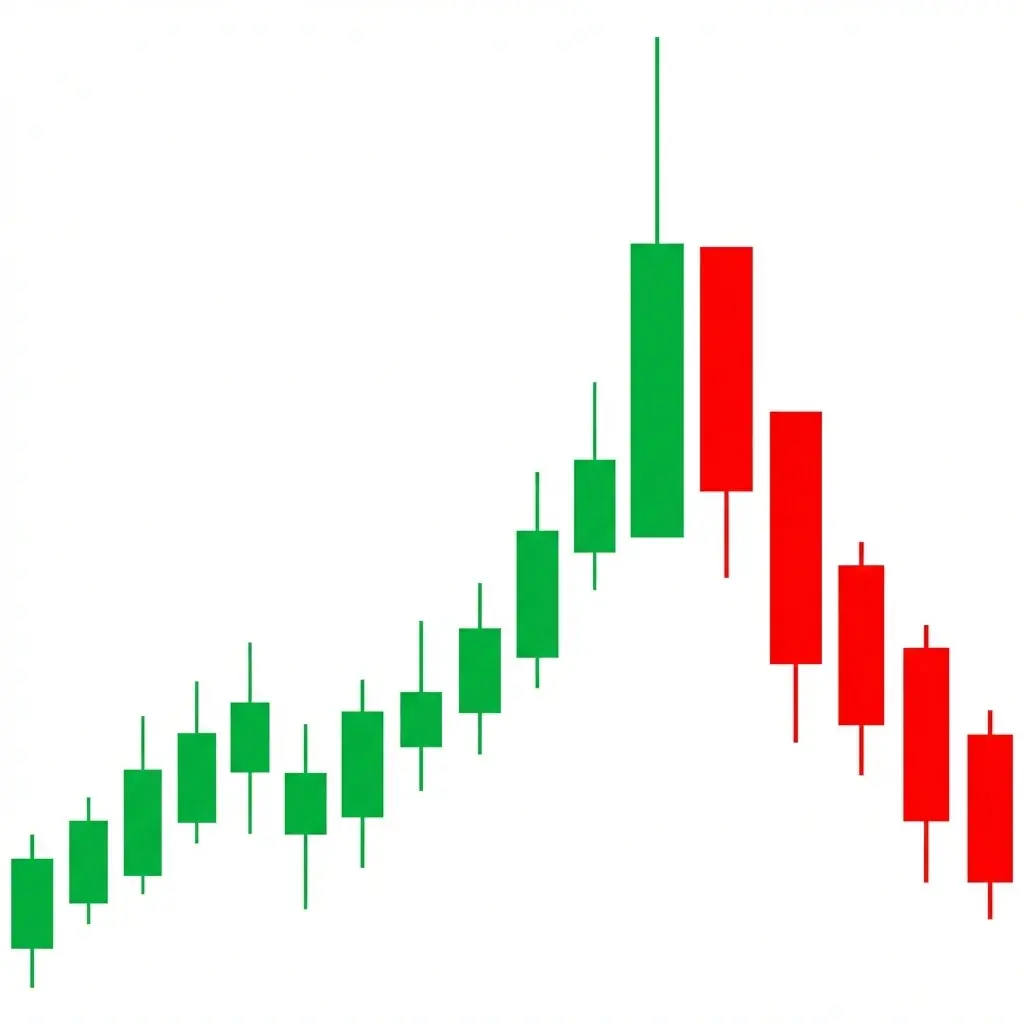
Climax Patterns: When Panic Creates Opportunity
Climax patterns occur at the exhaustion point of a trend, when emotion reaches its peak. Selling climaxes happen when panic selling reaches a crescendo and smart money steps in to absorb the liquidation. Buying climaxes occur when euphoria peaks and institutions begin unloading positions into the frenzy. These are some of the most powerful reversal signals in all of technical analysis because they mark the exact moment when one side of the market completely capitulates.
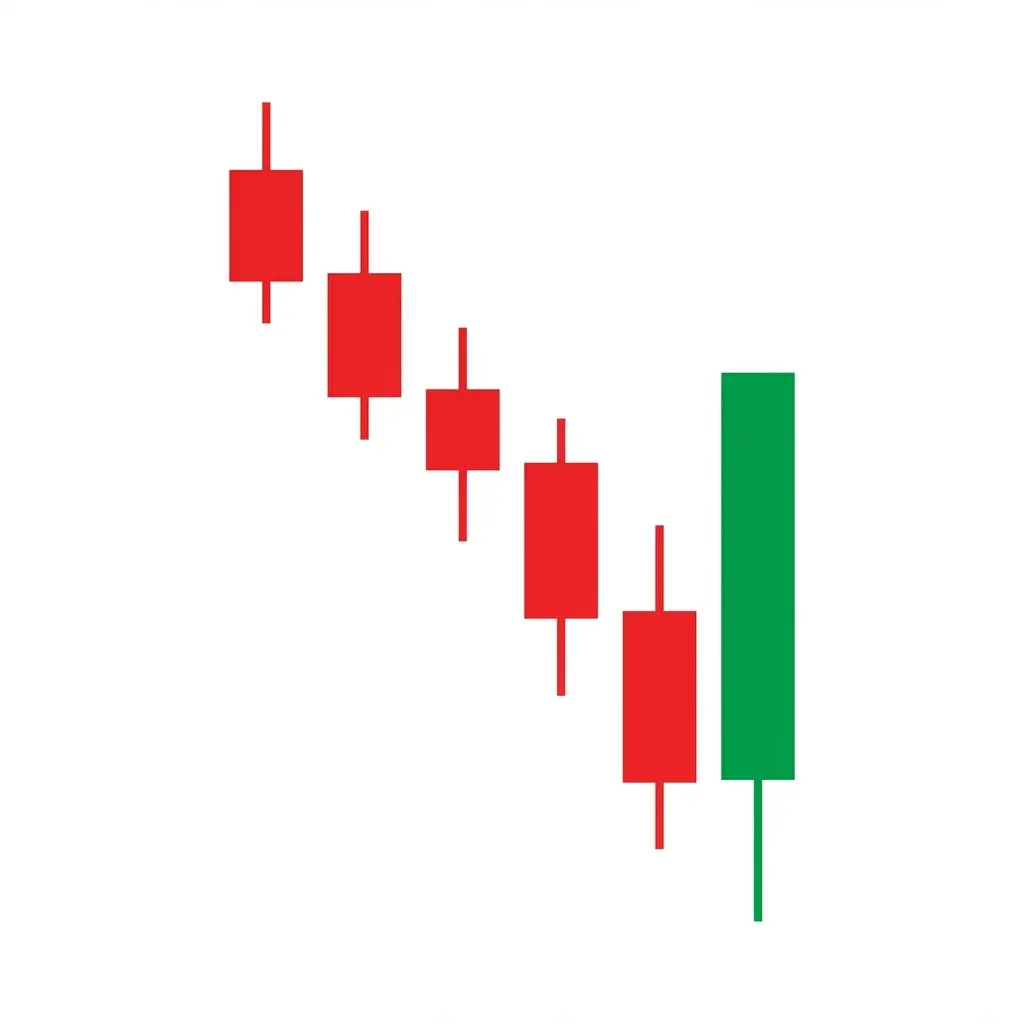
4. Selling Climax (Bullish)
What it looks like: After a prolonged downtrend, price drops sharply on dramatically increased volume, far higher than the average volume during the decline. The candle is wide-range and bearish, but often closes well off its lows, leaving a prominent lower wick. This wick is the footprint of institutional buyers absorbing the panic selling. The next candle is typically bullish, confirming that the climactic selling has been absorbed.
What it signals: A selling climax signals capitulation. The last holdouts, the traders who swore they would never sell, are finally throwing in the towel. Margin calls are forcing liquidations. Fear has reached its absolute peak. And this is precisely the moment when smart money is buying with both hands. The enormous volume spike is the key: it represents the transfer of positions from weak, panicked hands to strong, institutional hands. This is the market's version of blood in the streets.
How to trade it: Do not try to catch the exact bottom. Wait for the climax candle to complete and look for follow-through buying on the next candle. A strong bullish candle that closes above the midpoint of the climax candle is your entry signal. Place your stop below the low of the climax wick. The initial target is the beginning of the final sell-off leg. Keep in mind that after a selling climax, price often enters a trading range rather than immediately reversing into an uptrend, so be prepared to manage the position through consolidation.
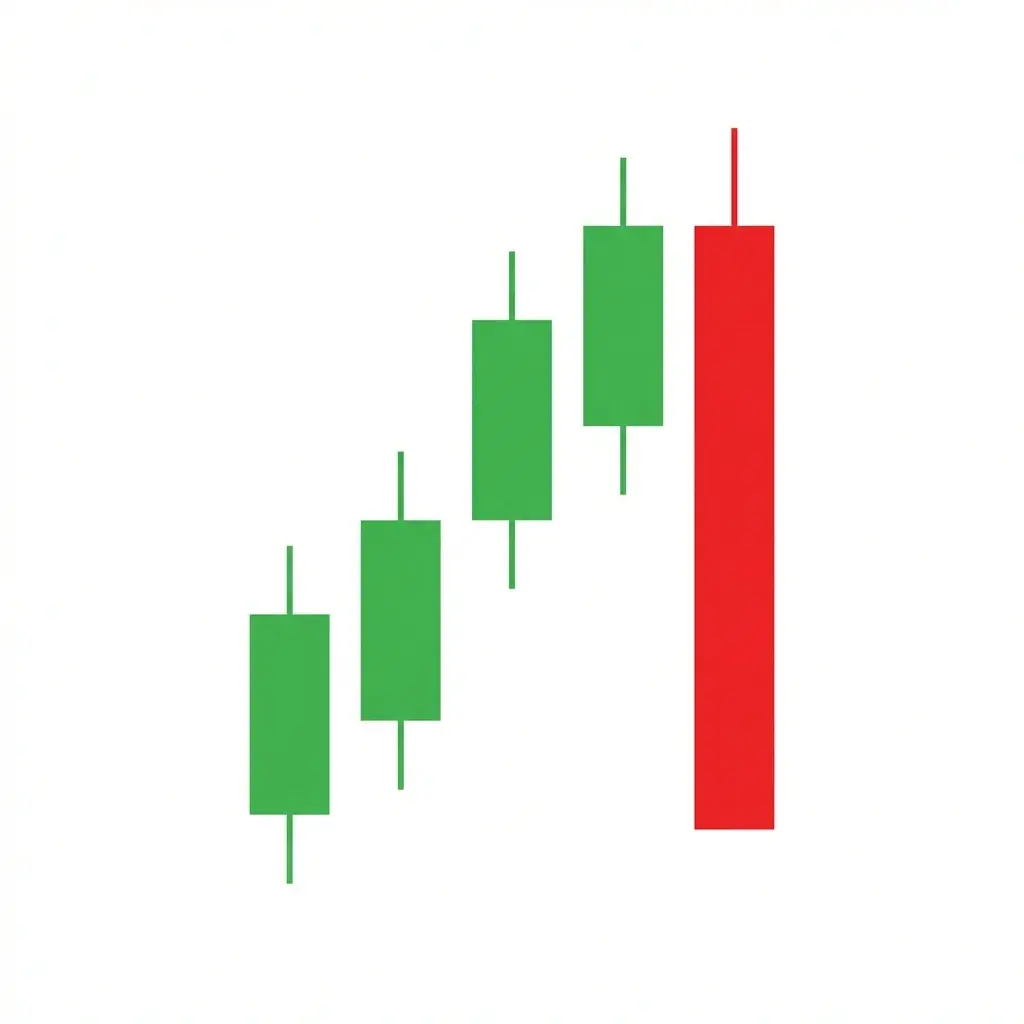
5. Buying Climax (Bearish)
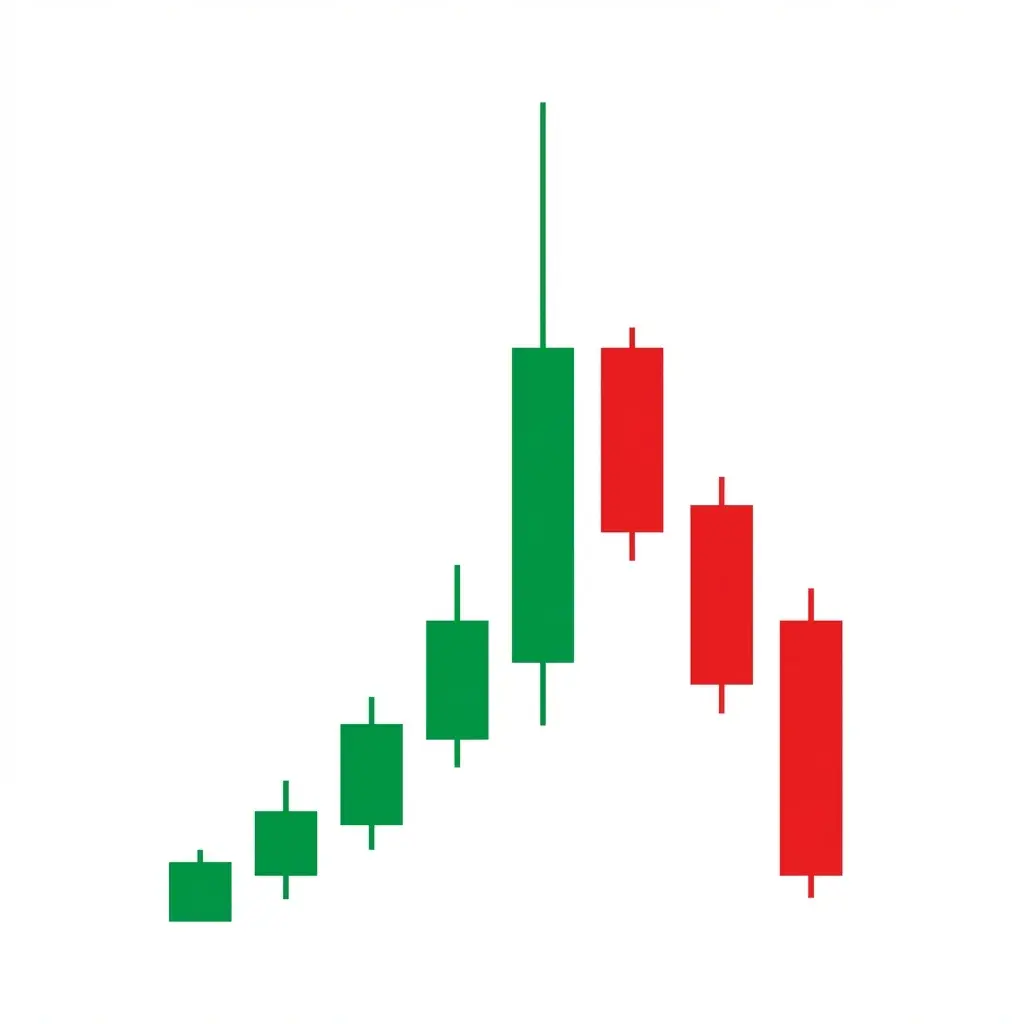
What it looks like: After an extended uptrend, price surges higher on a dramatic volume spike. The candle is wide-range and appears powerfully bullish, but closes well off its highs, leaving a long upper wick. This wick tells the story: institutions were selling into the euphoric buying. Headlines are bullish, social media is euphoric, and everyone who was waiting on the sideline is finally jumping in. That is the signal that the top is near.
What it signals: A buying climax is the mirror image of a selling climax. It represents peak euphoria, the moment when the last buyer has bought. FOMO is at its maximum. Retail traders who missed the entire move are finally entering, providing the liquidity that institutions need to distribute their accumulated positions. The volume spike is critical because it shows that selling pressure is meeting the buying wave. When buyers can no longer push price higher despite record volume, the trend is exhausted.
How to trade it: Wait for the climax candle to close and confirm with a bearish follow-through candle that closes below the midpoint of the climax bar. Enter short with your stop above the climax high. Do not front-run this pattern; euphoric moves can extend further than you think before they reverse. The best confirmation is when the following session gaps down or opens weak, proving that overnight sentiment has shifted. Like its bullish counterpart, a buying climax often leads to a trading range before a true downtrend develops.
Climax Reversals: The Decisive Turn
While a selling or buying climax shows exhaustion, a climax reversal goes one step further. It is the climactic move followed by an immediate, aggressive reversal in the opposite direction. There is no consolidation, no trading range. The market goes from full panic to full reversal in a single session. These are rare, but when they appear, they produce some of the most powerful and tradeable moves in all of price action.
6. Bullish Climax Reversal
What it looks like: Price opens or continues sharply lower in a climactic sell-off, often gapping down and trading to extreme lows. Then, within the same session, buyers overwhelm the sellers and price reverses all the way back to close near the session high. The resulting candle is a dramatic hammer or dragonfly doji with a massive lower wick, often the largest range candle on the chart. Volume is extraordinary, confirming the intensity of the battle between buyers and sellers.
What it signals: A bullish climax reversal signals that institutions have drawn a line in the sand. They used the panic selling to aggressively accumulate positions, and they were so aggressive that they not only absorbed all the selling but pushed price back to the highs. This is an extremely powerful signal because it combines capitulation with immediate reversal. It tells you that the balance of power has shifted decisively. The sellers have exhausted everything they had, and the buyers responded with overwhelming force.
How to trade it: Enter long on the close of the reversal candle or on the open of the next session. Your stop goes below the extreme low of the climax reversal candle. This is one of the few patterns where entering aggressively is justified because the signal is so powerful. The first target should be the origin of the sell-off that created the climax. If the reversal holds, it often becomes the starting point of a significant trend change, not just a bounce.
7. Bearish Climax Reversal
What it looks like: Price surges to new highs in a euphoric rally, often gapping up and trading to extreme highs. Then, within the same session, sellers overwhelm the buyers and price reverses to close near the session low. The resulting candle is a shooting star or gravestone doji with a massive upper wick. It is the most dramatic type of reversal candle because it shows that the highest point of euphoria was immediately rejected with extreme prejudice. Volume is exceptionally high throughout the session.
What it signals: This is the distribution event. Institutions used the euphoric buying, the FOMO, the stop-hunting above resistance, to unload massive positions. Every retail buy order that chased the move higher was met with institutional selling. The fact that price reversed so aggressively from the highs tells you that the selling was overwhelming and deliberate. When this pattern appears after an extended uptrend, it frequently marks the exact top.
How to trade it: Enter short on the close of the reversal candle or on the open of the next session. Your stop goes above the extreme high of the climax candle. Target the origin of the final rally leg. Be aware that after a bearish climax reversal, the next few sessions often see violent moves in both directions as trapped longs try to exit and new shorts press their advantage. Position size conservatively and let the trade develop.
Island Reversals: Stranded on the Wrong Side
Island reversals are among the most powerful reversal patterns in technical analysis, yet many traders have never heard of them. They form when price gaps away from the prevailing trend, trades in isolation for one or more sessions, and then gaps back in the opposite direction, leaving a "island" of price action stranded with gaps on both sides. Everyone who traded during that island is now trapped with no nearby support or resistance to lean on. These patterns are most common in stocks and indices where gaps occur regularly, but they also appear in forex around major news events.
8. Bullish Island Reversal
What it looks like: During a downtrend, price gaps down sharply, trades for one or more sessions at the lower level, and then gaps up equally sharply, leaving the low-price sessions isolated as an "island" with unfilled gaps on both sides. The gap down represents the final wave of panic selling, and the gap up represents the sudden shift in sentiment as buyers take control. The island itself is where the last bears entered and the first bulls accumulated.
What it signals: A bullish island reversal is one of the highest-probability bullish signals in all of charting. The gap down showed that selling pressure was extreme enough to create a price vacuum, but the gap back up proved that the selling was completely exhausted. Every short who entered during the island is now trapped below two gaps with no way to exit without significant loss. The pattern signals a decisive and likely sustained shift from selling to buying pressure.
How to trade it: Enter long immediately when the gap up is confirmed on the open of the new session. Your stop goes below the low of the island. The target should be at least the origin of the downtrend that led to the island formation. Because island reversals are such high-conviction signals, many traders use larger position sizes than normal. The key rule is that the gaps must remain unfilled. If price comes back to fill the gap up, the island reversal has failed and you should exit immediately.
9. Bearish Island Reversal
What it looks like: During an uptrend, price gaps up sharply, trades for one or more sessions at the elevated level, and then gaps down sharply, leaving the high-price sessions stranded as an island. The gap up represents the final burst of euphoria, and the gap down represents the sudden reversal in sentiment. The candles on the island often show indecision such as dojis, spinning tops, or small-bodied candles, hinting that conviction at those elevated prices was already wavering.
What it signals: A bearish island reversal signals that the last buyers have been lured in and abandoned. The gap up attracted the final wave of FOMO buyers, and the gap down stranded them at the highest prices with no support beneath them. Institutional distribution was completed during the island sessions, and the gap down is the result of the demand vacuum left behind. This pattern is especially powerful when it occurs after a prolonged uptrend or at all-time highs.
How to trade it: Enter short on the confirmation of the gap down. Your stop goes above the high of the island. Target the beginning of the rally that preceded the island formation. As with the bullish version, the gaps must remain unfilled for the pattern to remain valid. A bearish island reversal at the top of an extended uptrend is one of the strongest sell signals you will ever see. Treat it with the urgency it deserves.
Key Reversals: The Single-Bar Warning Shot
A key reversal is a single-bar pattern that condenses the entire story of a trend exhaustion into one candle. It makes a new extreme in the direction of the trend, then reverses and closes beyond the prior bar's close in the opposite direction. It is the market's way of saying: we tested the extreme, and it was emphatically rejected. Key reversals are most significant on daily and weekly timeframes, and they carry the most weight when they occur on elevated volume.
10. Bullish Key Reversal
What it looks like: During a downtrend, a single bar opens lower or gaps down, trades to a new low below the prior bar's low, and then reverses intraday to close above the prior bar's close. The result is a wide-range bar with a strong close that engulfs the prior session. It looks like the market tried to continue the downtrend, found overwhelming buying interest at the new low, and was pushed all the way back. The wider the range of the key reversal bar and the higher it closes relative to its range, the more powerful the signal.
What it signals: A bullish key reversal is the market testing the bears' resolve and finding it lacking. The new low attracted the last wave of short sellers and triggered stops, but buyers absorbed everything and then some. The close above the prior bar proves that buying pressure overwhelmed selling pressure decisively within a single session. It is one of the most reliable single-bar reversal signals, especially when confirmed by a volume spike and when occurring at a logical support zone.
How to trade it: Enter long on the close of the key reversal bar or at the open of the following session. Place your stop below the low of the key reversal bar. The immediate target is the high from which the most recent decline began. For additional confirmation, look for the following session to trade entirely above the key reversal bar's close, proving that the reversal has follow-through. Key reversals on the weekly chart are especially significant and can mark major trend turning points.
11. Bearish Key Reversal
What it looks like: During an uptrend, a single bar opens higher or gaps up, trades to a new high above the prior bar's high, and then reverses intraday to close below the prior bar's close. It is the ultimate rejection candle. The market reached for new highs, and the response was an overwhelming wave of selling that drove price all the way back and then some. When this bar has the widest range on the chart and occurs on the highest volume, you are looking at a potential major top.
What it signals: A bearish key reversal signals distribution in its most compressed form. Institutions used the new high to complete their selling, and there were not enough buyers left to sustain the elevated prices. The close below the prior bar is the definitive statement: the trend has changed. This pattern is particularly dangerous for longs when it occurs after an extended rally because the trapped buyers above have no support to lean on, and the selling can cascade as longs scramble to exit.
How to trade it: Enter short on the close of the key reversal bar or at the open of the following session. Place your stop above the high of the key reversal bar. Target the low from which the most recent rally leg began. If you are already long, a bearish key reversal on elevated volume is a clear signal to exit immediately. Do not wait for further confirmation. The traders who hesitate on this signal are the ones who ride the position all the way back down to breakeven or worse.
The Last Kiss: The Retest That Confirms Everything
The last kiss is the most elegant trap pattern because it gives traders a second chance to get on the right side of a move, and most of them use that second chance to get on the wrong side instead. It occurs when price breaks through a level, pulls back to retest it, and the retest confirms the break. The "kiss" of the old level is the final goodbye before price moves decisively in the breakout direction.
12. Bullish Last Kiss
What it looks like: Price breaks above a significant resistance level with conviction, then pulls back to retest the broken resistance from above. The pullback touches or slightly penetrates the level, which now acts as support, and then bounces higher. The retest candle often forms a bullish rejection pattern like a hammer, pin bar, or bullish engulfing pattern right at the level. Volume typically declines on the pullback and expands on the bounce, confirming that the pullback is corrective and the breakout direction is genuine.
What it signals: The last kiss is the market confirming that the old resistance has been converted to new support. This is one of the most fundamental concepts in technical analysis: the polarity principle. What was once a ceiling becomes a floor. The pullback to the level shakes out weak hands who bought the breakout with tight stops, and it allows new buyers to enter at a better price. When the level holds, it proves that the breakout is legitimate and traps any shorts who faded the breakout expecting it to fail.
How to trade it: The last kiss is arguably the highest probability entry technique in trading. Wait for the pullback to the broken level and enter long when you see a bullish rejection candle at that level. Your stop goes below the retest low, which gives you an extremely tight stop relative to the potential move. The target is the measured move from the breakout: take the height of the range or pattern that price broke out of and project it from the breakout point. This pattern works on every timeframe, and combining it with the concepts from breakout patterns like flags and pennants makes it even more powerful.
How to Protect Yourself from Traps and Fakeouts
Knowing the patterns is half the battle. The other half is developing the discipline to act on that knowledge even when your emotions are screaming at you to chase. Here are the principles that separate trap victims from trap traders.
Wait for the Candle Close
This single rule will save you from the majority of traps. A breakout is not confirmed until the candle closes beyond the level. Wicks beyond levels are traps. Closes beyond levels are breakouts. Train yourself to wait for the close no matter how exciting the move looks intraday. The few times you miss a real breakout by waiting are far outweighed by the hundreds of traps you avoid.
Use Higher Timeframes for Confirmation
A breakout on the 5-minute chart that contradicts the daily trend is almost always a trap. Always check at least one timeframe higher than your trading timeframe. If the daily trend is bearish, that bullish breakout on the 1-hour chart is likely a dead cat bounce or a bull trap. The higher timeframe is the truth. Lower timeframes are just noise within that truth.
Watch Volume Like Your Account Depends on It
Real breakouts are accompanied by expanding volume. Fake breakouts occur on average or declining volume. This is the single most reliable filter for distinguishing traps from genuine moves. If price breaks a major level and volume does not spike, be suspicious. The absence of volume on a breakout is the market whispering that the move is a lie.
Never Chase a Move
If you missed the entry, you missed it. The market will present another opportunity. Chasing is the number one way traders walk into traps because the urgency you feel is manufactured. That powerful move that makes you feel like you have to get in right now is precisely the move that is designed to suck you in before reversing. Wait for a pullback, a retest, or the next setup. Patience is the ultimate trap avoidance tool.
Think Like the Trap Setter, Not the Victim
Before every trade, ask yourself: where are the obvious stops? If you can see where retail traders have placed their stops, so can institutions. If your entry is right where everyone else's stop is, you are the liquidity, not the trader. The best entries are after the trap has sprung, not before. Let the trap trigger, wait for the reversal, and then enter with the smart money.
The ultimate irony of trap patterns is that once you learn to see them, they become your highest-probability trades. The same patterns that destroyed your account when you were the victim become your best setups when you learn to trade the reversal. Every trap has a trapped side and a winning side. Your job is to always be on the winning side.
Frequently Asked Questions
What is a bull trap in trading?
A bull trap is a false breakout above a resistance level that lures buyers in before price reverses sharply downward. It occurs when price briefly breaks above resistance with apparent conviction, triggering buy orders and stop losses, then reverses and closes back below the level. Bull traps are often engineered by institutional traders to generate liquidity for large sell orders.
How do you identify a bear trap before it reverses?
A bear trap can be identified by watching for a false breakdown below support that occurs on low or declining volume, followed by a quick recovery back above the support level. Key warning signs include divergence on RSI or MACD during the breakdown, long lower wicks on candles below support, and the breakdown occurring during low-liquidity sessions. Waiting for a confirmed close back above the broken level is the safest way to confirm the trap.
What is the difference between a dead cat bounce and a real reversal?
A dead cat bounce is a temporary recovery in a downtrend caused by short covering and bargain hunting, not genuine buying interest. Unlike a real reversal, a dead cat bounce typically occurs on declining volume, fails to reclaim key moving averages or resistance levels, and retraces only 20-40% of the prior decline. A real reversal shows increasing volume on up moves, reclaims broken support levels, and forms higher lows.
How do institutional traders create traps and fakeouts?
Institutional traders create traps by pushing price through obvious support or resistance levels where retail stop losses cluster. They use large orders to trigger these stops, generating the liquidity they need to fill their actual positions in the opposite direction. This is known as stop hunting. For example, institutions may drive price below a well-known support level to trigger sell stops, absorb all that selling, and then reverse the market higher with their accumulated long positions.
What is the best way to avoid getting trapped by false breakouts?
The best ways to avoid false breakout traps include: waiting for a confirmed candle close beyond the breakout level rather than entering on the initial break, using higher timeframes to confirm the direction, watching volume for confirmation since real breakouts have increasing volume, avoiding entries at obvious support and resistance levels where stops cluster, and using the retest of the breakout level as your entry point rather than chasing the initial move.
Stop Being Exit Liquidity
Look, we've all been there. You see a breakout, you jump in, and 10 minutes later you're stopped out watching price reverse exactly where you entered. That's not bad luck - that's the game working as designed. The sooner you accept that traps are a feature of markets and not a bug, the sooner you can start trading them instead of falling for them.
Pull up any chart right now. Find last week's biggest move. Now look at what happened right before it. Bet you'll find a trap. They're always there.
Tired of getting faked out?
ChartSnipe spots traps, fakeouts, and real setups so you don't have to guess.
Try ChartSnipe freeGoes well with: Smart Money Concepts · Classic Reversal Patterns