Best AI Trading Chart Analysis Software in 2026
How AI-powered chart analysis is transforming the way traders identify patterns, generate signals, and make better trading decisions.

Finding the right chart analysis software can make the difference between profitable trading and costly mistakes. In 2026, artificial intelligence has revolutionized how traders analyze charts, detect patterns, and make decisions. Gone are the days of spending hours staring at charts trying to identify formations—modern AI does it in seconds.
ChartSnipe has emerged as the leading AI-powered chart analysis platform, and in this article we'll show you exactly why it's become the go-to tool for traders worldwide.
What Makes Great Chart Analysis Software
Before diving into features, let's understand what separates exceptional chart analysis software from mediocre options:
Pattern Recognition Accuracy
Reliably identify 50+ chart patterns including double tops, head and shoulders, triangles, and more
Lightning-Fast Analysis
Manual analysis takes hours; AI delivers comprehensive results in under 3 seconds
Works With Any Chart
Accept screenshots from TradingView, MT4, or any platform—with or without indicators
Actionable Trading Signals
Clear BUY/SELL recommendations with entry points, stop losses, and take profit targets
Multiple Analysis Modes
Different trading styles require different approaches—choose from 6 specialized modes
ChartSnipe excels in all these areas, which is why it's become the preferred choice for traders in 2026.
Multiple Analysis Modes for Every Strategy
One size doesn't fit all in trading. That's why ChartSnipe offers 6 specialized analysis modes, each designed for different trading styles and objectives.

Quick Snipe
Fast pattern identification and directional bias for quick decisions
S&R Levels
Detailed support and resistance analysis with key price levels
Full Snipe
Complete pattern analysis with entry points and educational insights
Liquidity Snipe
Identifies institutional activity and liquidity zones
Beat Another
Compare your analysis against the AI for validation and learning
Custom Mode Creator
Build your own analysis mode tailored to your specific strategy
Works With or Without Technical Indicators
A major advantage of ChartSnipe is its flexibility. Whether you prefer clean price action charts or charts loaded with indicators like VWAP, moving averages, and RSI—the AI adapts and delivers accurate analysis.

Price rejection at resistance with bearish momentum building below VWAP. The AI provides clear directional bias with reasoning.
Liquidity Snipe Mode: Institutional Analysis on Clean Charts
For traders who prefer clean price action charts, ChartSnipe's Liquidity Snipe mode provides institutional-level analysis without requiring any indicators. This mode focuses on identifying where "smart money" is likely positioned and where liquidity sweeps occur.

In this example, Liquidity Snipe detected a Failed Breakout Liquidity Sweep - Distribution Phase. The AI identified that price swept above 6,947 grabbing retail short stops, then immediately rejected with strong bearish candles. Key metrics include:
- Timing: Immediate — The setup is actionable right now
- Setup Quality: HIGH — Strong probability setup
- Setup Rating: 8/10 — Quantified confidence score

Part 2 of the Liquidity Snipe analysis reveals the institutional perspective:
- Stops Above/Below — Where retail stop losses are clustered (liquidity targets)
- Liquidity Sweep Detected — Confirms an upside sweep at 6,947 grabbed stops
- Entry, Stop Loss & Take Profits — Complete trade plan with multiple TP levels and risk-reward ratios
- Institutional Activity — Smart Money Bias: BEARISH with detailed manipulation signals
The Manipulation Signals section explains exactly how institutions engineered the move: triggering breakout buyers and short stops, then aggressively selling into that liquidity. This level of institutional analysis is typically only available to professional traders.
Instant AI Pattern Detection
ChartSnipe's AI can identify 50+ chart patterns in seconds, including:
- Double Tops and Double Bottoms
- Triple Tops and Triple Bottoms
- Head and Shoulders (and Inverse)
- Ascending and Descending Triangles
- Wedges (Rising and Falling)
- Flags and Pennants
- Cup and Handle formations
- Channel breakouts
- And many more...

Notice how ChartSnipe doesn't just identify the pattern—it provides actionable trading recommendations with clear reasoning. In this example, it detected a Triple Bottom Reversal with Bullish Breakout and recommended a BUY, explaining that buyers are stepping in with conviction at the breakout zone.
Full Snipe Mode: Complete Analysis Walkthrough
What truly sets ChartSnipe apart is the depth of analysis provided in Full Snipe mode. Unlike simple pattern scanners that give you a signal and nothing else, Full Snipe delivers a comprehensive 3-part analysis that educates you while providing actionable trade setups. Let's walk through two complete examples.
Full Snipe provides 3 parts: Pattern Detection → Chart Sentiment & Entry Analysis → Risk-Reward & Trade Levels
Example 1: Bullish Setup (Triple Bottom Reversal)
This analysis was performed using Full Snipe mode on a USD/JPY chart, demonstrating how the AI identifies bullish reversal patterns and builds a complete trading plan.
Part 1: Pattern Detection & Trading Signal
The AI immediately identifies the Triple Bottom Reversal with Bullish Breakout pattern. It doesn't just name the pattern—it explains what's happening: "Buyers are stepping in with conviction at the breakout zone. Watch for continuation above recent highs." This context helps traders understand the market dynamics, not just follow signals blindly.
Part 2: Chart Sentiment & Entry Zone Analysis
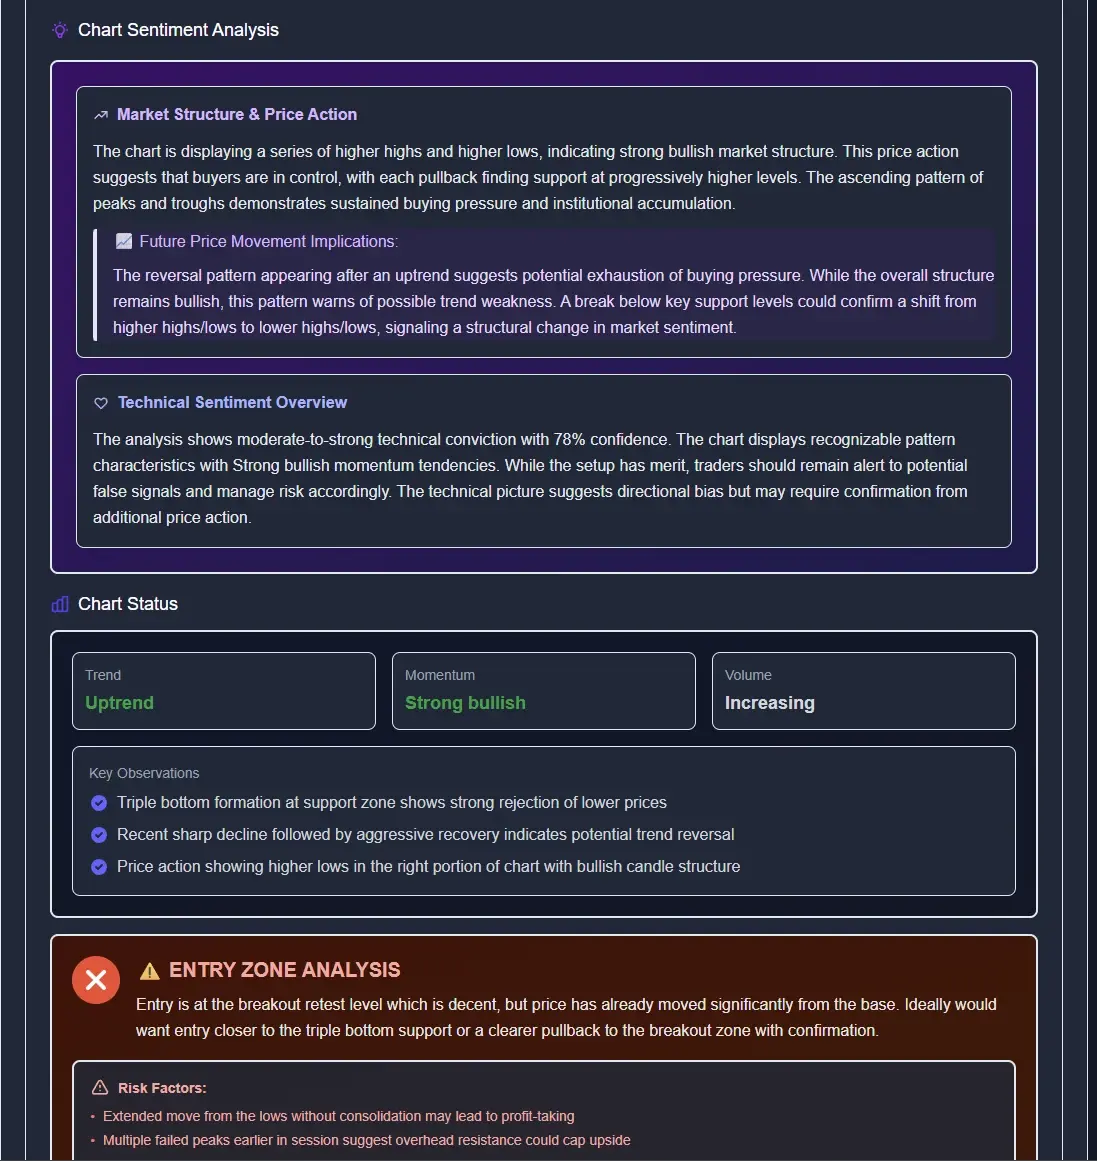
Part 2 dives deeper with Chart Sentiment Analysis. Here you see:
- Market Structure & Price Action — The AI explains the bullish reversal with higher lows forming
- Technical Sentiment Overview — A clear 78% confidence score with bullish bias
- Chart Status — Quick visual indicators showing Uptrend, Strong bullish momentum, and Increasing volume
- Key Observations — Highlights triple bottom support, breakout confirmation, and momentum shift
- Entry Zone Analysis — In this case, the AI marks it as "Not Recommended" entry zone with specific risk factors
This is a critical feature: Even though the pattern is bullish and the signal is BUY, the AI evaluates whether the current price level offers a good entry. In this example, it determined the entry zone isn't optimal—perhaps price has already moved too far from ideal entry, or risk factors are elevated. ChartSnipe doesn't blindly recommend every trade; it helps you avoid poor entries.
Part 3: Risk-Reward & Trade Levels
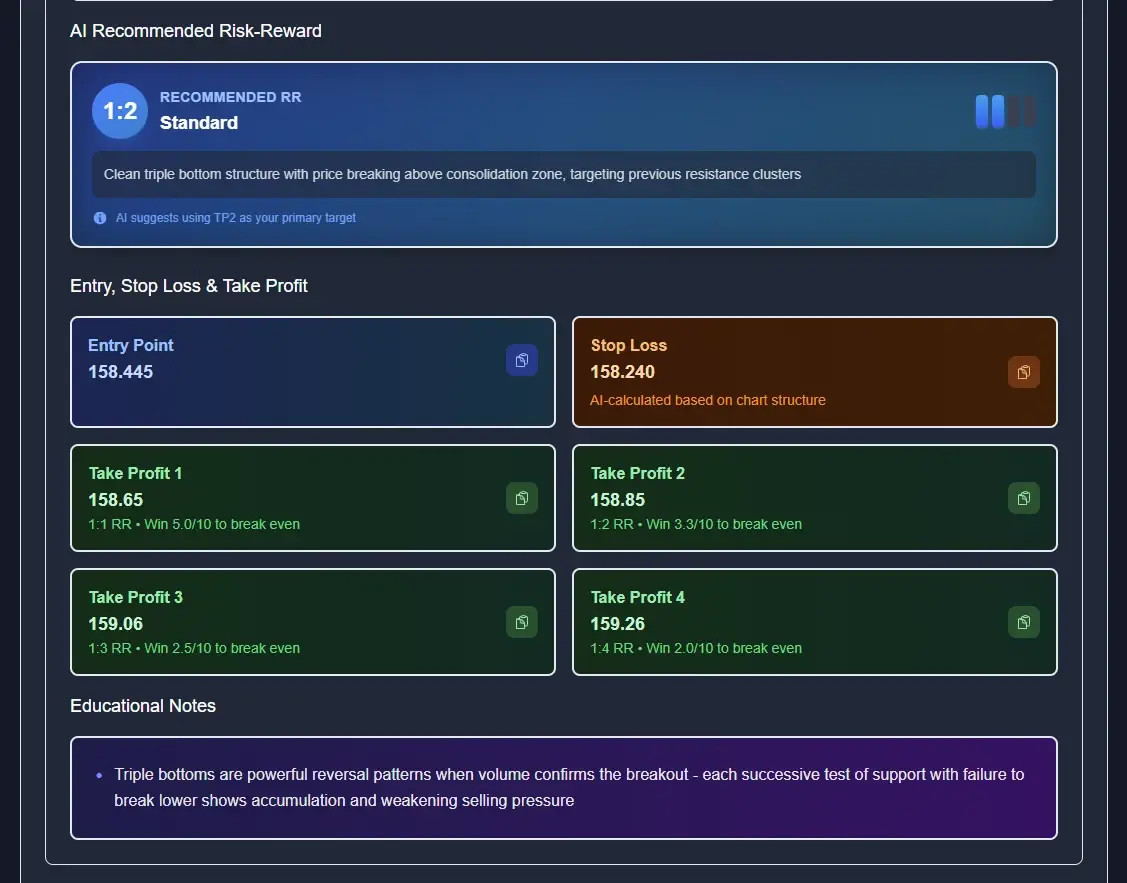
The final part delivers the complete trade plan:
- AI Recommended Risk-Reward — 1:2 Standard ratio with clear justification
- Precise Entry Point — 158.445 with reasoning
- Stop Loss Level — 158.240 placed below the pattern structure
- Multiple Take Profit Levels — TP1 through TP4 for partial profit-taking strategy
- Educational Notes — Insights about triple bottom patterns, historical success rates, and best practices
The educational notes at the bottom teach you about the pattern itself—this is what makes ChartSnipe a learning tool, not just a signal generator.
Example 2: Bearish Setup (Double Top Formation)
Now let's see how Full Snipe handles a bearish setup. This analysis was performed on a chart showing a potential reversal to the downside.
Part 1: Pattern Detection & Trading Signal
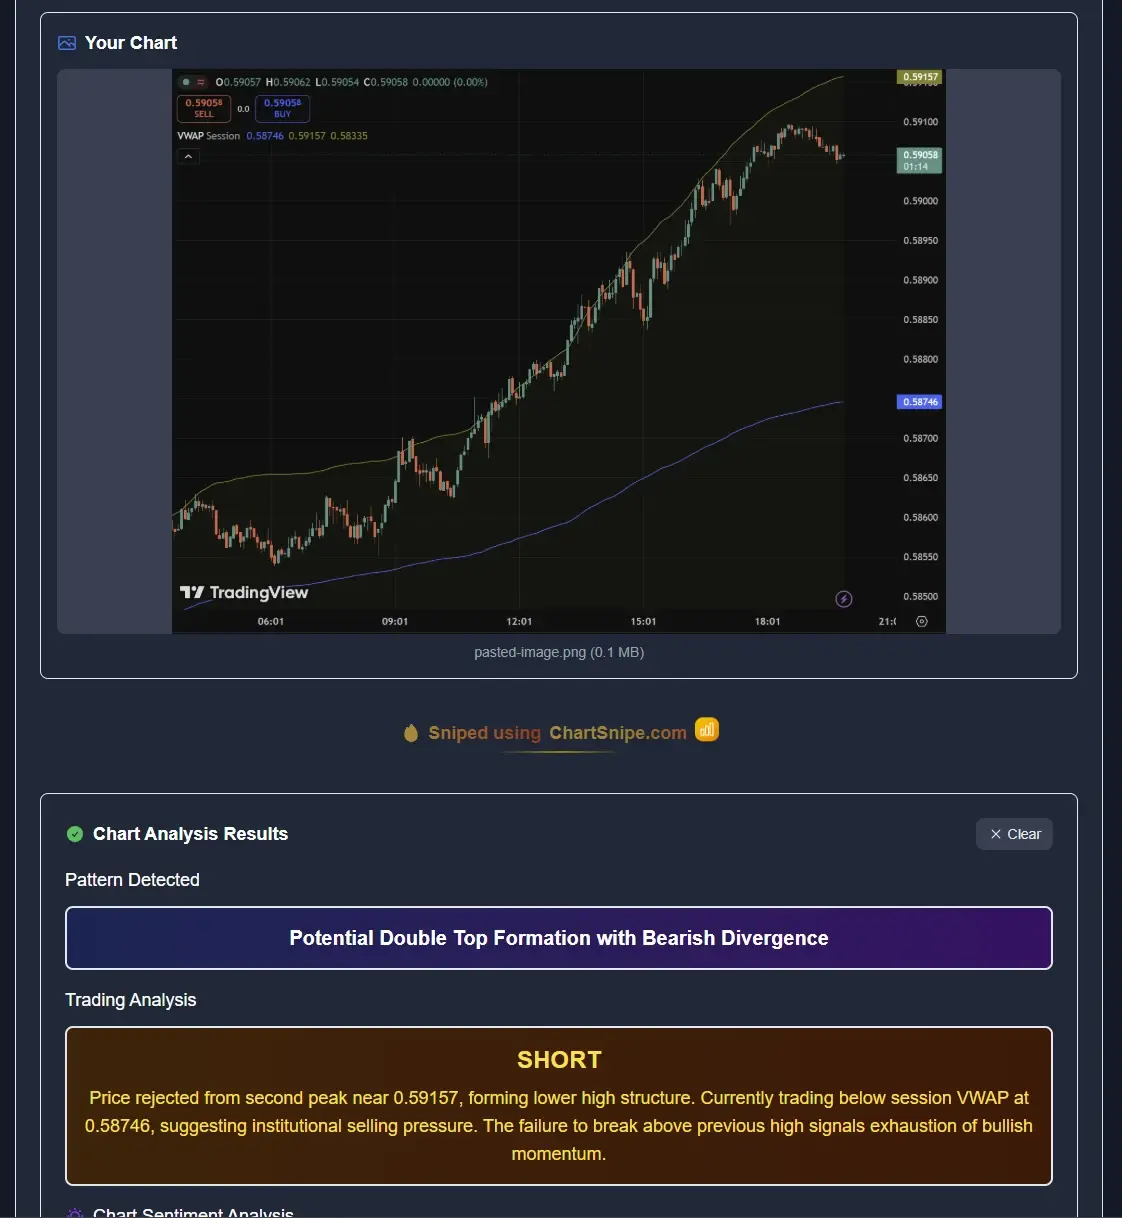
The AI detects a Potential Double Top Formation with Bearish Divergence. Notice how it provides context: it identifies the pattern, explains the significance (price failing to make new highs), and recommends a SHORT position. The analysis notes the bearish divergence confirming weakening momentum.
Part 2: Chart Sentiment & Entry Zone Analysis
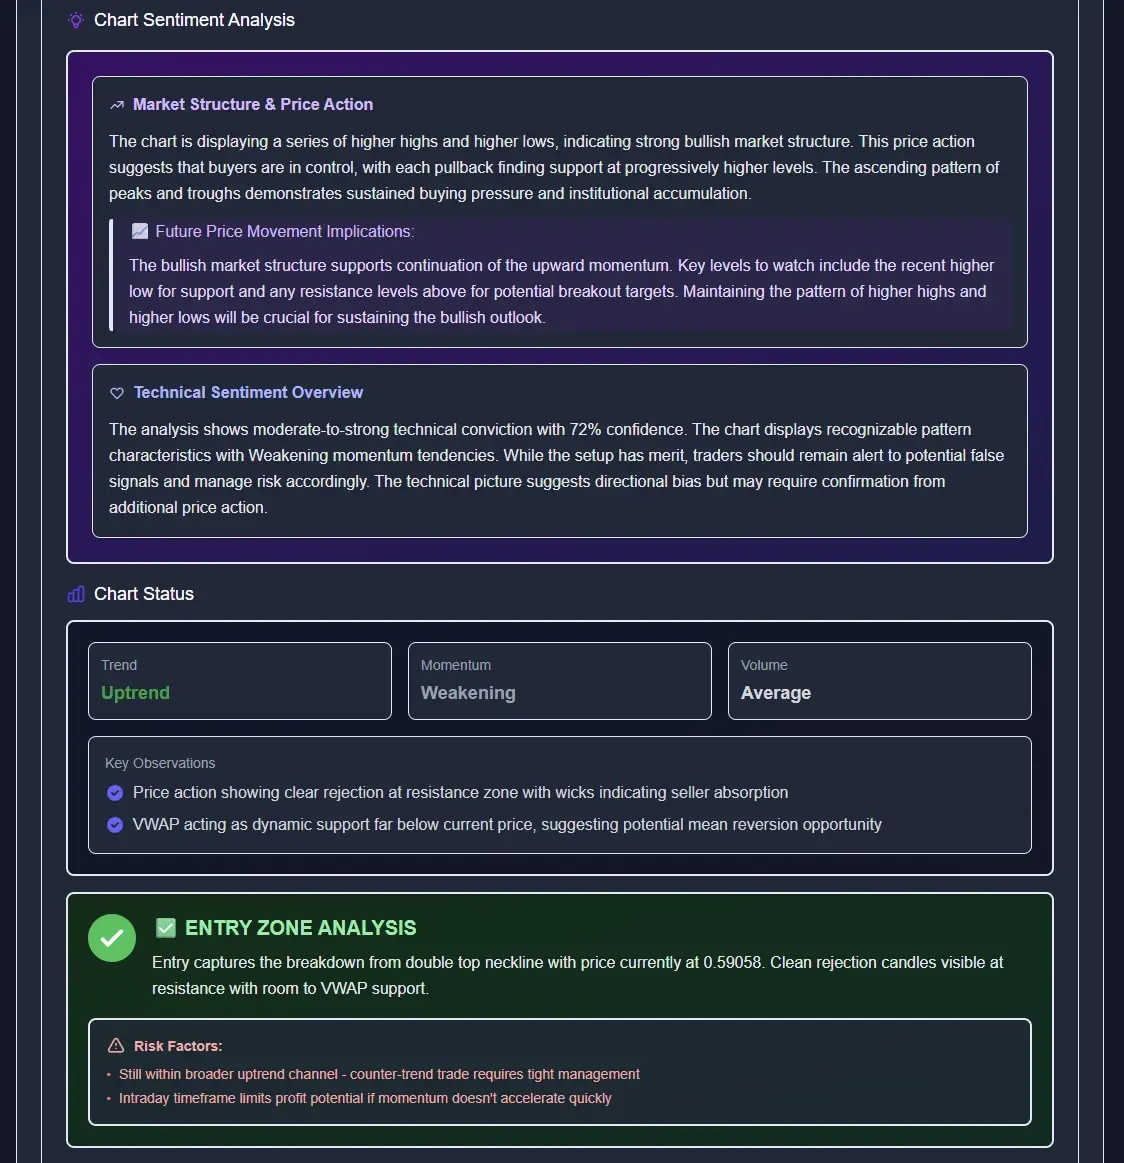
Part 2 reveals the bearish setup in detail:
- 72% Confidence Score — Bearish bias with clear reasoning
- Weakening Momentum — The AI identifies momentum loss at resistance
- VWAP Analysis — Notes price behavior around the Volume Weighted Average Price
- Entry Zone — Unlike the first example, here the AI recommends the entry zone as favorable for a short position
Notice the difference from Example 1: here the AI actually recommends taking the trade at current levels. This demonstrates ChartSnipe's nuanced approach—it won't recommend every trade just because a pattern exists. The AI evaluates whether current conditions favor entry, helping you avoid chasing bad setups.
Part 3: Risk-Reward & Trade Levels
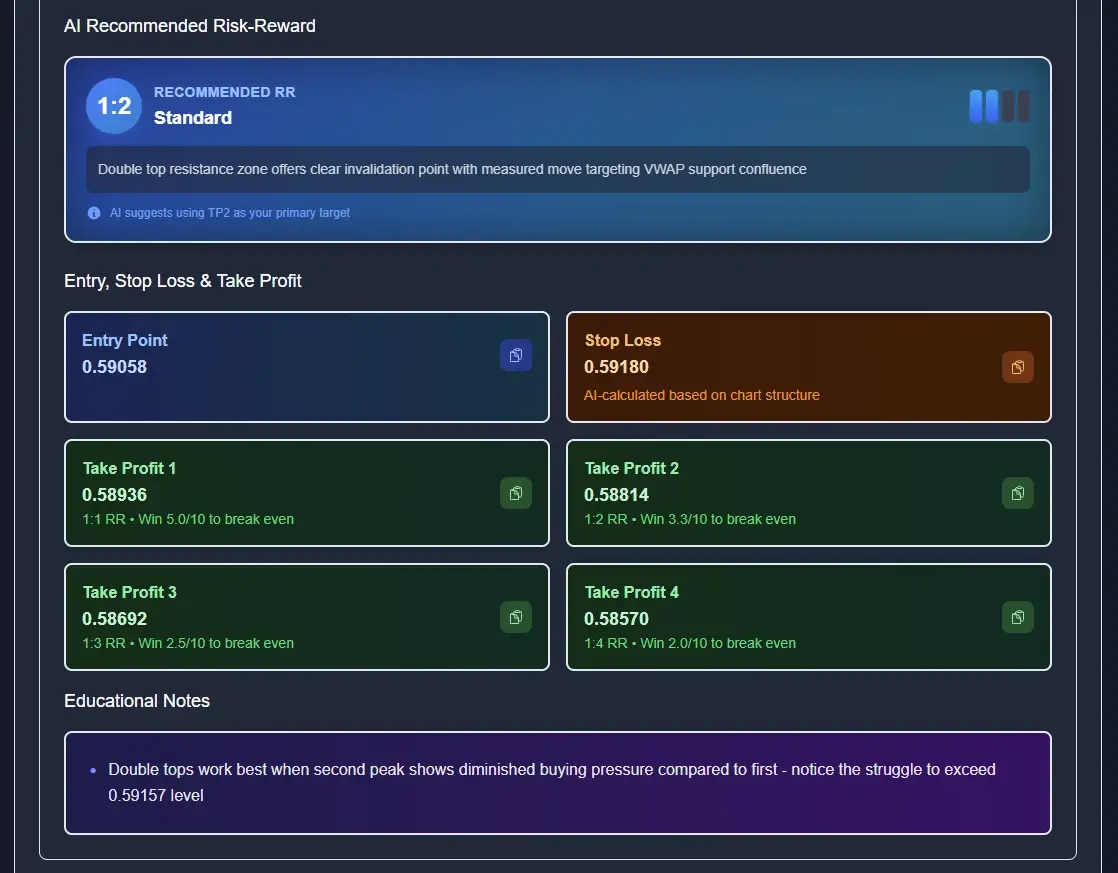
The trade plan for this short setup includes:
- Entry Point — Precise level for short entry
- Stop Loss — Placed above the double top resistance to protect against invalidation
- Take Profit Levels — Multiple targets for scaling out of the position
- Educational Notes — Insights about double top patterns, what to watch for, and historical behavior
Why Full Snipe Mode is Unique
Most chart analysis tools stop at pattern detection. ChartSnipe's Full Snipe mode goes further by providing complete trade plans with education. You don't just get a signal—you understand the market structure, sentiment, risk-reward, and the pattern itself.
Crucially, ChartSnipe doesn't always recommend a trade. As shown in Example 1, even when a valid pattern exists, the AI may determine the entry zone isn't favorable. This honest evaluation prevents you from chasing poor setups and makes you a better trader over time.
Built-in Trading Tools
Beyond chart analysis, ChartSnipe includes essential trading utilities to help you manage risk and calculate potential profits.

- Position Size Calculator — Calculate proper position sizes based on your account balance and risk percentage
- Profit Calculator — Quickly determine potential profit at different take-profit levels
- Analysis History — Review all your past analyses to track patterns and improve your trading
- Trading Quiz — Free pattern recognition practice to sharpen your skills (unlimited and free for all users)
AI News Impact Analysis
A unique feature that sets ChartSnipe apart is the daily AI News Impact Analysis. Every trading day, the AI analyzes how economic news, central bank decisions, and market events affect 15 major trading instruments. This gives you the fundamental context you need before making technical trading decisions.
Part 1: 15 Instrument Analysis Cards
The News Impact dashboard presents 15 trading instrument cards, each showing the AI's directional bias based on that day's news and economic events.
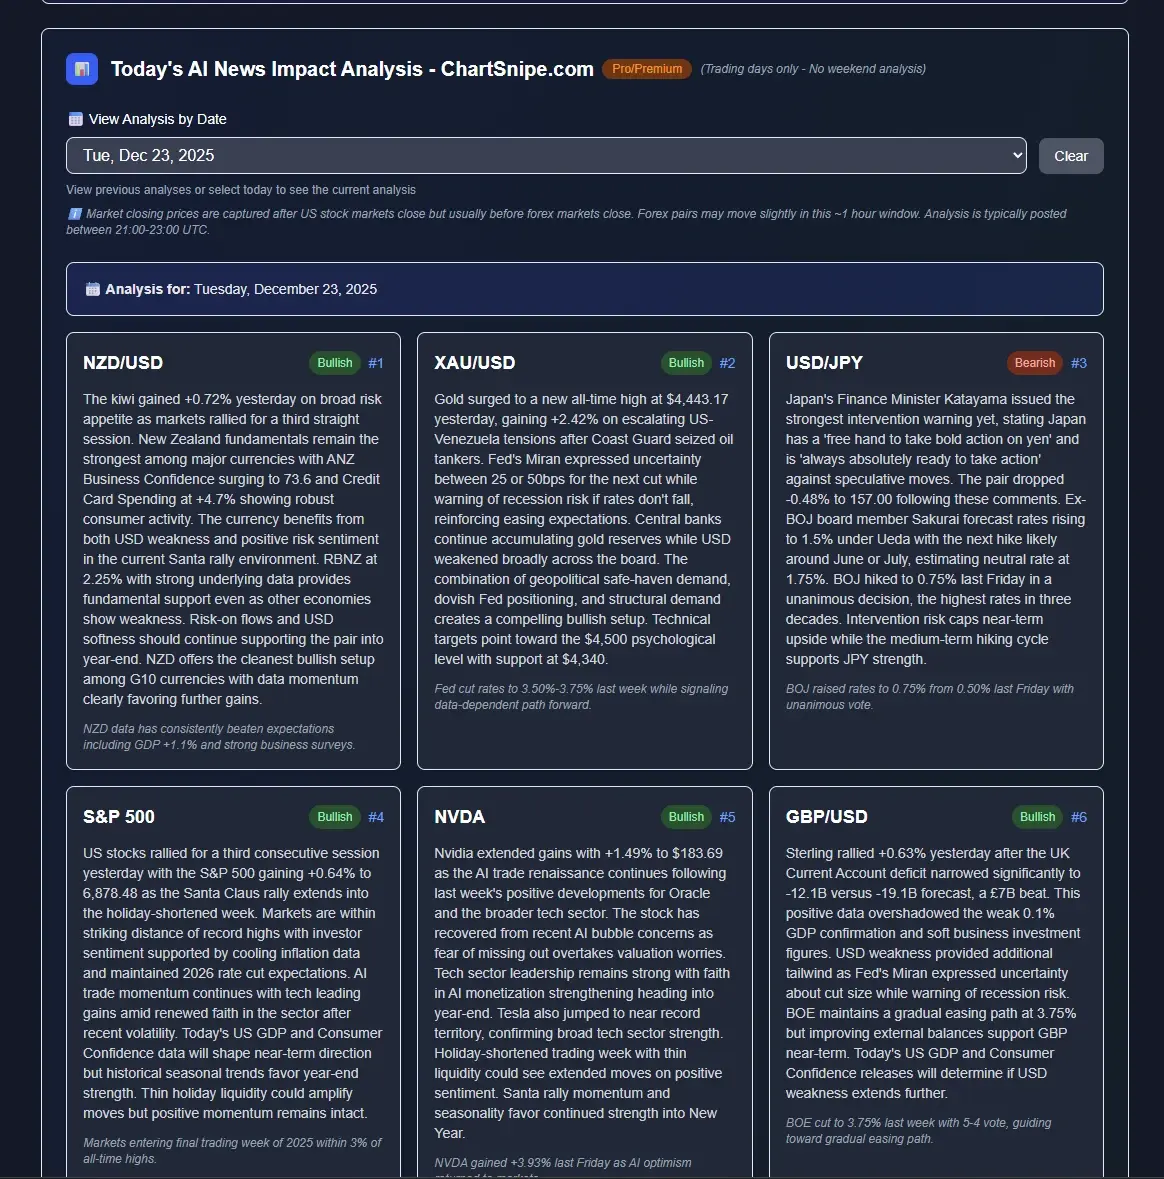
Markets covered include major forex pairs (EUR/USD, GBP/USD, USD/JPY, USD/CHF), commodity currencies (AUD/USD, USD/CAD, NZD/USD), emerging markets (USD/ZAR), precious metals (XAU/USD - Gold), indices (S&P 500, NASDAQ), individual stocks (NVIDIA, Tesla), and cryptocurrency (BTC/USDT).
Part 2: Detailed Instrument Analysis
Each card expands to reveal in-depth fundamental analysis explaining exactly why the AI is bullish or bearish on that instrument.

Each analysis explains the key drivers: central bank policy expectations, economic data releases, geopolitical factors, and cross-market correlations. For example, the AI might explain why it's bearish on EUR/USD due to ECB dovish signals combined with strong US employment data.
Part 3: Professional Analysis
Beyond individual instruments, ChartSnipe provides a comprehensive Professional Analysis section that covers the broader market picture.

The Professional Analysis includes:
- Market Overview — Summary of overall market sentiment and major themes
- What Happened Today — Key events, data releases, and their market impact
- Tomorrow's Catalysts — Upcoming events that could move markets
- Cross-Market Analysis — How different markets are interconnected
This combination of instrument-specific analysis and broader market context helps traders make informed decisions that account for both technical patterns and fundamental drivers.
All-in-One Trading Dashboard
Everything comes together in a clean, intuitive dashboard that gives you quick access to all features.
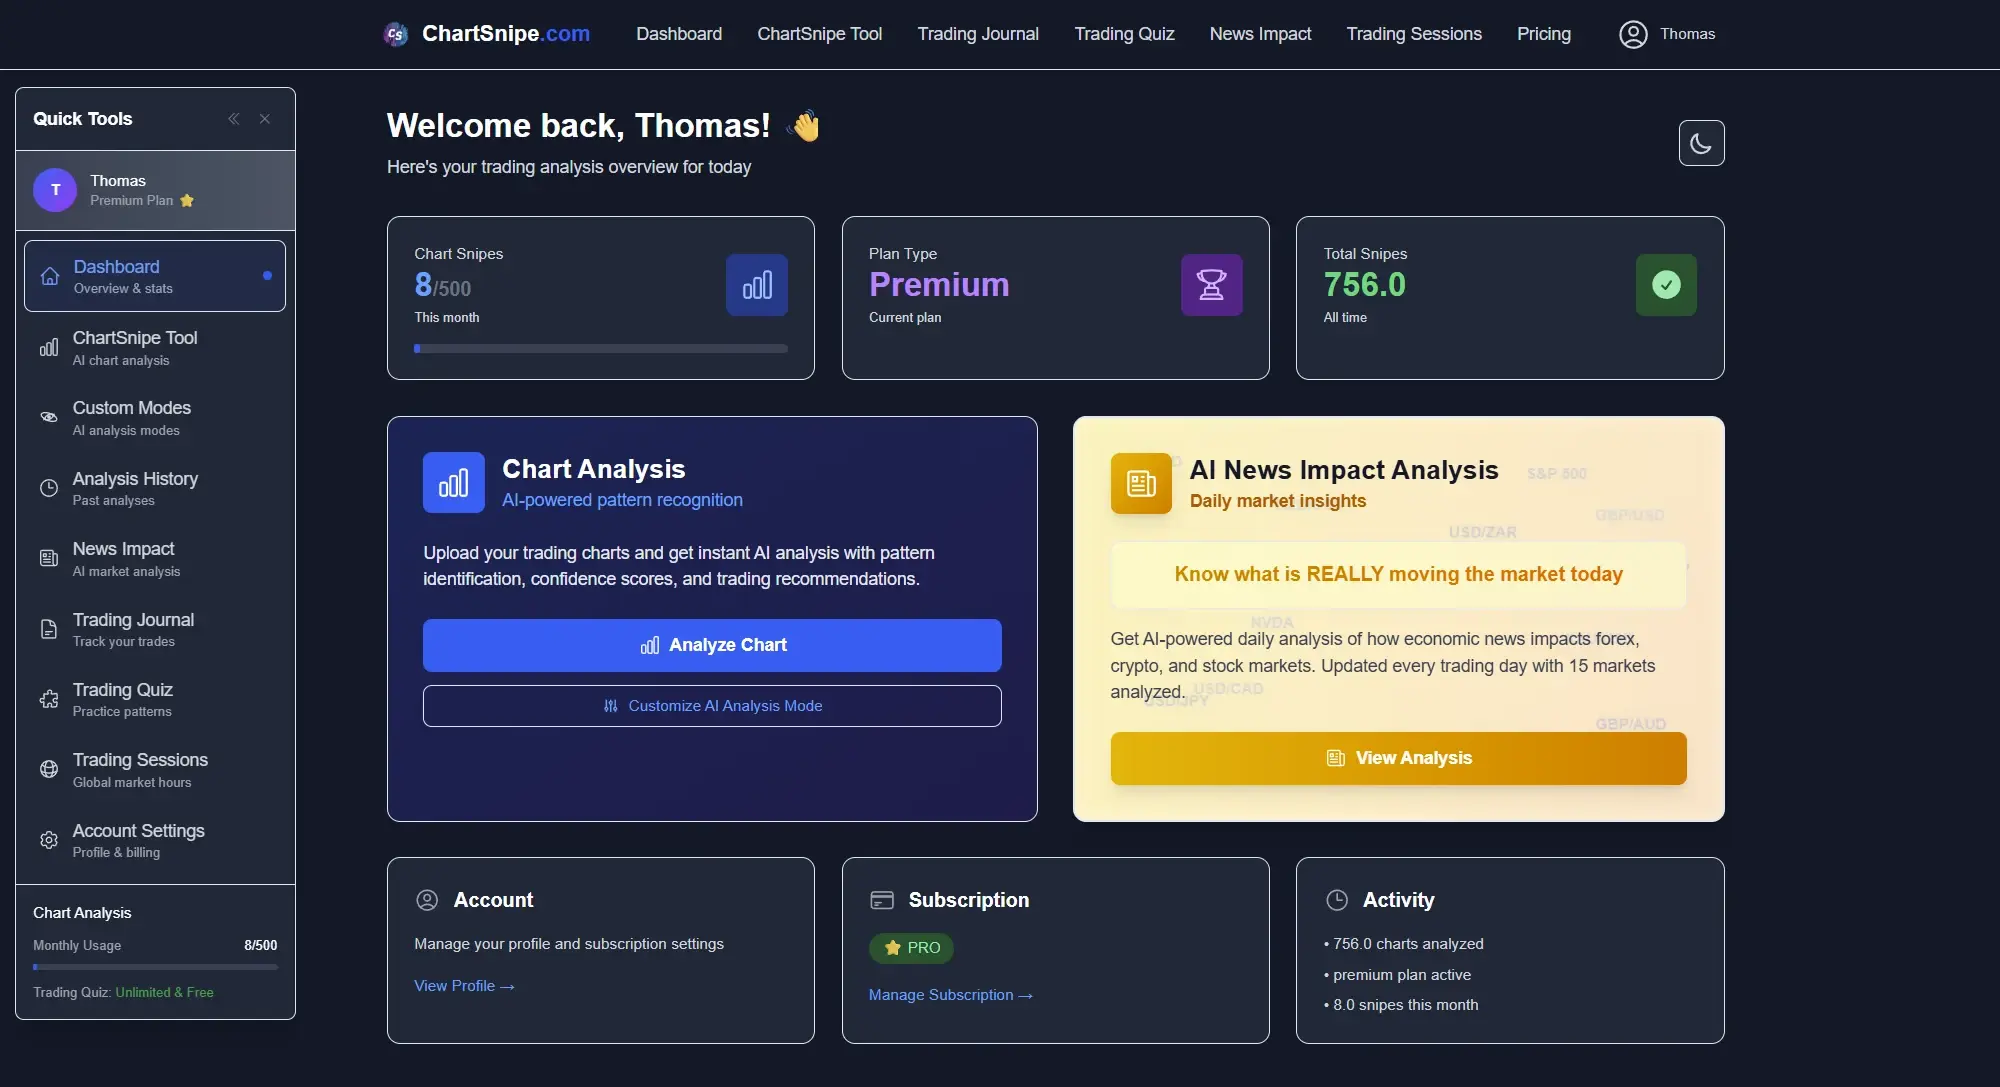
Pricing
- Free: 2 chart analyses per month + unlimited Trading Quiz
- Pro ($20/month): 120 analyses + Daily News Impact Analysis
- Premium ($50/month): 600 analyses + all features
Frequently Asked Questions
What is the best chart analysis software in 2026?
ChartSnipe is the best AI-powered chart analysis software in 2026, offering automated pattern recognition, multiple analysis modes, and real-time trading signals. It works with any chart, with or without indicators.
Can AI accurately analyze trading charts?
Yes, ChartSnipe AI can accurately detect chart patterns including double tops, triple bottoms, head and shoulders, and more. It provides instant pattern recognition and trading recommendations in seconds.
Do I need technical indicators for chart analysis?
No, ChartSnipe can analyze both clean price action charts and charts with indicators like VWAP, moving averages, and RSI. The AI adapts to whatever chart style you prefer.
Is ChartSnipe free to use?
ChartSnipe offers a free tier with 2 chart analyses per month. The Trading Quiz is completely free and unlimited. Paid plans start at $20/month for 120 analyses.
What markets can ChartSnipe analyze?
ChartSnipe can analyze charts from any market—forex, stocks, crypto, commodities, indices, and more. Simply upload a screenshot of any chart and the AI will analyze it.
Conclusion
The chart analysis software landscape has evolved dramatically, and AI-powered tools like ChartSnipe represent the future of technical analysis. With instant pattern recognition, multiple analysis modes, built-in trading calculators, and daily news impact analysis, ChartSnipe delivers everything a modern trader needs in one platform.
Whether you're a beginner learning to identify patterns or an experienced trader looking to speed up your analysis, ChartSnipe adapts to your style and helps you make better trading decisions.
Ready to try AI-powered chart analysis?
Get started with 2 free analyses. No credit card required.
Try ChartSnipe FreeWritten by the ChartSnipe Team — Building the future of AI-powered trading analysis.