Best AI Economic Calendar Analysis Tool in 2026
How AI transforms raw economic data into actionable trading insights with daily directional bias for forex, stocks, gold, and crypto.
Economic calendars are essential for traders, but raw data alone doesn't tell you how to trade. GDP beats expectations by 0.1%—is that bullish or bearish? The Fed hints at rate cuts—which currencies benefit? Understanding how economic events translate into market movements is what separates profitable traders from the rest.
ChartSnipe News Impact solves this problem with AI-powered fundamental analysis that delivers daily directional bias for 15+ trading instruments, explaining exactly how economic events affect each market.
Why Traditional Economic Calendars Fail Traders
Most economic calendars simply show you data releases: NFP came in at 256K vs. 160K expected, CPI at 2.9% vs. 2.8% forecast. But this raises more questions than it answers:
No Context
Is this beat already priced in? What were market expectations beyond the headline number?
No Cross-Market Impact
How does US data affect EUR/USD, gold, and the S&P 500 differently?
No Actionable Insight
Data without direction leaves traders guessing which way to trade
Information Overload
Dozens of events daily across multiple economies—which ones actually matter?
ChartSnipe News Impact processes all this complexity and delivers clear directional bias with reasoning—so you spend less time analyzing and more time trading.
Daily Analysis for 15 Trading Instruments
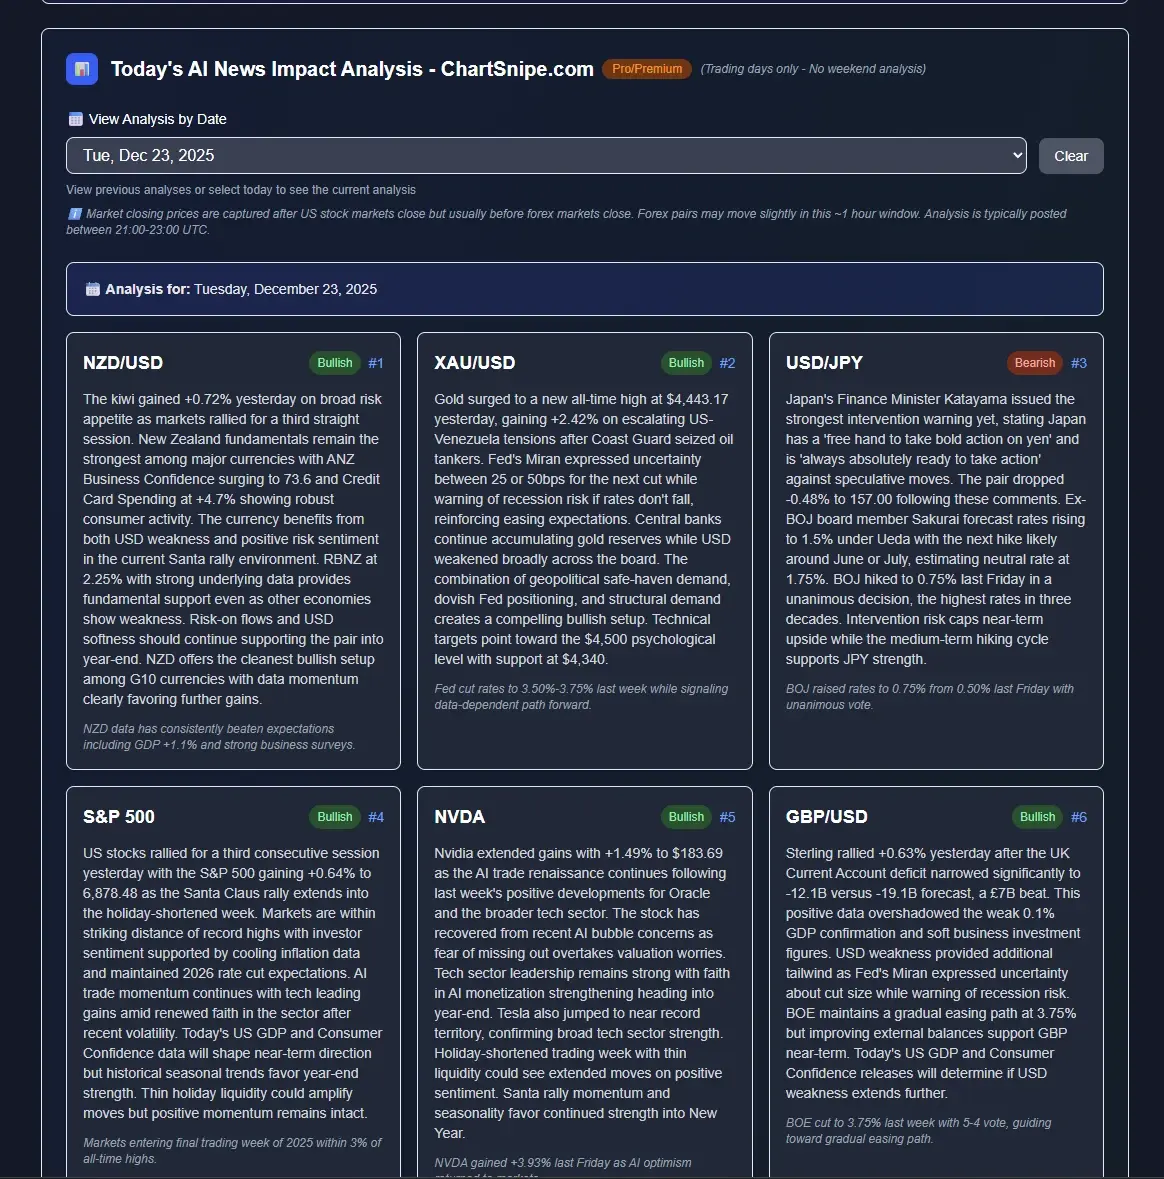
Every trading day, the AI analyzes economic events and delivers directional bias for 15 carefully selected instruments across forex, commodities, indices, stocks, and crypto.
Each instrument card shows at a glance:
- Directional Bias — Bullish, Bearish, or Neutral with color coding
- Ranking — Instruments ranked by opportunity strength (#1, #2, #3...)
- Historical Note — Yesterday's price action and key data points
Instruments Covered
Forex Major Pairs
- EUR/USD
- GBP/USD
- USD/JPY
- USD/CHF
Commodity Currencies
- AUD/USD
- USD/CAD
- NZD/USD
- USD/ZAR
Crosses & Exotics
- EUR/GBP
- GBP/AUD
- EUR/NZD
Commodities
- XAU/USD (Gold)
Indices & Stocks
- S&P 500
- NVIDIA
Cryptocurrency
- BTC/USDT
Detailed Reasoning for Every Signal
Unlike simple calendars that just show data, ChartSnipe News Impact explains why each instrument is bullish or bearish. Click any card to see the full analysis.

Each expanded analysis includes:
- Central Bank Policy Analysis — Fed, ECB, BOE, BOJ expectations and recent statements
- Economic Data Impact — How GDP, CPI, employment data affects the pair
- Cross-Market Correlations — How gold, equities, and bond yields influence currencies
- Geopolitical Factors — Trade tensions, political events, and risk sentiment
- Technical Context — Key levels and recent price action
"S&P 500 rose to 6,913 for a second consecutive gain as tariff fears faded. US GDP came in at 4.4%, the strongest pace in two years, beating the 4.3% forecast. Tech led the rally with Nasdaq up +0.91% driven by Tesla's +4.15% surge. Today's Flash PMIs and Consumer Sentiment provide catalysts but momentum favors continued upside."
Professional Market Analysis
Beyond individual instrument analysis, ChartSnipe provides a comprehensive professional analysis section that covers the broader market picture—the kind of morning briefing you'd get at a hedge fund.

The Professional Analysis section includes:
Market Overview
Summary of overall risk sentiment, major themes, and dominant market narratives
What Happened Yesterday
Key data releases, central bank comments, and market reactions from the previous session
Today's Catalysts
Upcoming events that could move markets: data releases, speeches, earnings reports
Geopolitical Updates
Trade tensions, political developments, and global events affecting risk sentiment
Real-World Example: How the Analysis Works
Let's look at how ChartSnipe News Impact analyzed markets on a typical trading day:
Key Events Analyzed:
- US GDP at 4.4% — Beat expectations of 4.3%, strongest in two years
- Unemployment Claims at 200K — Beat 209K forecast, showing labor strength
- Gold breaks $4,900 — Third consecutive all-time high
- Australian Employment +65.2K — Massive beat vs 28.3K forecast
- BOJ Rate Decision — Key event for JPY pairs
AI Ranking in Action: AUD/USD and NZD/USD
On January 22, 2026, the AI ranked AUD/USD as #1 and NZD/USD as #2 based on the Australian employment data catalyst and risk-on sentiment from Trump's tariff de-escalation.

The result? After the AI published this analysis, AUD/USD gained +1.19% and NZD/USD gained +1.34%. The AI noted that "if employment beats expectations, AUD could see significant follow-through buying"—and that's exactly what happened when Australian employment came in at +65.2K versus the 28.3K forecast.
Why Ranking Matters
Instead of showing arbitrary confidence percentages, the ranking system tells you which instruments have the strongest fundamental case that day. When AUD/USD and NZD/USD were ranked #1 and #2, both delivered gains of +1.19% and +1.34% respectively—validating the AI's assessment that antipodean currencies had the best opportunity that day.
Notice how the AI doesn't just say "data was good, therefore bullish." It considers context, cross-market flows, and upcoming catalysts. The AUD analysis highlighted Australian Employment data as the critical catalyst, while NZD analysis focused on CPI data validating the RBNZ's hiking bias—this nuance is what separates useful analysis from simple data regurgitation.
Access News Impact Analysis
Daily AI economic calendar analysis is included with ChartSnipe Pro and Premium plans:
- Pro ($20/month): 120 chart analyses + Daily News Impact
- Premium ($50/month): 600 chart analyses + Daily News Impact + All features
Frequently Asked Questions
What is the best AI economic calendar analysis tool in 2026?
ChartSnipe News Impact is the best AI-powered economic calendar analysis tool in 2026. It provides daily fundamental analysis for 15+ trading instruments, explaining how economic events, central bank decisions, and market news affect forex, stocks, gold, and crypto.
How does AI analyze economic calendar events?
ChartSnipe AI processes economic data releases, central bank statements, geopolitical events, and market reactions to provide directional bias (Bullish, Bearish, or Neutral) for each instrument. It ranks instruments by opportunity strength and explains the reasoning behind each bias.
What instruments does the AI economic calendar cover?
ChartSnipe News Impact covers 15+ instruments including major forex pairs (EUR/USD, GBP/USD, USD/JPY), commodity currencies (AUD/USD, USD/CAD), gold (XAU/USD), indices (S&P 500), stocks (NVIDIA), and cryptocurrency (BTC/USDT).
Is the AI economic calendar updated daily?
Yes, ChartSnipe News Impact is updated daily with fresh analysis based on overnight economic releases, market movements, and upcoming events. The analysis is typically available before major trading sessions open.
How is this different from a regular economic calendar?
Regular economic calendars show raw data without context. ChartSnipe News Impact analyzes how events affect specific instruments, ranks them by opportunity strength, and explains the cross-market implications—turning data into actionable trading insights.
Conclusion
Economic calendar analysis doesn't have to be overwhelming. ChartSnipe News Impact transforms raw economic data into clear, actionable trading insights with daily directional bias for the instruments you actually trade.
Whether you're a fundamental trader who needs to understand how news affects your positions, or a technical trader who wants to align with the macro picture, News Impact gives you the context traditional calendars miss.
Ready to try AI-powered economic calendar analysis?
Get daily market insights with ChartSnipe News Impact.
View Today's AnalysisWritten by the ChartSnipe Team — Building the future of AI-powered trading analysis.