
How to Read Any Chart in 60 Seconds With AI
You do not need an hour and a fresh pot of coffee to read a chart. With a purpose-built AI you can go from screenshot to a structured read — pattern, bias, key levels, invalidation — in about a minute, then spend the rest of your time on the decision that actually matters.

Most traders do not lose time on the trade. They lose it on the staring. You open a chart, draw a trendline, redraw it, add a moving average, mark two levels you are not sure about, zoom out, zoom back in, and twenty minutes later you have a mess of lines and no clearer idea than when you started. Multiply that by a watchlist of ten instruments and half your session is gone before you have made a single decision.
A good AI chart read collapses that mechanical part into about a minute. Screenshot in, and you get a named pattern, a directional bias, the levels that matter, and the price where the idea is wrong. That is not magic and it is not a signal — it is the same read a competent analyst would give you, faster. The value is not the speed for its own sake. It is that you get the boring part done quickly and keep your attention for the decision: does this fit my plan, is the level still valid, and what size makes sense.
This is a walkthrough of the exact repeatable workflow using ChartSnipe — how to screenshot, which of the five analysis modes to reach for, how to read the output without switching off your brain, and the one discipline that keeps a fast read from turning into a careless trade: verify the levels before you trust them.
Key Takeaways
- →The workflow is four steps: screenshot, pick the mode, read the output critically, cross-check the news. The AI owns the first three seconds; you own everything after.
- →A clean single-timeframe screenshot beats a cluttered one every time. Garbage in, confident-sounding garbage out.
- →Match the mode to the job: Quick Snipe to triage, S&R Levels for zones, Full Snipe for conviction, Liquidity Snipe for a smart-money read, Beat Another for a second opinion.
- →Screenshot analysis reads the picture, not the live market. Always confirm the levels against current price before you act.
- →Pair the chart read with the daily AI news impact and currency strength so you are not entering blind to the day's macro flow.
1. Why a fast, repeatable read beats a slow one
A slow read is not a more careful read. It is usually the same read, arrived at after twenty minutes of second-guessing that adds nothing but doubt. The longer you stare at a chart, the more likely you are to talk yourself into a level that is not there or a pattern that only exists because you want it to. Speed, done right, is a discipline: it forces the read to be about what is actually on the chart rather than what you hope to find.
Repeatability is the other half. A read you can produce the same way every session is a read you can review, journal, and improve. If your process is “I looked at it and felt bullish,” there is nothing to audit when the trade goes wrong. If your process is “clean screenshot, Full Snipe, confirm the level, check the news, decide,” you can go back and find exactly where the read broke. Consistency is what turns a string of trades into an edge, and a fast fixed workflow is the cheapest way to buy consistency.
There is also a simple attention argument. You have a finite budget of good judgement per day. Spending it on drawing trendlines for the tenth time is a waste. Spend the mechanical minutes on the AI and save the judgement for the questions only you can answer — whether the setup fits your plan, whether now is the time, and how much to risk.
2. The 60-second workflow at a glance
Four steps, and only the middle two involve the AI. Screenshot, analyse, verify, decide. The whole loop is designed so the machine does the fast mechanical work and you keep the two ends — framing the question and owning the decision.
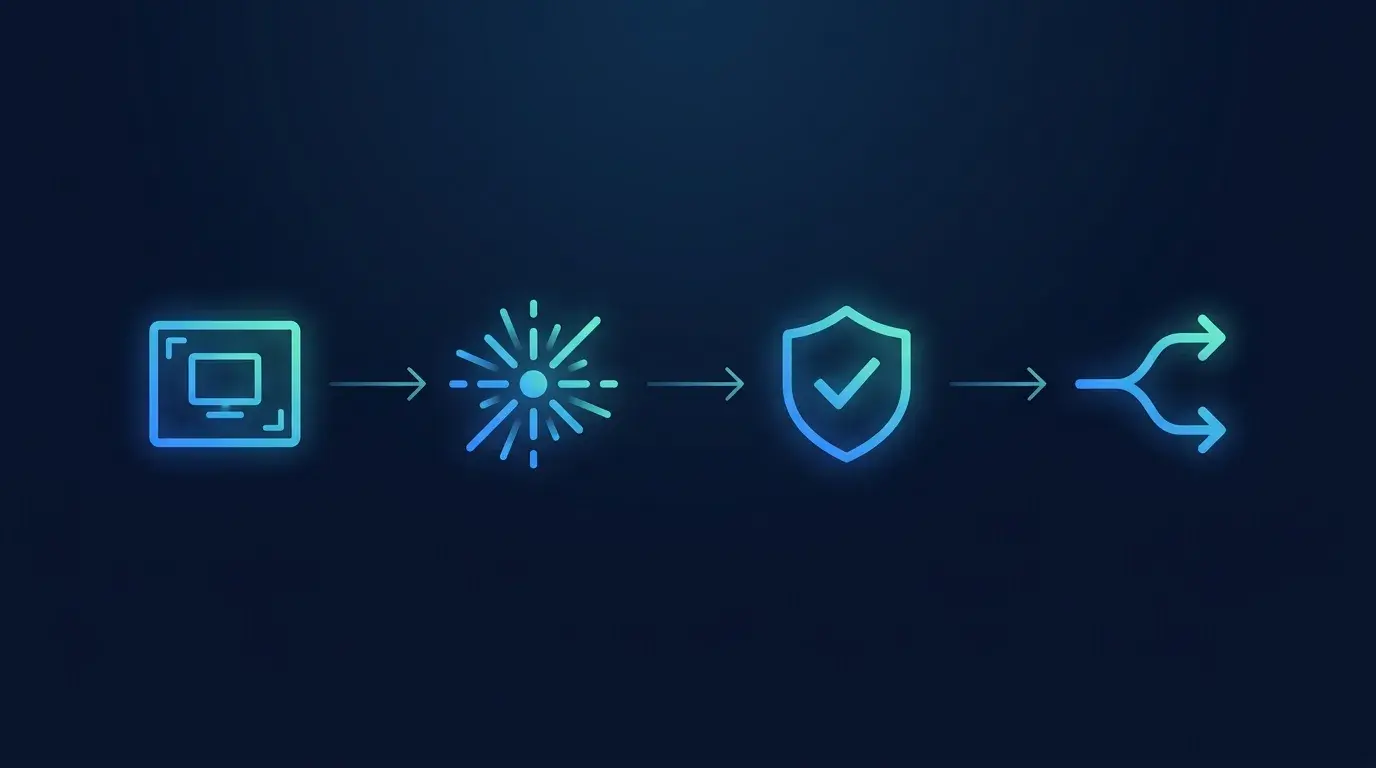
- Screenshot (10–15 seconds). One timeframe, clean chart, enough candles to show structure. This is the step most people rush and then wonder why the read is off.
- Analyse (5–10 seconds). Drop it into the mode that fits the job and let the tool return the read.
- Verify (15–20 seconds). Check the levels against the live price. Screenshot analysis reads the picture, not the market — this is the step that keeps you honest.
- Decide (the rest). Does it fit your plan, your risk, the day's macro? This is where the time you saved goes to work.
The minute is a floor, not a target. If a setup is worth trading, it is worth a few extra minutes of thought on the decision. The 60 seconds is only the read — the goal is to finish the mechanical part fast so the thinking part gets your full attention.
3. Step 1 — take the right screenshot
The quality of the read is capped by the quality of the screenshot. A vision model reads what is in the image; it cannot infer the ten indicators you had switched off or the higher timeframe you glanced at first. Three things decide whether the input is any good: the timeframe, the clutter, and the framing.
One timeframe that matches your horizon
Pick the timeframe you actually trade off. A scalper screenshotting a monthly chart, or a swing trader screenshotting a one-minute, gets a read that answers the wrong question. If you want the fuller multi-timeframe picture, take two screenshots — a higher timeframe for context and your trading timeframe for the entry — and run each rather than cramming both into one cluttered image.
Strip the chart to price plus one or two tools
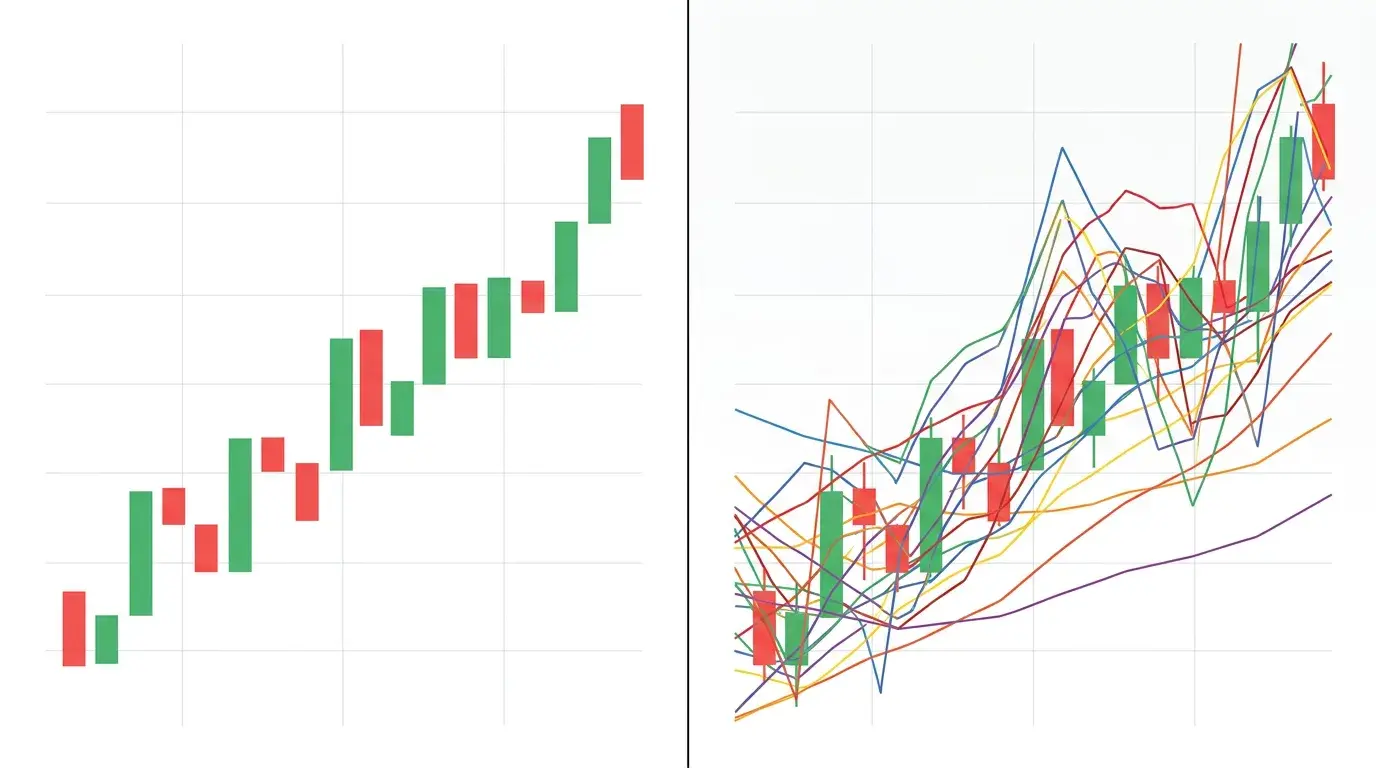
Price action, and maybe a moving average or a single oscillator you genuinely use. That is it. Eight overlapping indicators do not give the AI more to work with — they bury the candles under a mesh of coloured lines and make pattern recognition harder, exactly as they do for a human. Clean charts read better because there is less noise between the model and the structure.
Frame enough candles, and leave room on the right
Capture roughly 60 to 150 candles — enough for the swing structure and recent levels to be visible, not so many that each candle is a sliver. Leave a little empty space on the right edge so the most recent price is not jammed against the border; the current candle is the one the read hinges on, and it needs room to breathe.
4. Step 2 — pick the mode
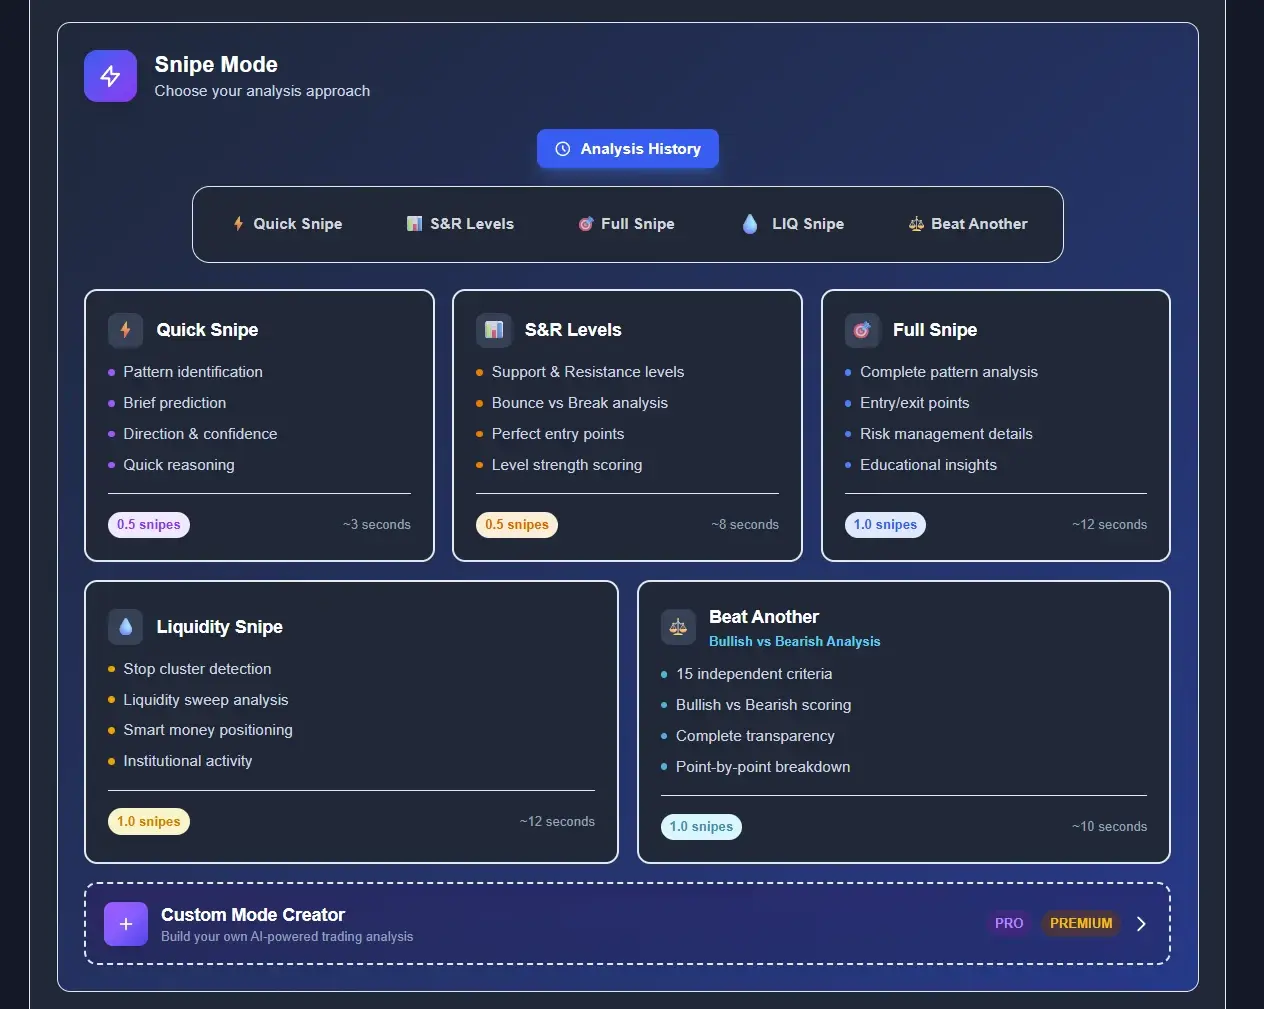
ChartSnipe has five screenshot analysis modes, plus a custom mode creator. They are not five flavours of the same thing — each answers a different question, and picking the right one is most of what makes the read fast. Reach for the lightest mode that answers the question you actually have.
Quick Snipe — triage a watchlist
The fast one. Use it to sweep through a watchlist and find out which charts are worth a closer look. It gives you the bias and the headline read without the full workup, so you can clear ten instruments in the time a full analysis takes on one. Think of it as the filter before the deep dive, not the deep dive itself.
S&R Levels — just the zones
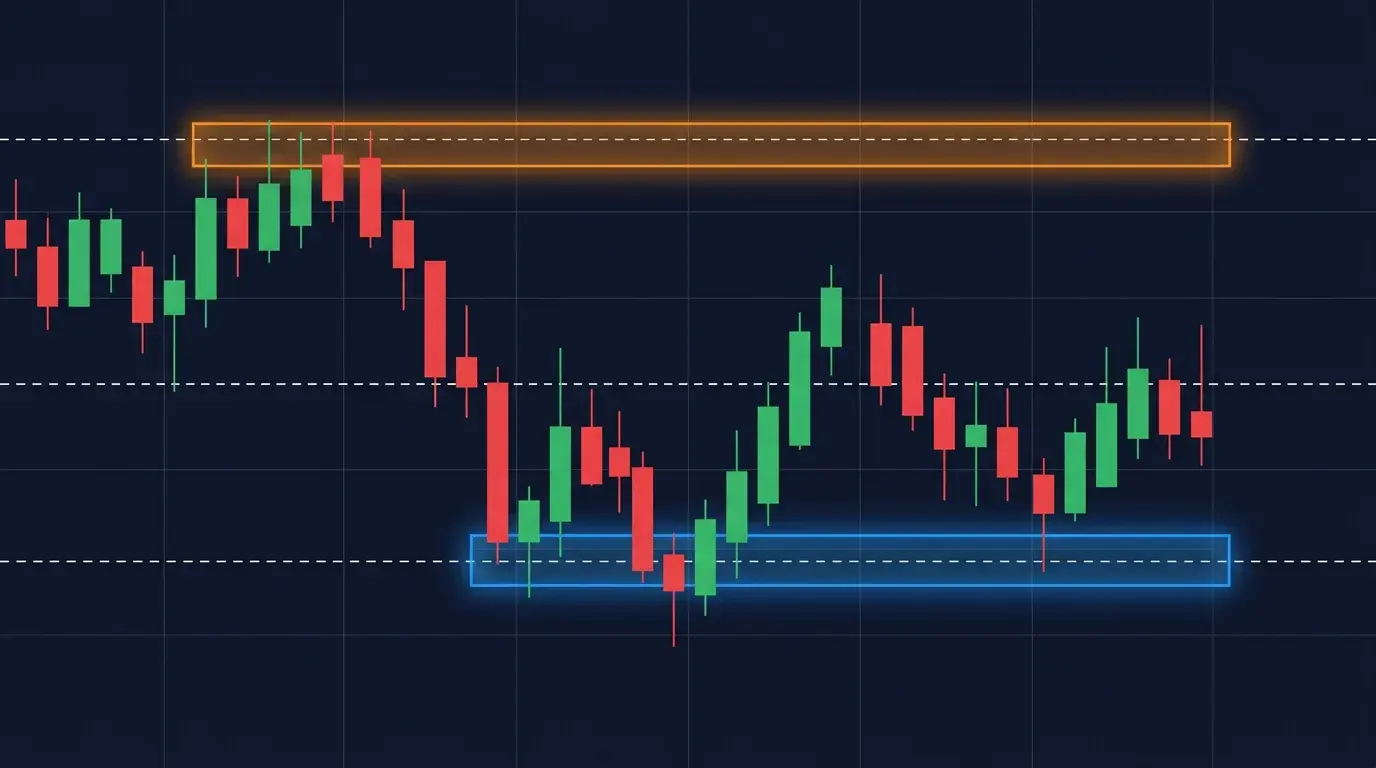
When you already have a view and only need the key support and resistance zones marked, this is the one. It is ideal for setting alerts, planning where a limit order might sit, or sanity-checking the levels you drew yourself against what the AI reads off the same chart.
Full Snipe — the conviction read
When you are close to a decision, this is the full readout: the pattern, the directional bias, a suggested entry, a stop, a target, and the reasoning behind each. It is the mode to use on the one or two charts that survived your Quick Snipe triage. You are not looking for it to tell you what to do — you are pressure-testing your own idea against a structured second read.
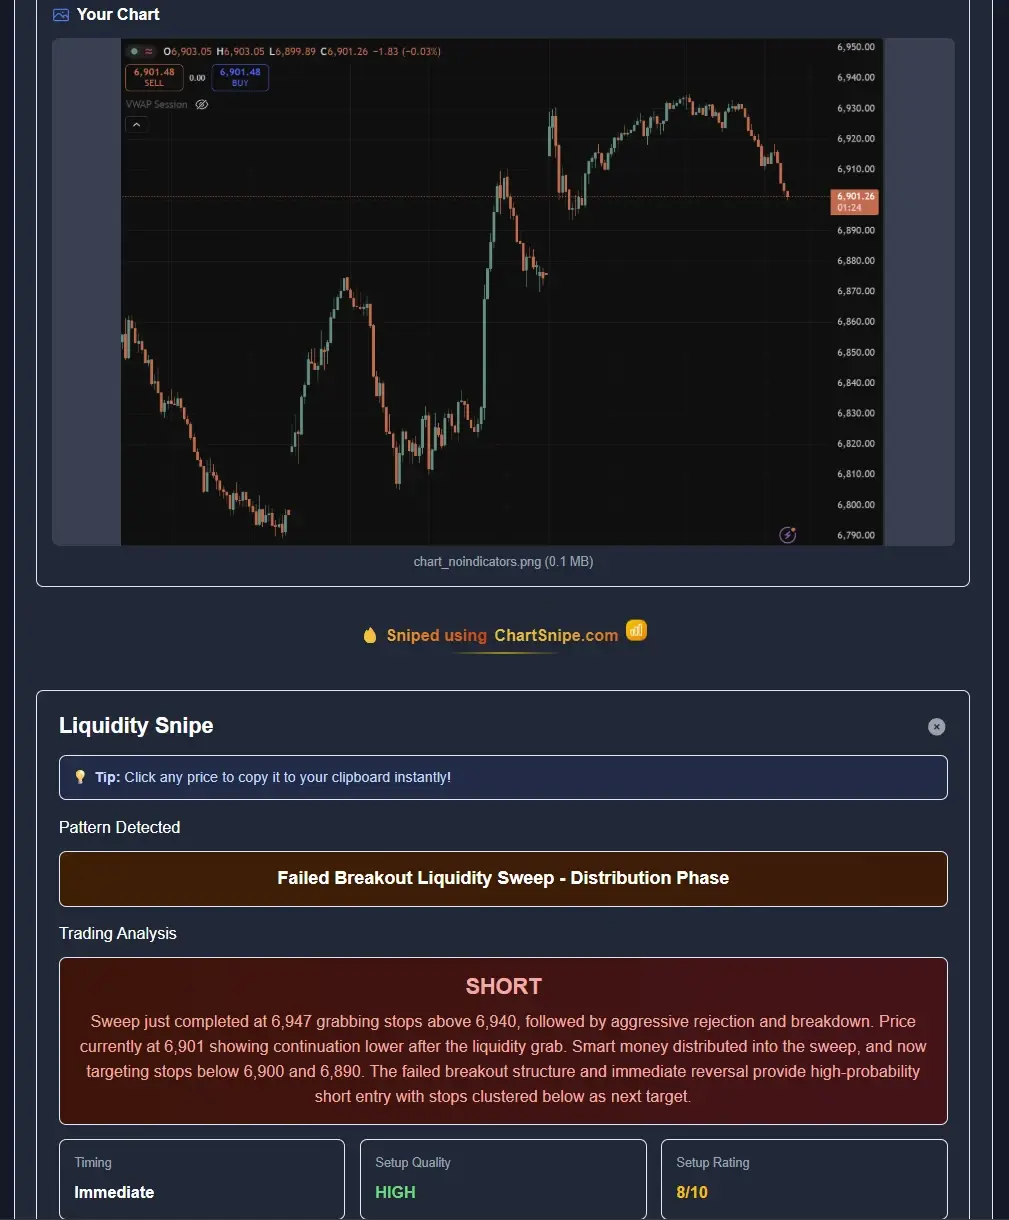
Liquidity Snipe — the smart-money read
For traders who work in smart-money concepts, this reads the chart through that lens: liquidity sweeps, order blocks, and a setup score out of ten so you have a quick gauge of how clean the structure is. If you do not trade SMC it is not the mode for you, and that is fine — use the one that matches how you actually think about the market.
Beat Another — the second opinion
When you already have a read — your own or from another mode — and want it challenged. Beat Another gives you a fresh take to argue against, which is exactly what you want before committing to a trade you already like. Confirmation bias is easiest to beat when you deliberately invite a dissenting view.
Build your own with the Custom Mode Creator. If you trade a specific strategy — a particular pattern, a fixed checklist, a set of rules — you can build a mode that reads every chart through exactly that framework, so the output matches how you already trade instead of a generic template.
5. Step 3 — read the output critically
The output is a starting point, not a verdict. It looks authoritative — a named pattern, precise levels, clean reasoning — and that polish is exactly why you have to read it with a little scepticism. The goal is to use the read, not to outsource your thinking to it.
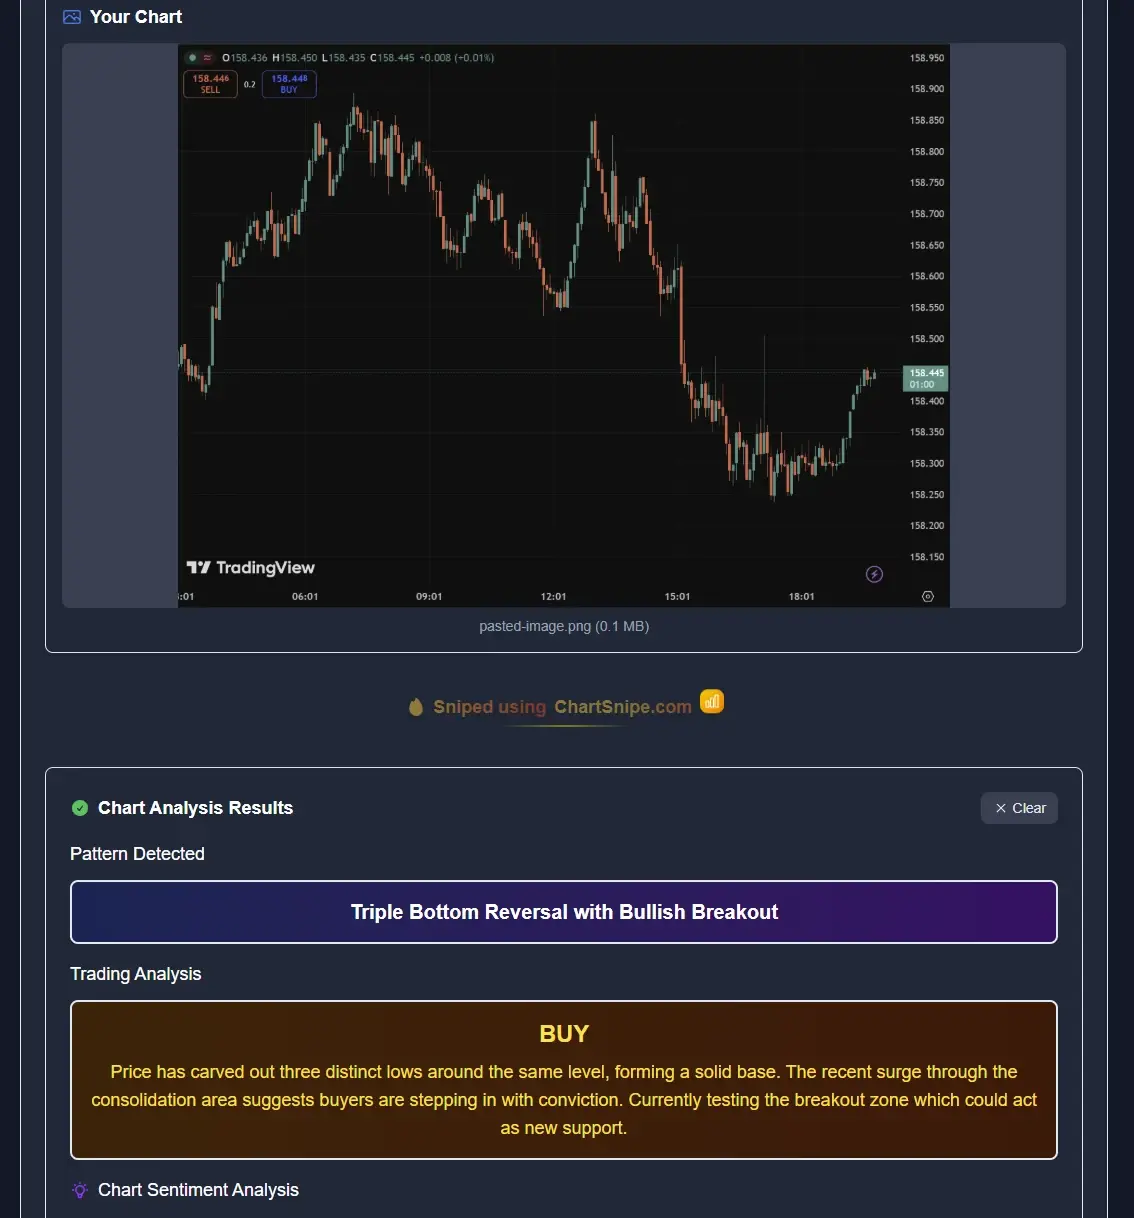
Three questions to run on every read. First, does the reasoning match the chart I can see? If it calls a double bottom, the two lows should actually be there. If the logic does not line up with the candles, trust the candles. Second, where does it say the idea is wrong? The invalidation level is the most useful thing in the whole read — it is where you would exit, and it tells you the risk before you think about the reward. Third, is the reward worth the risk from here? A great pattern with a target barely further than the stop is not a trade worth taking.
Treat a confident tone as a prompt to check, not a reason to relax. The read that sounds most certain is the one worth questioning hardest, because certainty is easy to generate and expensive to trust. You are the analyst reviewing a junior's work, not a client accepting a recommendation.
6. Step 4 — cross-check the news and currency strength
Here is the limit you cannot design around: screenshot analysis reads the price action in the image, but it cannot see live prices and it has no idea what is on the economic calendar. A beautiful long setup means nothing if US CPI lands in twenty minutes, or if the level it hinges on was swept two hours after you took the screenshot. This is the step that closes the gap.
Two quick checks. First, confirm the level on the live chart. Pull up current price and make sure the support or resistance the read is built on is still intact and still where the AI put it. If price has already blown through it, the read is stale and the trade is different now. Second, check the day's macro flow. The Daily AI News Impact ranks the instruments most likely to move on the day's news with a conviction score and the drivers behind it, and the currency strength index tells you whether the currency you are trading is being bought or sold across the board. If your chart says long and the macro says the currency is the weakest of the eight majors, that is a conflict worth resolving before you click.
None of this takes long. A glance at the news read and the strength grid is fifteen seconds, and it is the difference between trading with the day's flow and getting run over by a headline you never saw coming. The chart read tells you the setup; the macro tells you whether the setup has the wind at its back.
7. What AI still gets wrong and how to catch it
Being honest about the failure modes is what keeps a fast read safe. None of these is a reason to skip the tool — they are reasons to keep it in the research seat and stay in the decision seat yourself.
Half-formed patterns. AI will sometimes name a pattern that is only partly there — a “head and shoulders” missing a clean neckline, a “breakout” that has not actually broken. Catch it by checking the pattern against the candles yourself. If you cannot see it clearly, it is not clear enough to trade.
Off-screen context. The read only knows what is in the frame. A major level or a huge prior swing sitting just outside your screenshot does not exist as far as the model is concerned. Catch it by zooming out on the live chart before you commit, especially near round numbers and prior highs and lows.
No calendar awareness. The chart does not know NFP, CPI or an FOMC decision is coming. In a year where a single inflation print has moved gold sixty dollars in an hour, trading through scheduled data blind is how good reads become bad trades. Catch it by checking the calendar and the news read before you size anything.
No feel for the tape. AI cannot sense that price is grinding, that liquidity is thin into a holiday, or that the market has ignored three bullish headlines in a row. That texture is yours to read. The tool gives you the structure; you supply the context, the timing, and the size. For a fuller picture of where general-purpose models fall short on charts, our breakdown of whether ChatGPT works for trading charts and the roundup of the best AI chart screenshot analysis tools both go deeper, and there is a step-by-step on using ChatGPT to analyse a forex chart if you want to compare the workflow.
Do
- Send a clean, single-timeframe screenshot.
- Confirm every level against live price.
- Read the invalidation before the target.
- Check the calendar and news before sizing.
Don't
- Trade a level straight off a static image.
- Treat a confident read as a signal.
- Screenshot a chart buried in indicators.
- Skip the decision because the read was fast.
Frequently asked questions
Can AI really read a chart in 60 seconds?
The read itself takes seconds — a named pattern, a bias, the key levels and an invalidation point, returned almost instantly from a screenshot. The 60 seconds accounts for taking a clean screenshot and skimming the output. It does not include the decision: sizing, confirming the level on the live chart, and choosing whether to act. That part is on you, and it is the part that matters.
What is the best way to screenshot a chart for AI analysis?
One timeframe that matches your trade horizon, the chart stripped to price plus one or two indicators you actually use, and 60 to 150 candles so the structure is visible. Leave a little space on the right edge so recent price is not jammed against the border. A clean single-timeframe screenshot reads far better than a chart with eight overlapping indicators.
Which ChartSnipe analysis mode should I use?
Quick Snipe to triage a watchlist, S&R Levels when you only need the zones, Full Snipe when you are close to a decision and want pattern, entry, stop, target and reasoning, Liquidity Snipe for a smart-money read with sweeps, order blocks and a setup score out of ten, and Beat Another for a second opinion. The Custom Mode Creator lets you build a mode around your own strategy.
Can AI chart analysis see live prices?
Screenshot analysis reads the price action inside the image you give it. It cannot see the live market or know where price moved after you captured the chart. That is why you treat the levels it returns as a starting map and confirm them against current price before acting. ChartSnipe pairs the read with live pricing, currency strength and a daily AI news impact so you can close that gap in seconds.
What does AI chart analysis still get wrong?
It occasionally names a half-formed pattern, reads levels off the visible window without knowing about a stronger level just off-screen, and has no idea what is on the economic calendar unless you tell it. It also cannot feel the tape. Keep it in the research seat — use it to speed up the read, then apply your own judgement on context, timing and size.
Is a 60-second read too fast to be useful?
Only if speed replaces thinking. The point of a fast read is to spend less time on the mechanical part of chart-reading so you have more time for the decision. A minute for a structured read and five minutes on whether the trade fits your plan is a far better split than half an hour drawing lines with no time left for risk.
Sources & further reading
Run the 60-second read on your own chart
Five screenshot analysis modes, a custom mode creator, live pricing for 28 FX pairs plus gold and silver, a currency strength index, and a daily AI news impact to cross-check every read. Two free snipes to try it before you pay.