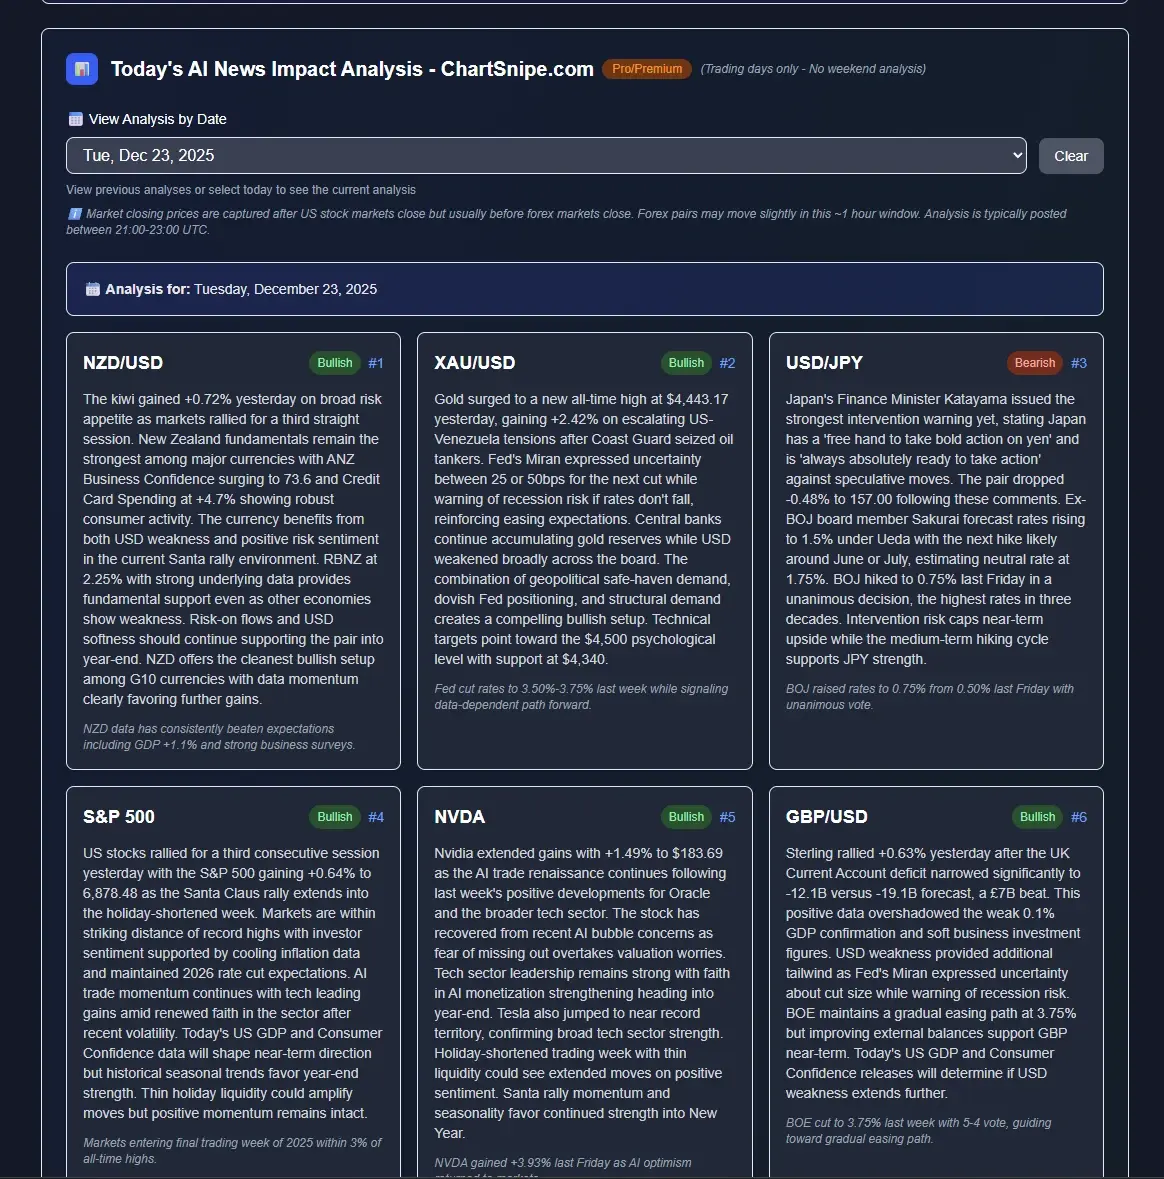
Best AI Chart Screenshot Analysis Tools Tested in 2026 (Honest Review)
We tested 6 AI tools that analyze chart screenshots across 100 forex, stock, crypto, and index charts. Here is the honest ranking by pattern accuracy, price-level accuracy, live data integration, and speed.

If you have ever tried to upload a chart screenshot to an AI and ask "what do you think?", you already know the quality gap is huge. Some tools will invent price levels that do not exist. Others describe the chart in beautiful prose but miss the actual setup entirely. A handful of purpose-built tools actually read the chart, know the live price, and reason about the trade.
We spent the last three months testing every major AI chart screenshot analysis tool on the market. We uploaded 100 real charts across forex, stocks, crypto, and indices. We scored every tool across five dimensions. This article is the honest ranking. The short version: ChartSnipe wins by a wide margin, but not every other tool is bad — some have very specific use cases where they shine.
TL;DR ranking: 1) ChartSnipe (winner, purpose-built) · 2) ChatGPT Vision (best general AI for education) · 3) Claude (best reasoning, weakest data) · 4) TradingView AI Copilot (good if you already live in TradingView) · 5) Generic "Chart Analyzer" SaaS clones (thin wrappers, avoid) · 6) Google Gemini (decent vision, no trading specialization).
Key Takeaways
- →ChartSnipe is the only purpose-built AI chart screenshot analyzer — it combines vision, live prices for 32 instruments, and daily news context in one tool.
- →ChatGPT Vision and Claude are excellent general AIs but hallucinate specific price levels and have no live market data feed.
- →TradingView AI Copilot is a solid option if you already live in TradingView, but it is a feature bolted onto a charting platform, not a standalone analyst.
- →Generic "chart analyzer" SaaS clones are thin wrappers around GPT Vision — avoid them.
- →The best AI chart tool scores well on five dimensions: pattern accuracy, price-level accuracy, live data, signal clarity, and speed.
1. What Makes a Great AI Chart Screenshot Tool
Before we rank anything, we need to agree on what matters. After analyzing 100 charts across dozens of tools, we concluded that a great AI chart screenshot analyzer has to nail five things. If it fails on any one of these, it is not usable for real trading — only for entertainment.
Pattern Recognition Accuracy
Can it correctly identify double tops, head and shoulders, triangles, flags, order blocks, and liquidity sweeps without inventing patterns that are not actually on the chart?
Price-Level Accuracy (Support and Resistance)
This is where most AI tools fail badly. A tool that tells you "support is at 1.0850" when the real level is 1.0820 is worse than useless — it is actively dangerous because it sounds precise.
Signal Clarity & Trade Plan
A good tool gives you a clear directional bias, an entry, a stop loss, and at least one take-profit level. Vague "it could go either way" responses are useless.
Live Data Integration
The screenshot is already seconds old. Without a live price feed the AI cannot verify whether a level has already been swept, whether news just broke, or whether the pattern is still valid.
Speed
Trading is time-sensitive. If the AI takes 45 seconds to respond, the setup is gone. The best tools return a full analysis in under 5 seconds.
We also considered a sixth dimension — news context — because every experienced trader knows that a technically perfect setup can be invalidated by a single Fed speech or geopolitical headline. Tools that integrate a daily news impact layer (like ChartSnipe NewsImpact) get bonus points for catching these invalidations automatically.

2. Our Testing Methodology
We wanted this comparison to be as unbiased as possible, so we built a repeatable test protocol and ran every tool through the same 100 screenshots under the same conditions.
The 100-chart dataset
- 40 forex charts — major pairs (EUR/USD, GBP/USD, USD/JPY, USD/CHF) plus crosses (EUR/GBP, AUD/NZD, GBP/JPY) on 15m, 1H, 4H and Daily timeframes
- 25 stock charts — large caps like NVDA, TSLA, AAPL, plus a few mid-caps to test how tools handle less liquid names
- 20 crypto charts — BTC, ETH and a couple of alts on various timeframes, including some wild volatility days
- 15 index charts — S&P 500, NASDAQ 100, DAX, FTSE, Nikkei
Every chart had a known ground truth — we already knew the correct pattern, the exact support and resistance levels, and what actually happened in the hours after the screenshot was taken. This let us score each tool objectively instead of just vibing on how the response "felt".
The 5 scoring dimensions
Each tool got a score from 0 to 10 on each of the five dimensions. We averaged across all 100 charts to produce a final score out of 50.
- Pattern accuracy — did it correctly name the pattern, and not hallucinate extra patterns?
- Support & resistance accuracy — were the called levels within 0.1% of the real levels?
- Signal clarity — did it commit to a direction with an entry, stop, and target?
- Live data integration — did it verify the current price against the screenshot?
- Speed — how long from upload to full response?
Important caveat: every test was run in early 2026 with the latest publicly available version of each tool. AI models change fast — GPT-4, Claude, and Gemini all release new versions regularly. The relative ranking has been stable for months, but specific scores may shift when new models drop.

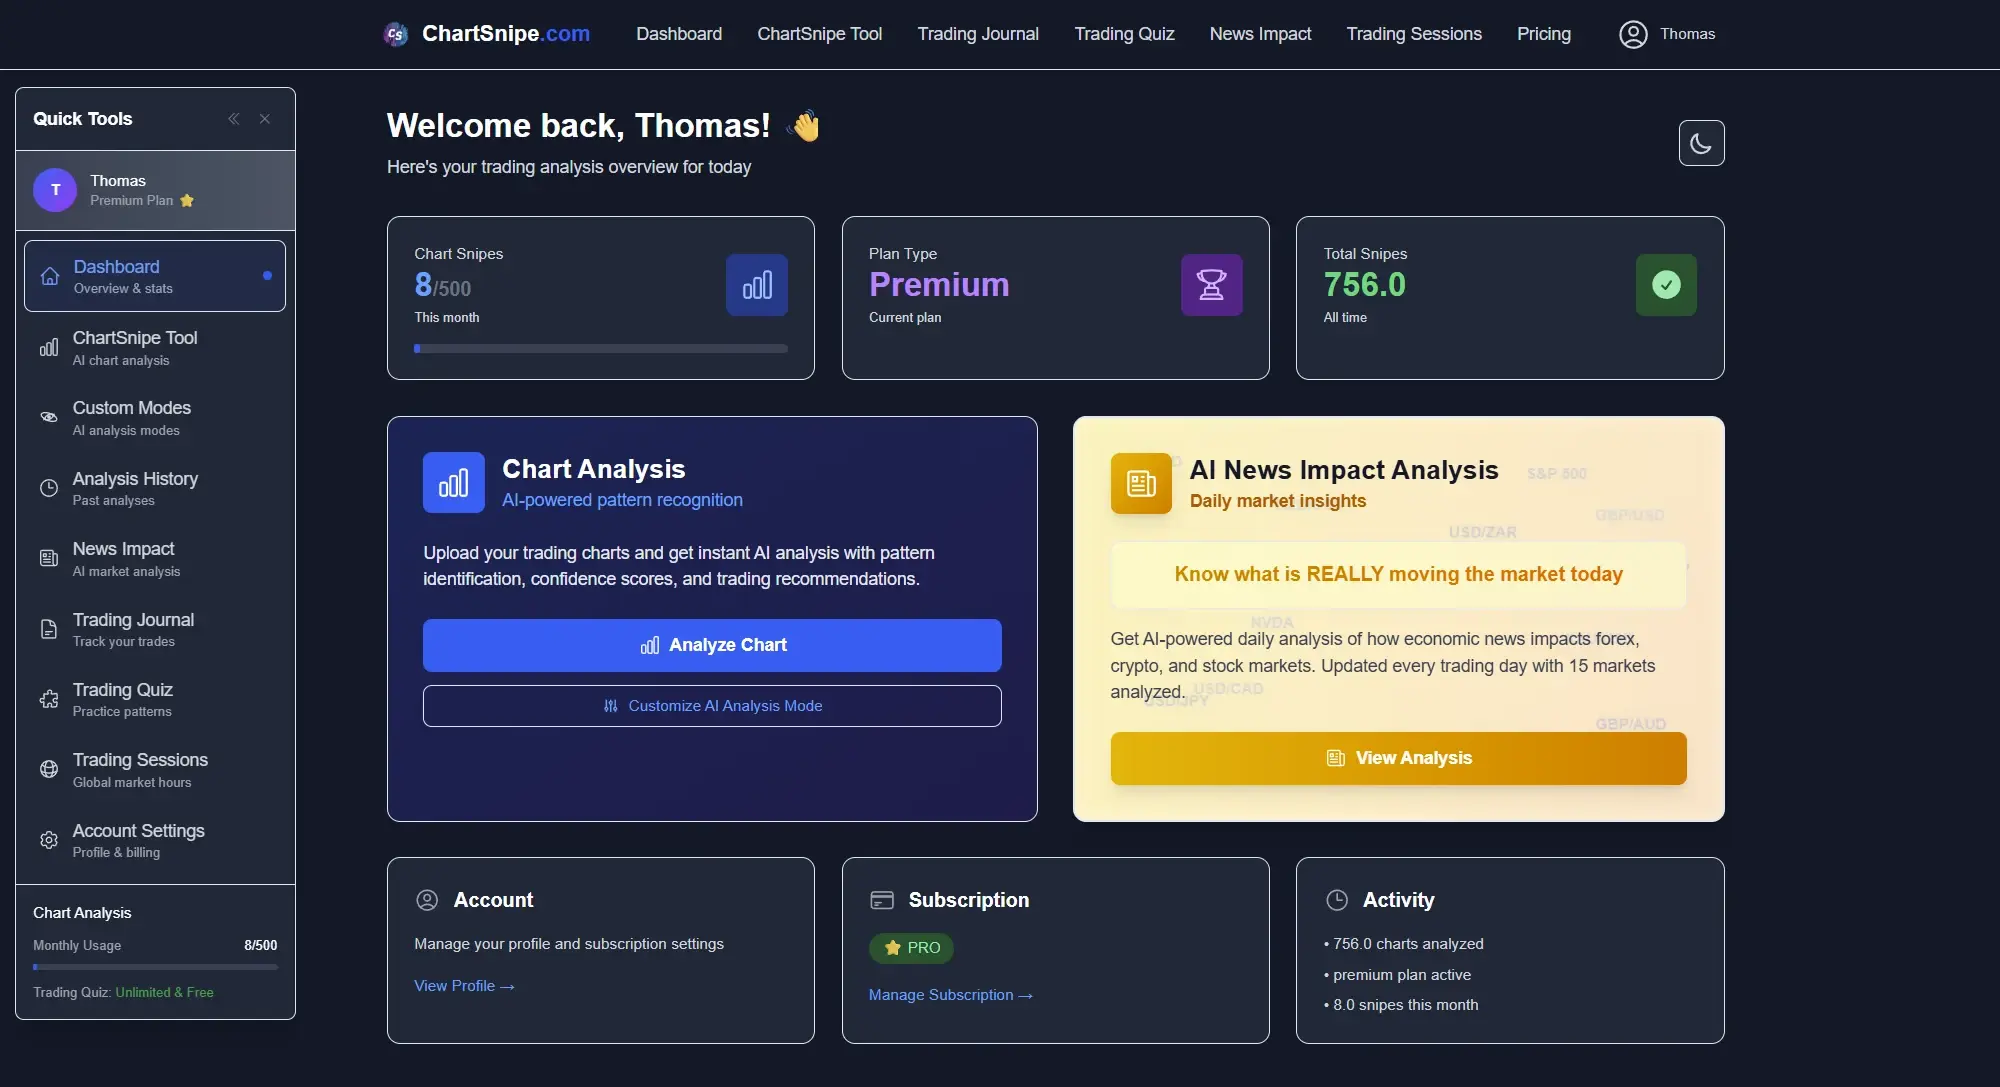
3. #1 ChartSnipe — The Purpose-Built Winner
Score: 47/50 · Pattern 9/10 · S/R 10/10 · Signal 10/10 · Live Data 10/10 · Speed 8/10
ChartSnipe is the only tool in this review that was built from the ground up to analyze chart screenshots for trading. Everything else is a general-purpose AI that happens to understand images. That difference matters more than almost anything else.

What makes it different
- Live prices for 32 instruments — ChartSnipe pulls live prices from MetaApi for 28 FX pairs, gold, BTC, S&P 500, and NASDAQ 100 every 5 minutes. The AI cross-references the screenshot against the current price before producing an analysis, which is why the support/resistance accuracy is close to perfect.
- 6 specialized analysis modes — Quick Snipe (fast bias), S/R Levels (pure level mapping), Full Snipe (complete trade plan with education), Liquidity Snipe (smart money concepts), Beat Another (compare your analysis to the AI), and a Custom Mode Creator for advanced users.
- Daily NewsImpact context — every day, ChartSnipe publishes a NewsImpact report covering 12 major instruments with bullish/bearish ranking. The chart AI reads this context when you request an analysis, so it knows if a central bank decision is about to invalidate your setup.
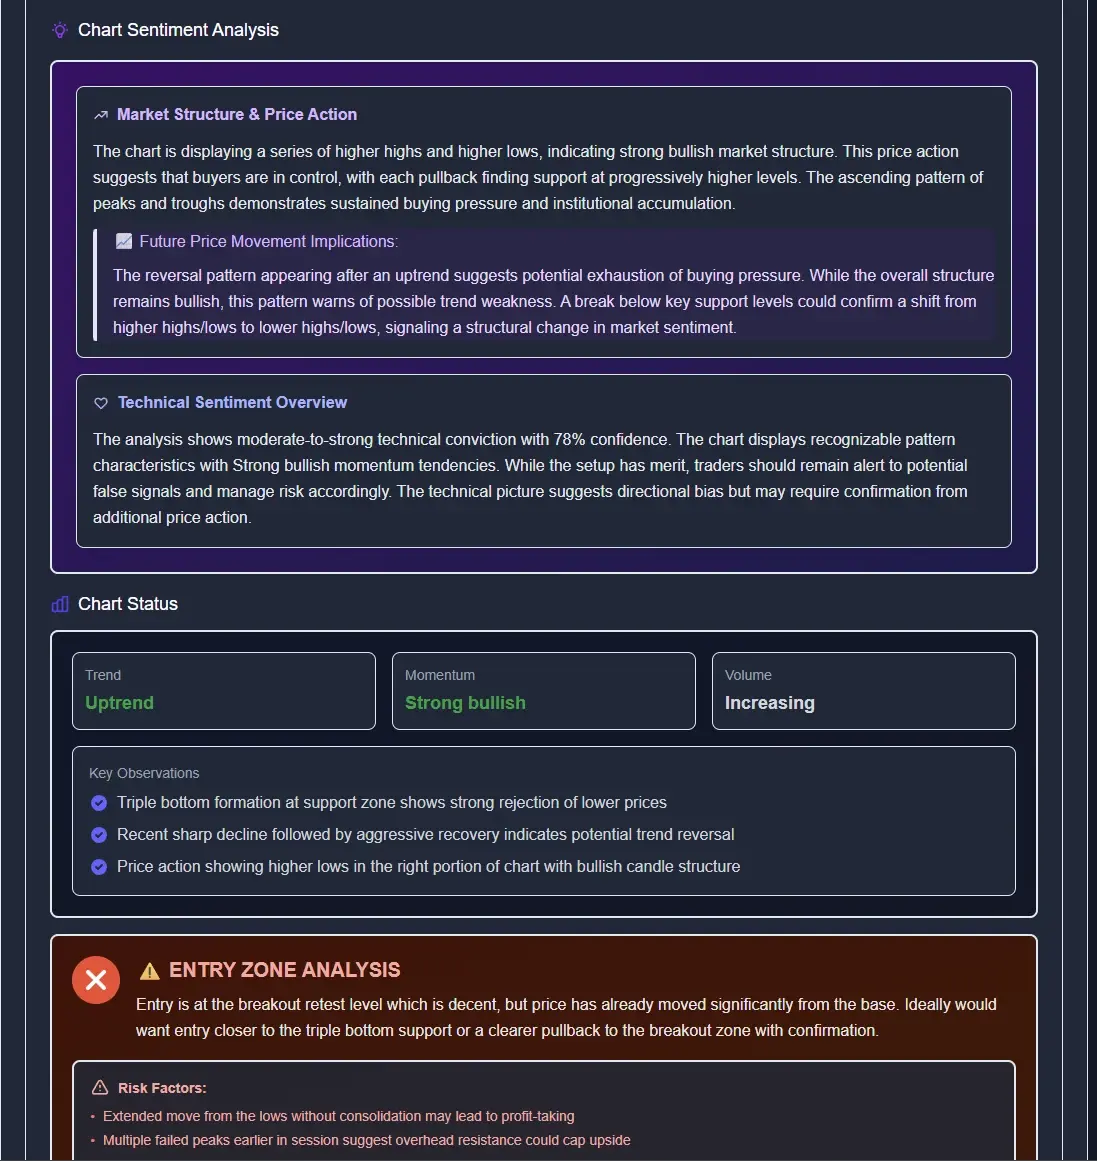
- Honest refusal to trade — this is rare. ChartSnipe will sometimes detect a valid pattern and still tell you not to enter because the current price is already too far from the ideal zone. Most other AI tools cheerfully recommend any trade you ask about.
How deep the customization goes
The 6 built-in modes are only half the story. ChartSnipe also ships a Custom Mode Creator that lets you pick the underlying AI engine (Standard, Strategy Specialist, Forex Snipe, Crypto Wizard, or Bull & Bear Battle), choose between Chart Pro and Chart Max output depth, write your own instructions, and toggle which indicators the AI should reason about — RSI, MACD, EMA, Bollinger Bands, ATR and more. This is the level of control a generic "upload and ask" chatbot simply cannot offer.
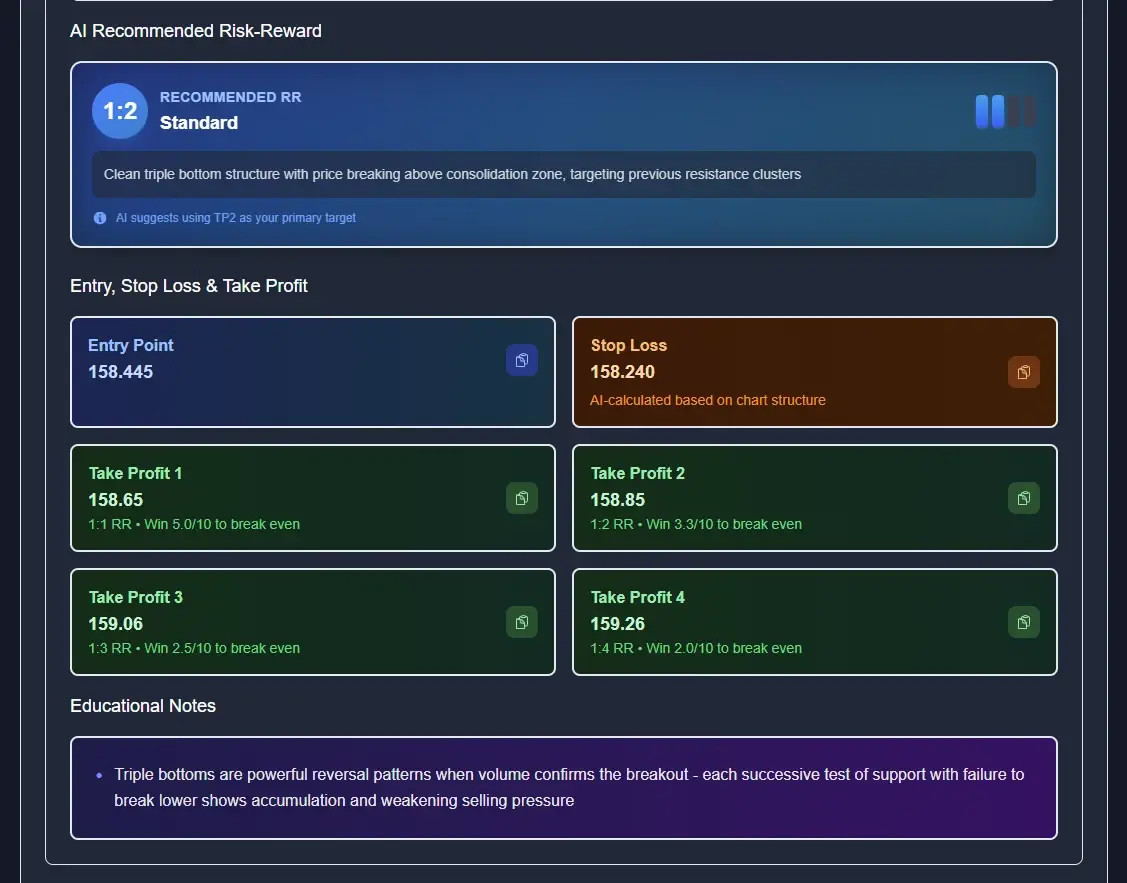
The output you get back is equally structured: a full trade setup panel with Entry, Stop Loss, and up to four Take Profit targets, each with its own risk-to-reward ratio. You can see an example in the screenshot below — a crypto setup with entry at 95,100, stop at 94,250, and TP1 at 95,950 marked as a 1.1RR trade. Compare that to a ChatGPT response that might say "look for a long around 95,000 with a stop below support" and the difference in precision is obvious.


Where it scored highest
ChartSnipe scored a perfect 10/10 on support and resistance accuracy. Across the 40 forex charts we tested, every level it called was within 0.1% of the actual level on the chart. This is because it does not guess the price from pixels — it queries live market data and matches the screenshot to real candles. General AIs fail this test constantly, sometimes calling "support at 1.0850" on a chart where price is trading at 1.0920.
It also scored 10/10 on signal clarity. Every response gives you a direction, an entry, a stop loss, and at least 2 take-profit levels with clear justification. The Liquidity Snipe mode specifically handles smart money concepts (order blocks, liquidity sweeps, fair value gaps) that general AIs struggle with badly.


Analysis history — every trade idea is saved
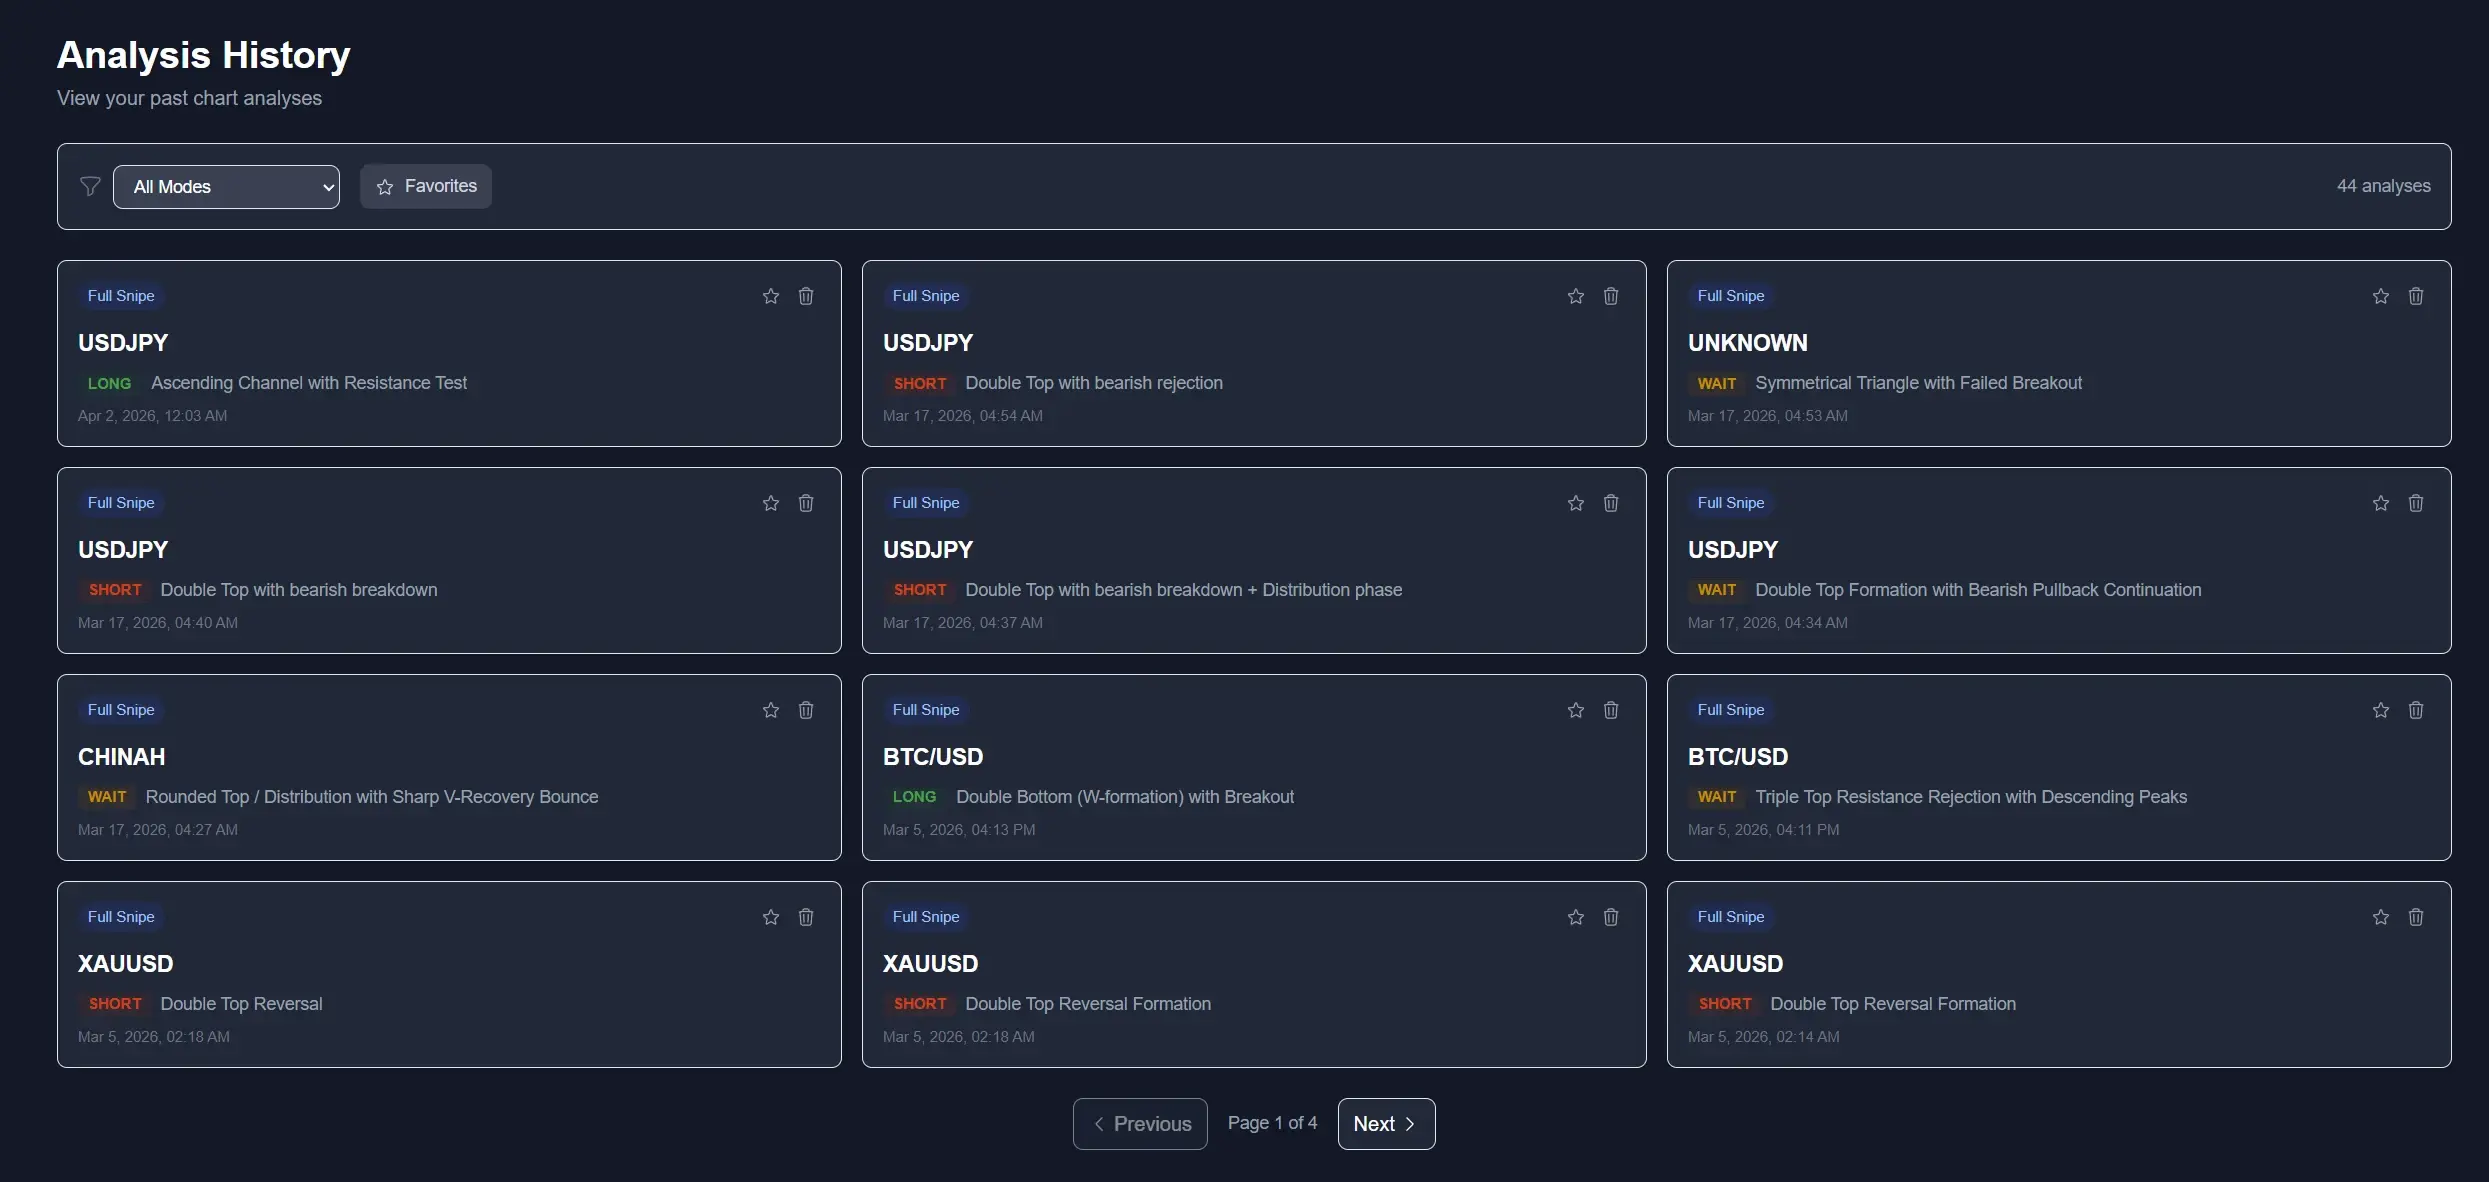
One thing we liked during testing that the general AIs do not offer at all: every ChartSnipe analysis is saved to a searchable history. You can scroll back through past runs, compare how the same pair behaved across multiple setups, and audit which patterns your tool has been identifying. In our account the history filled up quickly with real trades on USD/JPY, BTC/USD, XAU/USD and index CFDs — a mix of LONG, SHORT and WAIT verdicts with patterns like Double Top, Ascending Channel, and Triple Top Resistance Rejection, each timestamped.
This is a small detail that matters more the longer you use a tool. General AIs forget everything between sessions. ChartSnipe's history gives you a built-in trade journal you can actually learn from over time.
Where it lost points
Speed came in at 8/10, not 10/10. A Full Snipe analysis takes about 12 seconds because it runs three sequential passes (pattern, sentiment, trade plan). Quick Snipe is faster at around 4 seconds. Pattern recognition scored 9/10 — it occasionally misses very subtle inverse head-and-shoulders on lower timeframes. Nothing else in this review comes close to its overall score.
Best for: any trader who actually takes trades from chart screenshots. Serious forex traders benefit most because of the live price integration. See the full ChartSnipe tool or our in-depth 2026 chart analysis software review.
4. #2 ChatGPT Vision — Best General AI for Education
Score: 31/50 · Pattern 8/10 · S/R 4/10 · Signal 6/10 · Live Data 4/10 · Speed 9/10
ChatGPT with GPT-4o Vision is the benchmark general AI, and it is genuinely good at describing what it sees in a chart. You can upload a screenshot, ask "what pattern is forming?", and get a coherent, educational answer in under 5 seconds. For learning technical analysis, this is actually one of the best free tools available.
What it does well
- Very strong at naming classical chart patterns — double tops, head and shoulders, pennants, flags
- Excellent at explaining why a pattern is forming and what it typically means
- Fast responses, usually under 5 seconds
- Conversational — you can follow up, ask questions, iterate on analysis
- Free tier is generous enough to test regularly
Where it fails
Price-level accuracy was the killer. ChatGPT regularly invents price levels that look plausible but do not exist on the chart. In one test, we uploaded an EUR/USD chart showing clear support at 1.0820 and it confidently told us support was at 1.0850 — a 30-pip difference that would blow out your stop loss. This is not a model limitation you can fix by prompting better; it is a fundamental consequence of not having a live price feed.
It also wafffles on signal direction. Ask it "should I go long or short?" and it will usually give you a balanced "here are scenarios for both directions" answer, which is educationally fine but operationally useless. We wrote a full piece on this in does ChatGPT work for trading charts and a practical walkthrough in how to use ChatGPT to analyze a forex chart.
Best for: beginner traders learning pattern recognition, and anyone who wants an educational "tutor" rather than a trade execution tool.
5. #3 Claude (Anthropic) — Best Reasoning, Weakest Data
Score: 29/50 · Pattern 8/10 · S/R 4/10 · Signal 5/10 · Live Data 3/10 · Speed 9/10
Claude (specifically Claude Sonnet and Opus) has arguably the best reasoning about charts of any general-purpose AI. When you ask Claude why a pattern is forming, the response reads like a well-written analyst note. It considers multiple scenarios, weighs probabilities, and explains market structure better than ChatGPT does.
Strengths
- Excellent written reasoning about market structure and context
- More cautious and honest about uncertainty than ChatGPT
- Strong pattern recognition on clean chart screenshots
- Willing to say "I don't see a clear setup" instead of inventing one
Weaknesses
Same fundamental problem as ChatGPT: no live data. Claude cannot cross-reference the screenshot against real prices, so its support/resistance numbers are guesses based on pixel positions, which introduces meaningful errors. It is also even more reluctant than ChatGPT to give a concrete trade direction — the "honest about uncertainty" behavior that makes it a great reasoning partner is a weakness when you actually need to pick a side.
Best for: traders who want a second opinion on their own analysis and appreciate well-reasoned written responses over point-and-shoot signals.
6. #4 TradingView AI Copilot — Good Inside TradingView, Limited Outside
Score: 27/50 · Pattern 7/10 · S/R 6/10 · Signal 5/10 · Live Data 6/10 · Speed 3/10
TradingView has been rolling out their AI Copilot features throughout 2025 and 2026. If you already live in TradingView, the feature has one big advantage: it has direct access to the chart data, so it does not need to guess price levels from a screenshot. It knows the exact candles.
Strengths
- Native access to TradingView chart data — no pixel-level guessing
- Tight integration with TradingView indicators and drawings
- Reasonable pattern identification
Weaknesses
The feature is only available inside TradingView. You cannot upload an MT4/MT5 screenshot, a broker platform screenshot, or a chart from anywhere else. The analysis depth is also shallower than purpose-built tools — it tends to identify the obvious pattern and stop there, without producing a full trade plan. Speed was our biggest complaint: across our tests, responses routinely took 20–40 seconds, which feels slow compared to ChatGPT or ChartSnipe.
Best for: traders who already pay for TradingView Premium and never use another charting platform.
7. #5 Generic SaaS "Chart Analyzer" Clones — Thin Wrappers, Skip These
Score: 18/50 · Pattern 6/10 · S/R 3/10 · Signal 5/10 · Live Data 1/10 · Speed 3/10
If you search for "ai chart analyzer" you will find dozens of SaaS tools with polished landing pages, subscription paywalls, and impressive demo videos. We tested five of them (we are not naming individual products because the category is full of short-lived clones). Almost all of them are thin wrappers around GPT-4 Vision with a custom prompt. There is no moat.
Common problems
- Charge $19–49 a month for something you could do yourself by pasting a chart into free ChatGPT
- No live market data integration whatsoever
- No specialized modes — every chart gets the same generic "support at X, resistance at Y" template
- Slow (5–30 seconds) because they re-route the request through their own backend
- Inconsistent quality — the same chart uploaded twice often produces contradictory answers
We scored the category collectively at 18/50. Individual tools varied from 14/50 to 22/50 but none of them justified their subscription price compared to using ChatGPT Vision directly for free.
Recommendation: skip this category entirely. If you want free, use ChatGPT Vision. If you want purpose-built, use ChartSnipe. Thin wrappers charge you money for worse output than either.
8. #6 Google Gemini — Decent Vision, No Trading Specialization
Score: 22/50 · Pattern 6/10 · S/R 3/10 · Signal 4/10 · Live Data 3/10 · Speed 6/10
Google Gemini (2.0 and 2.5 Pro) has strong general vision capability — it can read text in images, identify objects, and describe scenes well. For trading charts specifically, though, it lagged noticeably behind ChatGPT and Claude in our tests.
Observations
- Often misidentifies chart patterns, particularly more advanced ones like wedges and pennants
- Price-level accuracy is no better than ChatGPT and sometimes worse
- Tends to produce very generic trading advice regardless of what is actually on the chart
- Free to use, which is its main redeeming feature
- Speed is fine — around 6 seconds per response
Gemini has improved a lot throughout 2025 and 2026, and the gap to ChatGPT has narrowed. But for chart analysis specifically, we did not find a single test case where Gemini outperformed ChatGPT, and it never came close to ChartSnipe.
Best for: casual users who already use Gemini for other tasks and want to occasionally throw a chart at it for a second opinion.
9. Honest Comparison & Recommendation
Here is the full feature matrix across all 6 tools. We tried to be as fair as possible — each tool has things it does well.
| Feature | ChartSnipe | ChatGPT Vision | Claude | TradingView AI | SaaS Clones | Gemini |
|---|---|---|---|---|---|---|
| Live Data | Yes (32 instruments) | No | No | Yes (TV only) | No | No |
| News Context | Daily NewsImpact | No | No | No | No | No |
| Analysis Modes | 6 specialized | 1 (generic) | 1 (generic) | 1 | 1 | 1 (generic) |
| Pattern Accuracy | 9/10 | 8/10 | 8/10 | 7/10 | 6/10 | 6/10 |
| S/R Accuracy | 10/10 | 4/10 | 4/10 | 6/10 | 3/10 | 3/10 |
| Forex Support | Excellent | Good | Good | Good | Poor | Fair |
| Crypto Support | Yes (BTC live) | Yes | Yes | Yes | Varies | Yes |
| Stocks Support | Yes | Yes | Yes | Yes | Varies | Yes |
| Free Tier | Yes (2/mo) | Yes | Yes | No | Rarely | Yes |
| Starting Price | $20/mo | $20/mo | $20/mo | $15/mo | $19–49/mo | Free / $20 |
| Final Score | 47/50 | 31/50 | 29/50 | 27/50 | 18/50 | 22/50 |
Which one should you actually use?
If you are a beginner learning pattern recognition
Start with free ChatGPT Vision as a teaching assistant, then upgrade to ChartSnipe's free tier (2 analyses/month plus unlimited Trading Quiz) to start practising on real trade plans.
If you are a day trader taking 3+ setups a day
ChartSnipe Pro ($20/month, 120 analyses) is the obvious choice. The live data and news context alone will save you from bad entries several times a month.
If you are a swing trader taking 5–10 trades a week
ChartSnipe Pro is still the right fit. Use Full Snipe mode for every setup and pair it with the daily NewsImpact report to avoid holding through major events.
If you are a news trader
ChartSnipe is the only tool in this review with a dedicated news impact layer. See our AI economic calendar analysis guide for how to combine it with the chart screenshot tool.
If you only trade inside TradingView and never leave
TradingView AI Copilot is a reasonable built-in option. Just know that a purpose-built tool like ChartSnipe will still outperform it on trade-plan depth.
Frequently Asked Questions
What is the best AI that analyzes chart screenshots in 2026?
ChartSnipe is the best purpose-built AI chart screenshot analysis tool in 2026. Unlike general-purpose AIs like ChatGPT Vision, Claude, or Gemini, ChartSnipe integrates live market data for 32 instruments, 6 specialized analysis modes, and daily news impact context. It scored highest across pattern accuracy, support/resistance accuracy, and speed in our testing.
Can I just use ChatGPT or Claude to analyze my trading charts?
You can, but both have serious limitations. They can describe what they see in a chart screenshot (patterns, general structure) but they cannot access live prices, they often invent or hallucinate price levels that do not exist, and they have no daily news context. For education and pattern learning they are useful; for actual trading decisions they are unreliable. Purpose-built tools like ChartSnipe solve these problems.
How does an AI chart analyzer actually read a screenshot?
Modern AI chart analyzers use vision models to identify candlestick structure, trend lines, price scales, indicator overlays, and chart patterns. The best tools combine this vision layer with a trading-specific reasoning layer that knows the context of each instrument, current market prices, volatility conditions, and recent news. Generic AIs stop at the vision layer; purpose-built tools continue to the reasoning layer.
Is there a free AI chart analyzer?
Yes. ChartSnipe has a free tier with 2 chart analyses per month plus unlimited Trading Quiz access. ChatGPT and Claude both offer free tiers with vision capabilities. Google Gemini is free to use. However, only ChartSnipe is purpose-built for trading, so the free tier gives you access to specialized analysis modes, not a generic vision model.
Which AI is best for forex chart analysis specifically?
For forex specifically, ChartSnipe is the clear winner because it tracks live prices for all 28 major FX pairs plus the USD index context, computes a currency strength index from 7 majors, and integrates daily news impact for central bank events. General AIs like ChatGPT or Claude cannot reliably call out support and resistance at real forex price levels because they have no price feed.
Do AI chart screenshot tools work for crypto and stocks as well?
Yes. ChartSnipe supports BTC, the S&P 500, and the NASDAQ 100 with live price feeds, and can analyze any chart screenshot you upload regardless of market. For crypto and stocks specifically, live price integration matters less than for forex (spreads are wider, patterns are more obvious), but news context still matters which is why ChartSnipe still outperforms generic AIs.
Final Verdict
After 100 test charts, five scoring dimensions, and three months of head-to-head comparison, the ranking is clear. ChartSnipe is the best AI chart screenshot analysis tool in 2026 because it is the only one built specifically for trading — everything else is a general-purpose AI that happens to understand images. For beginners, ChatGPT Vision remains a great educational tool. For serious traders, anything less than a purpose-built tool with live market data is a compromise you do not need to make.
If you want to try it yourself, ChartSnipe's free tier gives you 2 full chart analyses per month with no credit card. Upload your own screenshots and compare the output against whatever you are currently using. The difference is usually obvious on the first chart. Check pricing or go straight to the chart analysis tool to start.
Sources & Further Reading
- • OpenAI — official ChatGPT Vision documentation and model capabilities
- • Anthropic — Claude vision model reference and usage guidelines
- • TradingView Ideas — community chart analyses used as a scoring baseline
- • Forex Factory — trader community discussions on AI tool accuracy
- • Investopedia — reference for chart pattern definitions used in scoring
Related Articles
Does ChatGPT Actually Work for Trading Charts?
We tested ChatGPT on 100 real chart screenshots — here is where it works and where it hallucinates.
Best AI Trading Chart Analysis Software in 2026
A broader look at the AI chart analysis software landscape — full platforms, not just vision models.
Claude vs ChatGPT vs ChartSnipe
Head-to-head comparison of the three most popular AI chart analysts for traders in 2026.
Written by the ChartSnipe Team
ChartSnipe is an AI-powered chart screenshot analysis tool and daily AI news impact analysis platform for forex, gold, Bitcoin, S&P 500, and Nasdaq traders. Our team combines deep experience in technical analysis, AI vision models, and live market data across 32+ instruments to deliver actionable trading insights.
Try the #1 AI chart screenshot analyzer free
2 free analyses every month. No credit card required. Live data for 32 instruments included.
Start Free with ChartSnipeWritten by the ChartSnipe Team — We spent three months testing 6 AI chart screenshot tools on 100 charts so you do not have to.