Support and Resistance: 12 Types Every Forex Trader Should Know
Horizontal, trendline, moving average, Fibonacci, previous day high/low, round numbers, VWAP, pivots, order blocks, volume profile POC — each with a clean chart diagram and the exact setup it belongs to.
Every trader learns the same sentence on day one: support is where price stops falling, resistance is where price stops rising. It is technically correct and almost completely useless. What actually matters is the type of support or resistance, because each type is built from different order flow, tested by different participants, and respected under different conditions.
This guide walks through the ten forms of support and resistance a professional forex trader actually uses — starting with the horizontal lines a first-year retail trader draws, and ending with the volume profile point of control institutional desks trade around. Each one comes with a chart diagram and a clear answer to the only question that matters: when is this level worth trading, and when is it noise? If you want to see every major FX instrument mapped with live prices and AI-ranked directional context, the ChartSnipe dashboard is where everything in this guide gets applied in real time.
Key Takeaways
- →Horizontal lines off obvious swing highs and lows are still the single most powerful form of S/R — everything else is confluence.
- →Static levels (horizontal, round numbers, PDH/PDL, pivots) suit limit orders. Dynamic levels (trendlines, MAs, VWAP) suit pullback entries in trends.
- →Fibonacci 61.8 and 78.6 are the only retracement levels worth entering at — the rest are decoration unless they line up with structure.
- →VWAP owns intraday pullbacks on institutional pairs. Previous day high and low own the first two hours of London.
- →Order blocks and volume profile POC are real, but only when they line up with a horizontal level or a previous session extreme.
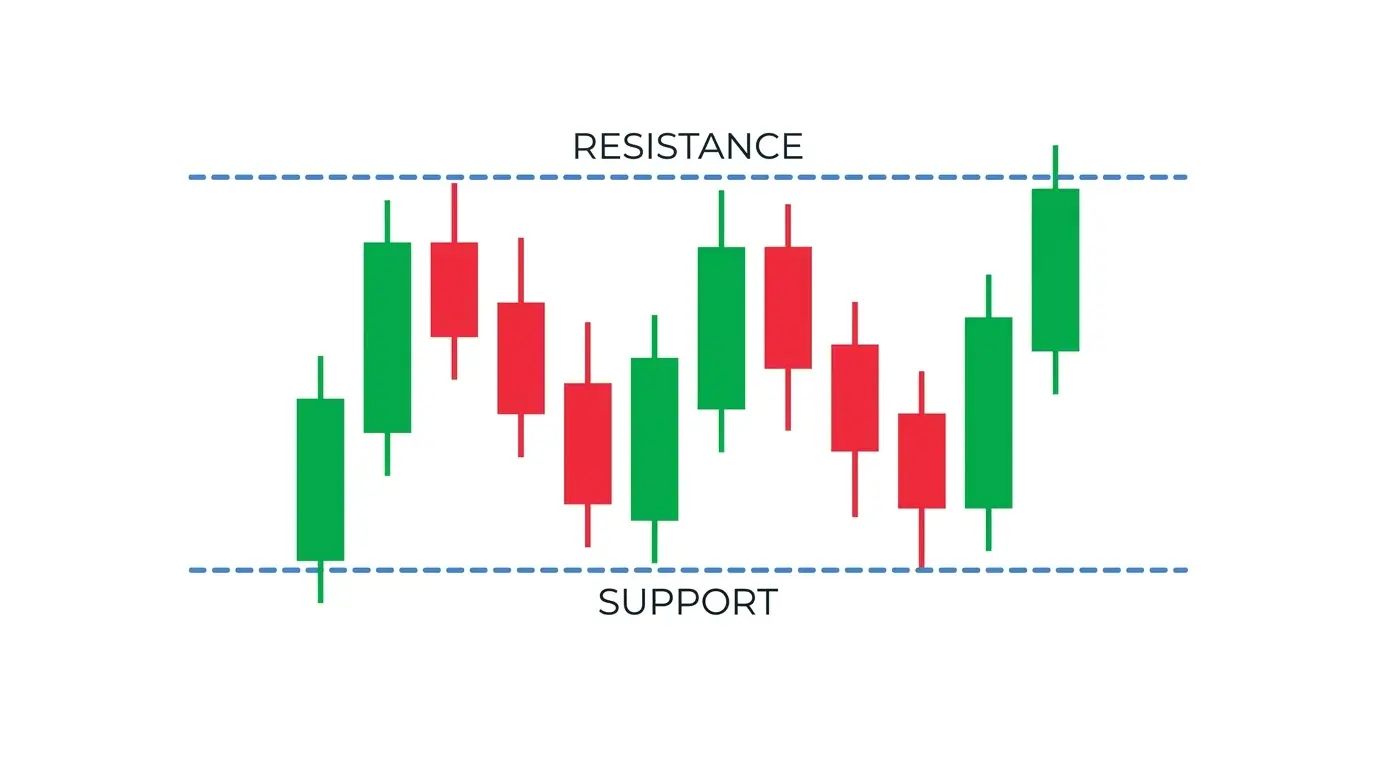
1. Horizontal Support and Resistance
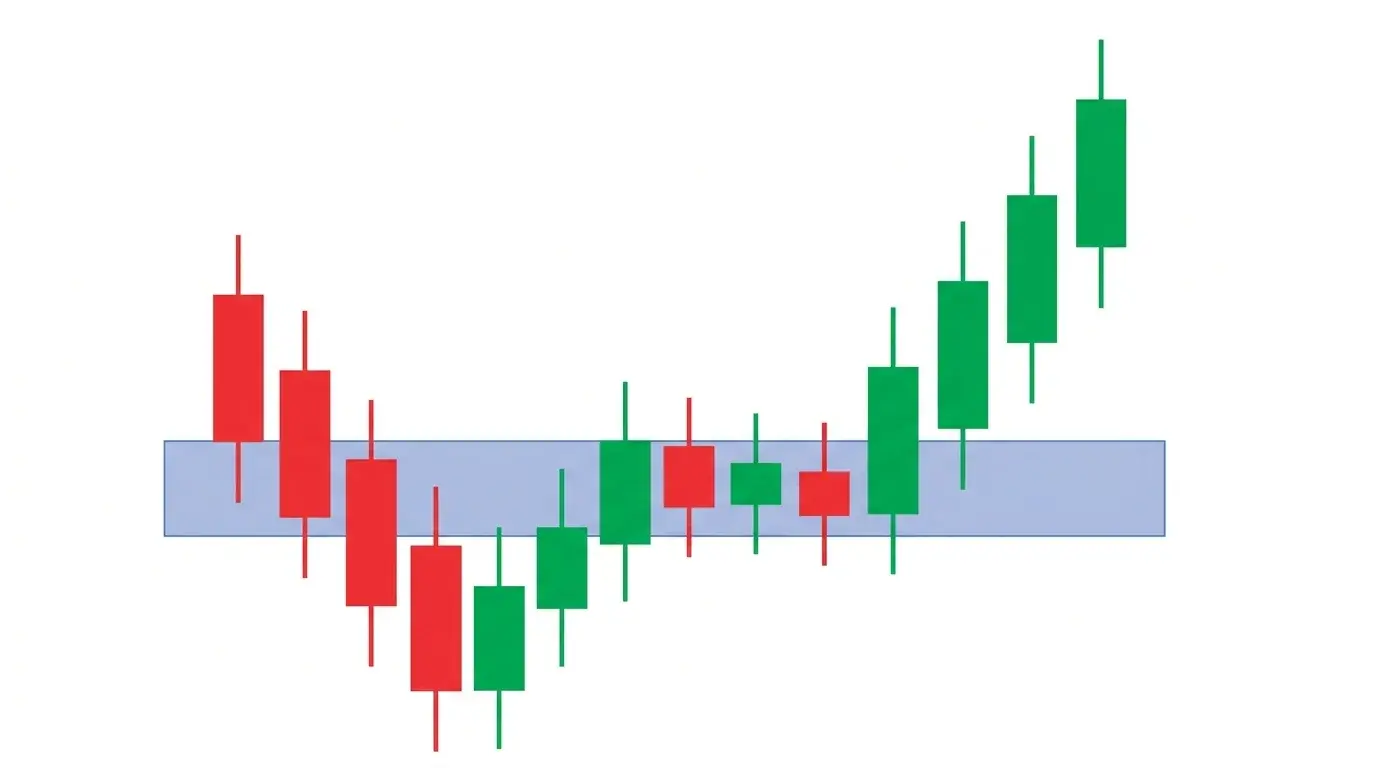
Horizontal S/R is the foundation every other form of support and resistance sits on top of. You draw it by connecting two or more obvious swing highs (for resistance) or two or more obvious swing lows (for support). The line extends to the right and becomes a reference every time price returns to it. It is the first thing an algo sees and the last thing a discretionary trader forgets.
Why does it work? Because every trader who got filled at that price is watching it. Longs who bought there will defend it on a retest. Shorts who entered there will look to add. Market makers who built inventory at the level will lean against it. This is not mysticism — it is accumulated order flow, which is the only reason any technical level has ever worked in the history of markets.
The rule that separates beginners from professionals: the more times a horizontal level has been tested without breaking, the more fragile it becomes, not the more reliable. Each test consumes resting orders. By the fourth or fifth touch, the level is usually hours away from breaking. Trade the second and third test. Fade the seventh at your own risk.
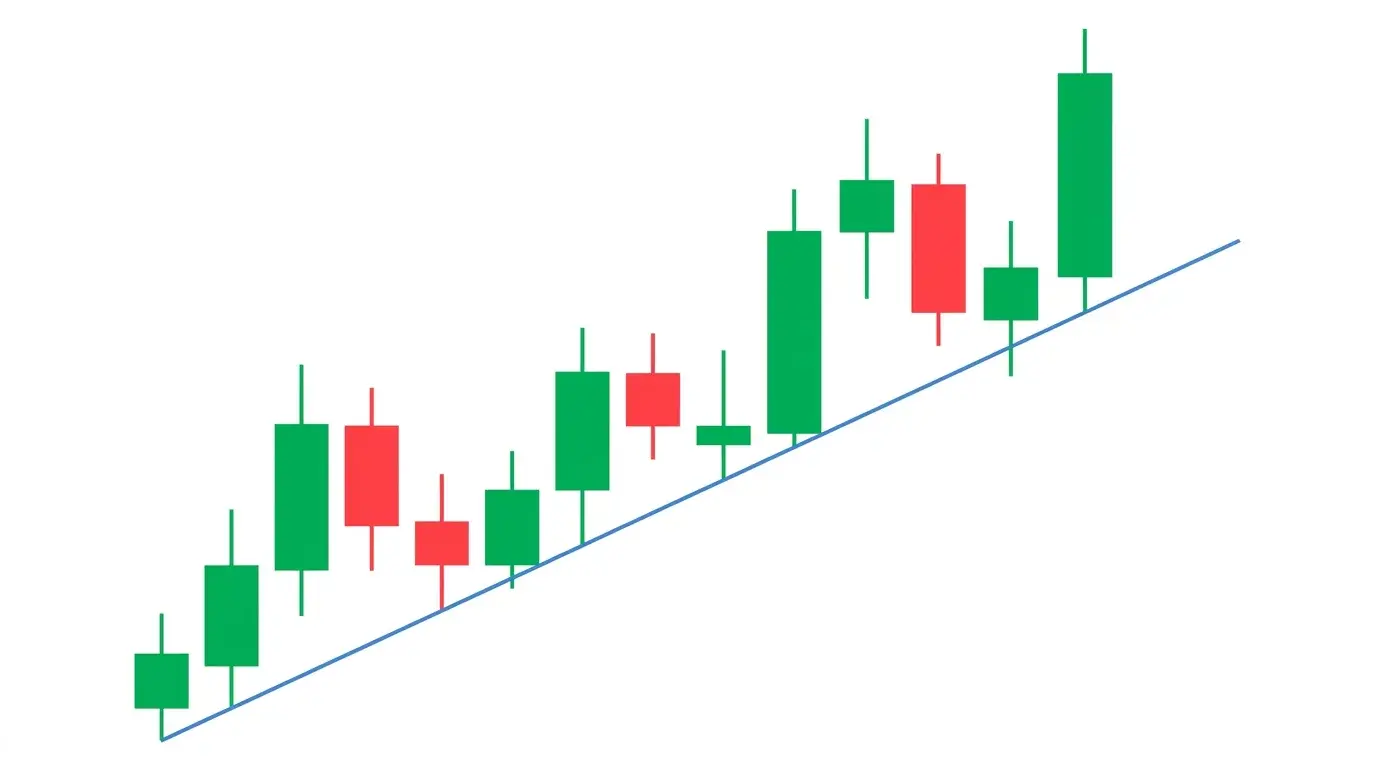
2. Trendline Support and Resistance
A trendline is a horizontal level rotated at an angle. In an uptrend you draw it under two or more higher lows and the market pulls back to it on every impulse. In a downtrend you draw it above two or more lower highs. The line is a dynamic anchor that moves with price instead of staying fixed, which makes it ideal for trend continuation setups where every pullback needs a different entry.
The most common trendline mistake is forcing the line to fit. If you have to cheat a touch by half a pip or ignore a wick to keep the line alive, it is not a trendline — it is a wish. Real trendlines connect real extremes cleanly. They break cleanly too. When price closes beyond a valid trendline on a higher-timeframe close, the trend is almost always over.
Trendlines become much more powerful when they converge with horizontal support. An uptrend line meeting a prior swing high that has flipped to support is where institutional desks scale in. That confluence is worth ten times more than either level alone. Anything less is just a line on a chart.
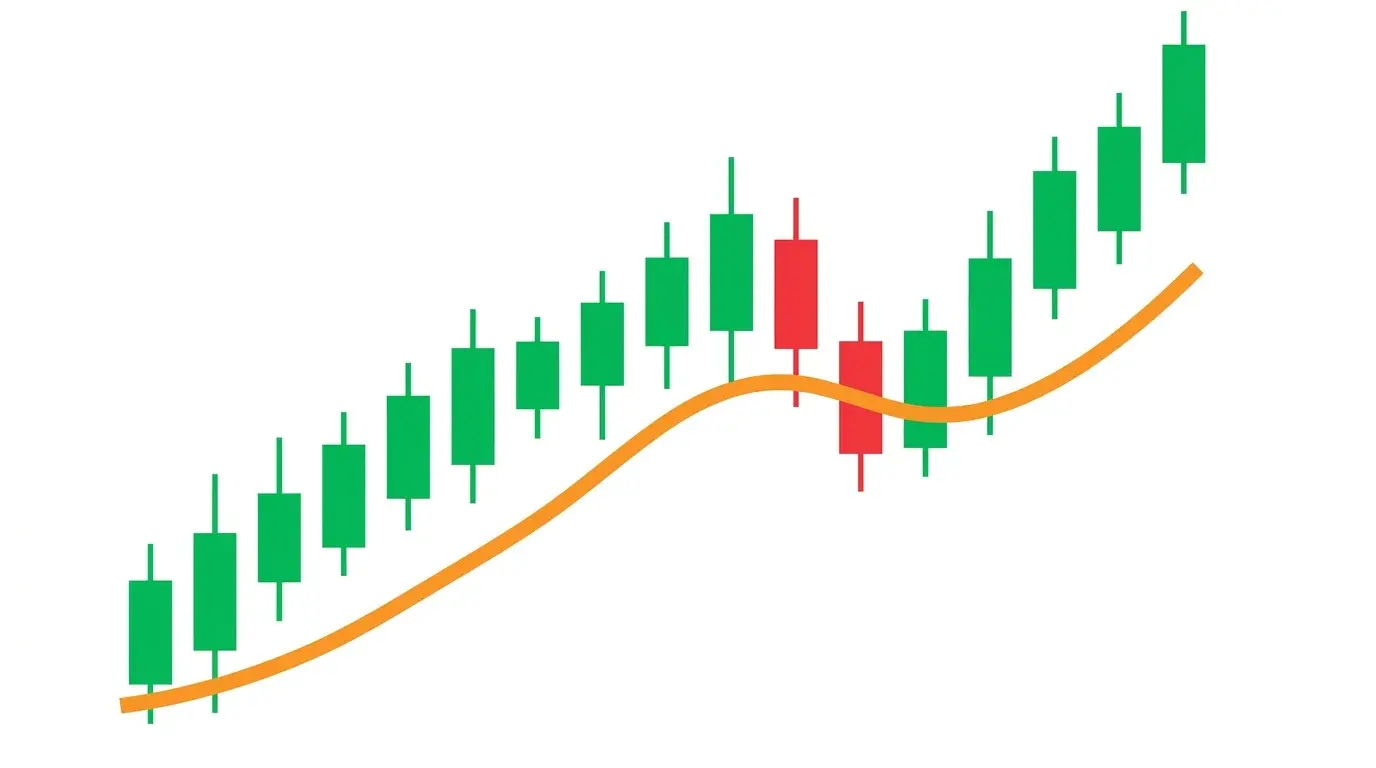
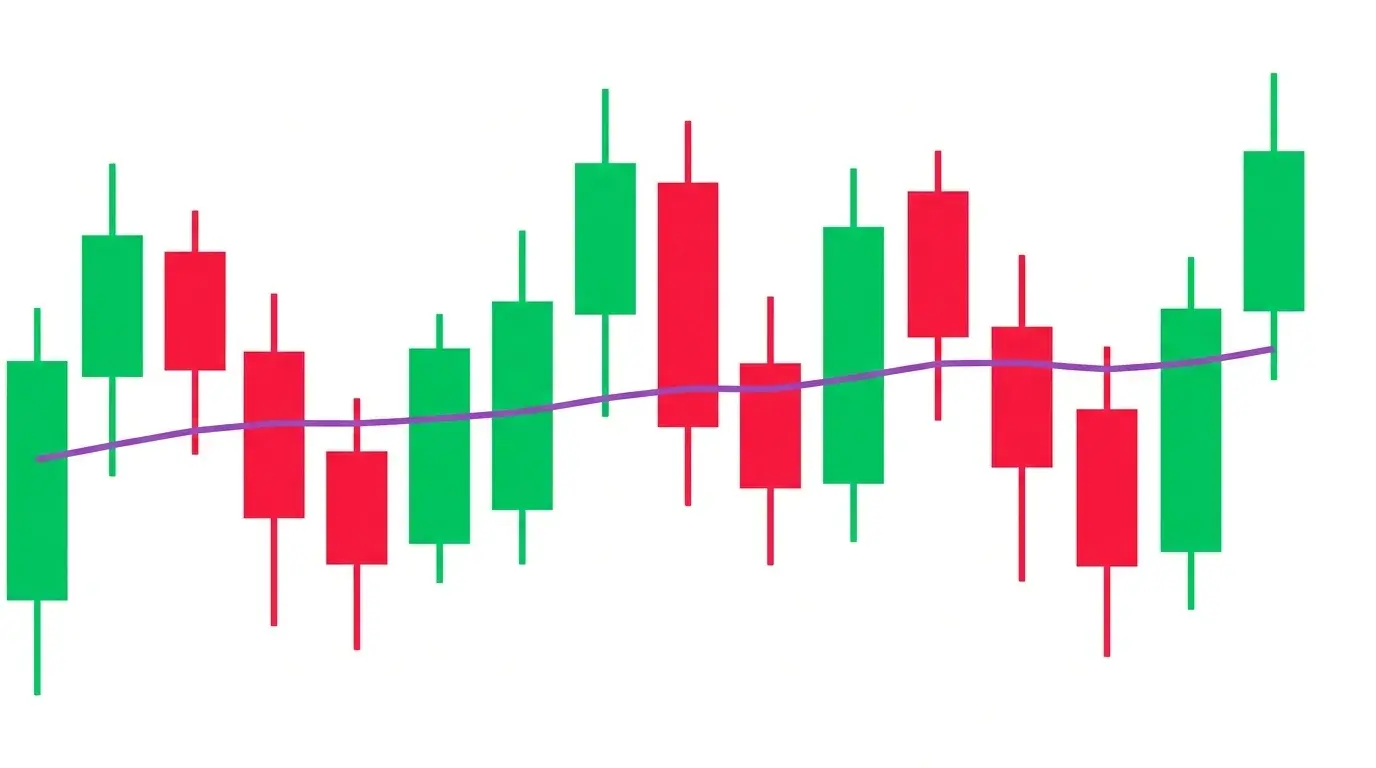
3. Moving Average Support (SMA/EMA 20, 50, 200)
Moving averages are dynamic support and resistance that millions of traders share. The three that actually matter in forex are the 20 EMA, the 50 SMA, and the 200 SMA. The 20 EMA catches short-term momentum pullbacks in strong trends. The 50 SMA is the intermediate trend reference watched by almost every institutional desk. The 200 SMA is the long-term regime divider — above it is a bull market, below it is a bear market.
The key insight nobody explains: moving averages only work as support or resistance when the market is trending. In a range they get chopped up, painted over, and ignored. If price is grinding sideways between two horizontal levels, every MA on the chart becomes noise. Once the range breaks and a real trend develops, the 20 EMA suddenly becomes meaningful again.
For trend-pullback entries, the 50 SMA on the 4-hour chart is the single highest-win-rate dynamic level in retail forex. Major pairs like EUR/USD and GBP/USD respect it cleanly during sustained trends, and the pullback-to-50-SMA setup has been a staple of prop-firm evaluation strategies for a decade.
4. Fibonacci Retracement Levels (23.6, 38.2, 50, 61.8, 78.6)
Fibonacci retracement draws five horizontal lines between a swing low and a swing high at the 23.6%, 38.2%, 50%, 61.8%, and 78.6% retracement levels. The theory is that markets retrace impulse moves in ratios derived from the Fibonacci sequence. The practice is messier: only two of those five levels are genuinely tradable, and both of them work for the same reason horizontal S/R works — enough traders watch them to make them self-fulfilling.
The two levels that matter are 61.8% (the golden ratio) and 78.6% (the deep retrace). These are the levels where a trend-continuation trader wants to buy the dip in an uptrend or sell the rally in a downtrend. The 23.6% and 38.2% are usually too shallow to be meaningful — price barely pulls back before resuming. The 50% is technically not a Fibonacci ratio at all, but it works anyway because a halfway retrace is an obvious psychological midpoint.
As with every advanced S/R type, Fib alone is weak. Fib plus horizontal plus a moving average is where institutional desks load up — the cluster of independent signals at one price is what actually attracts the order flow.
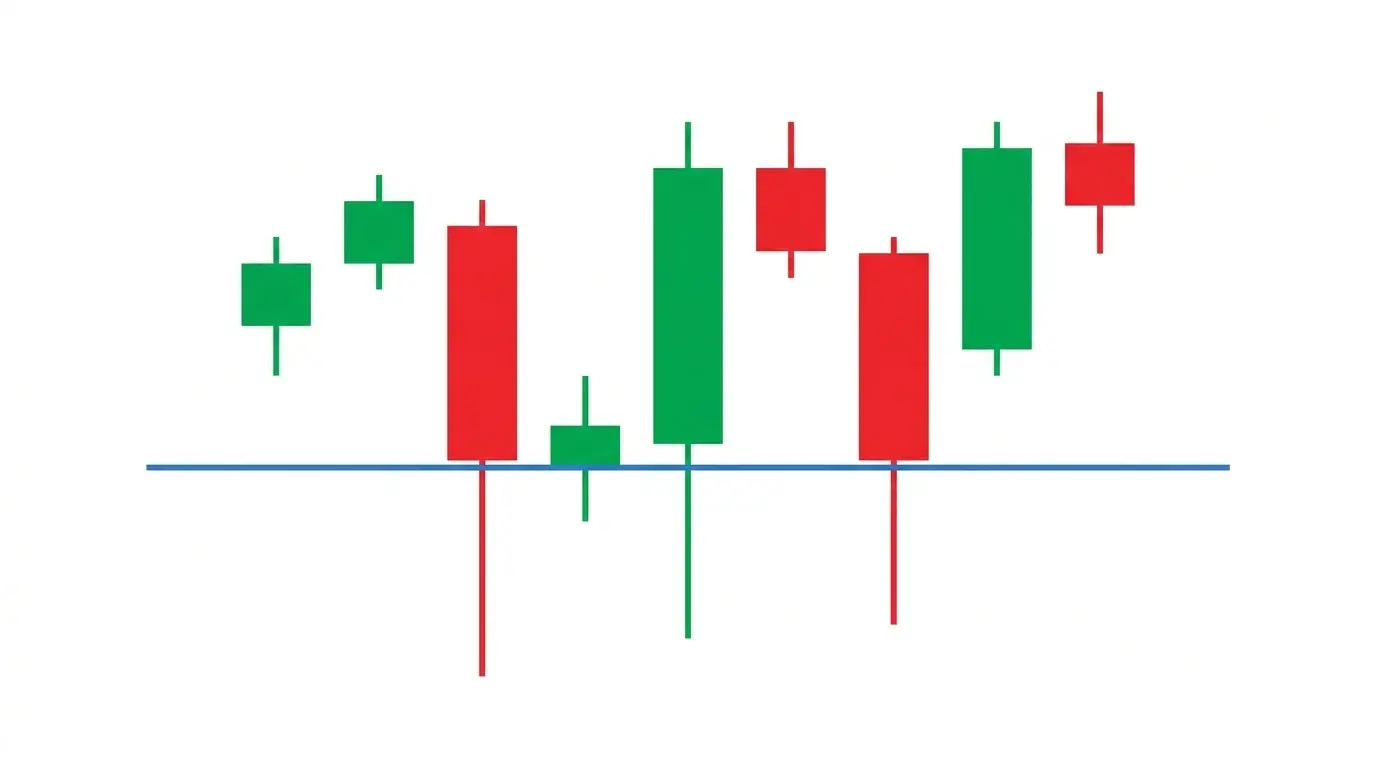
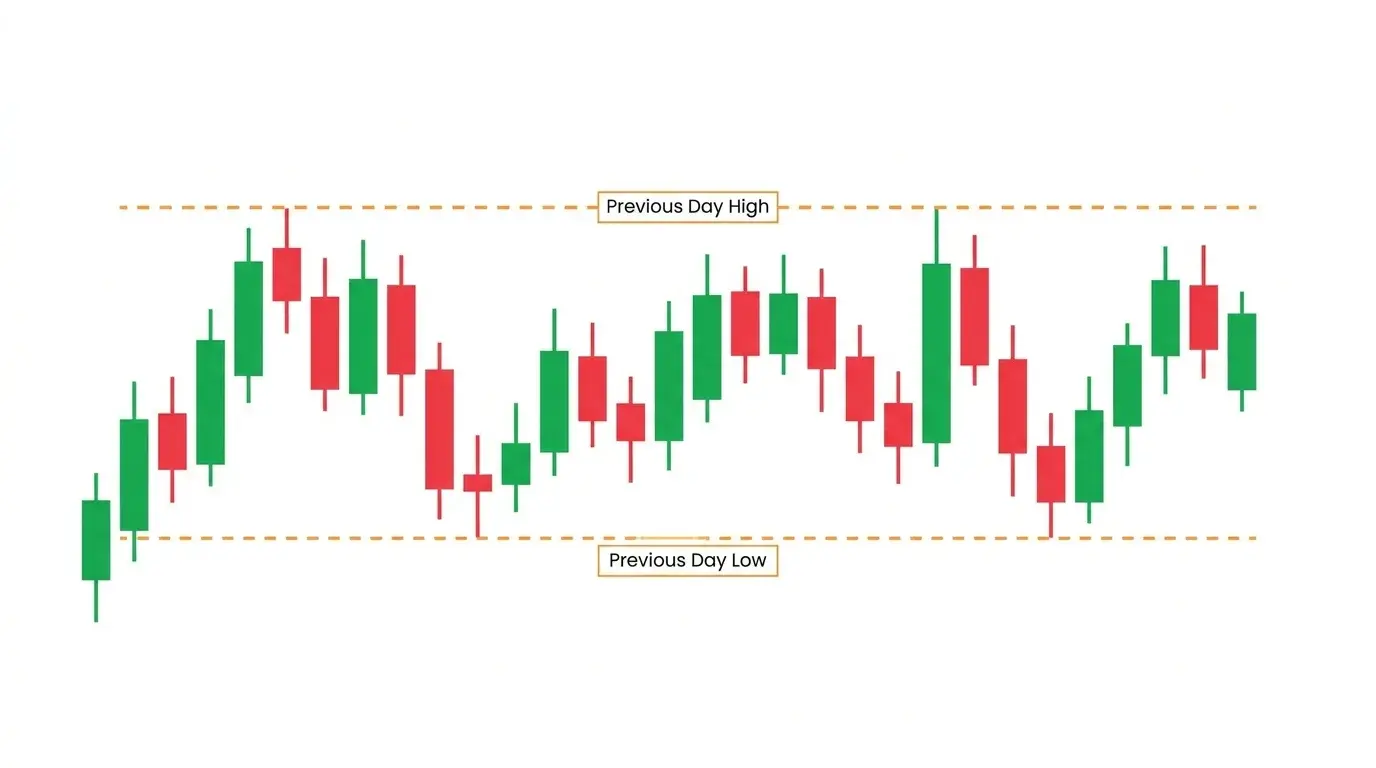
5. Previous Day High and Previous Day Low (PDH/PDL)
The previous day high and previous day low are two of the most ruthless intraday levels in forex. They are objective, they are visible on every platform, and they are the first two reference points every prop desk marks before London opens. PDH is immediate resistance; PDL is immediate support. Their power comes from the fact that yesterday's extremes are where stop losses from overnight positions are stacked.
The classic intraday play is the PDH/PDL sweep. Price runs above the previous day high, tags the stop cluster sitting just beyond it, and reverses hard back into the range. This is a textbook liquidity grab and it happens on major pairs nearly every London open. If you want a deeper dive on the mechanics, our guide to smart money concepts and liquidity walks through the full setup.
On trending days the opposite happens — PDH gets sliced cleanly and becomes the intraday pivot. The distinction between a sweep and a break comes down to the higher timeframe bias and whether the PDH lines up with any other horizontal S/R. If it does, expect rejection. If it sits in empty space, expect a breakout.
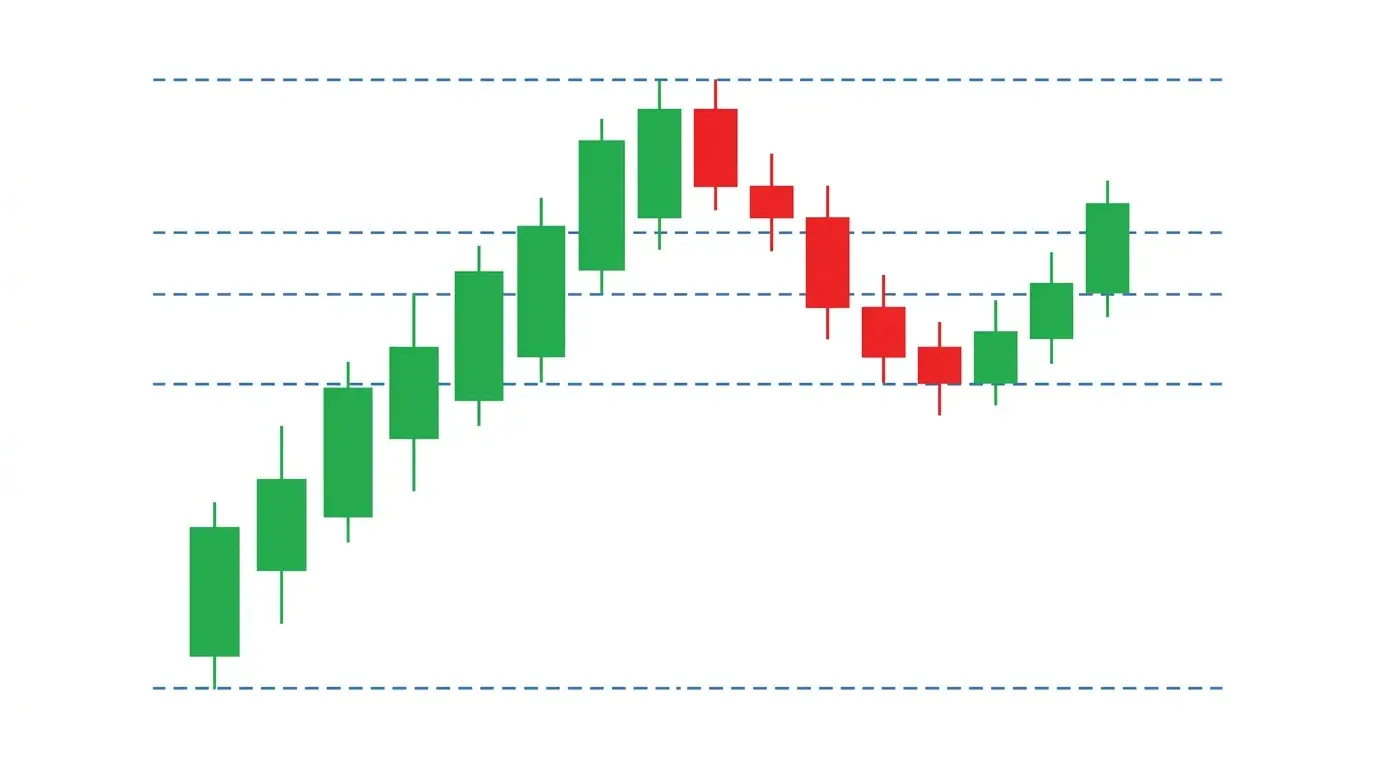
6. Round Numbers and Psychological Levels
Round numbers are the dumbest form of support and resistance that still works. 1.1000 on EUR/USD. 150.00 on USD/JPY. 2000 on gold. 20000 on the Nasdaq. There is no mathematical reason price should respect these levels, and yet it does, every cycle, without fail. The explanation is entirely psychological: humans write round numbers on sticky notes. Fund managers set profit targets at round numbers. Option strikes cluster at round numbers. Stop losses get placed one pip above or below them.
The interesting part is that the magnetism of round numbers cuts both ways. Before price reaches 1.1000 from below, it often gets pulled toward it as algos and traders anticipate the level. Once 1.1000 trades, the orders unwind and price either rejects sharply or blows through on a stop run. The approach is magnetic, the reaction is binary.
The way to actually use round numbers is as confluence amplifiers, not standalone triggers. A round number on its own is a coin flip. A round number that lines up with a prior swing high, a 200 SMA, and the previous day high is a setup. Trade the cluster, not the number.
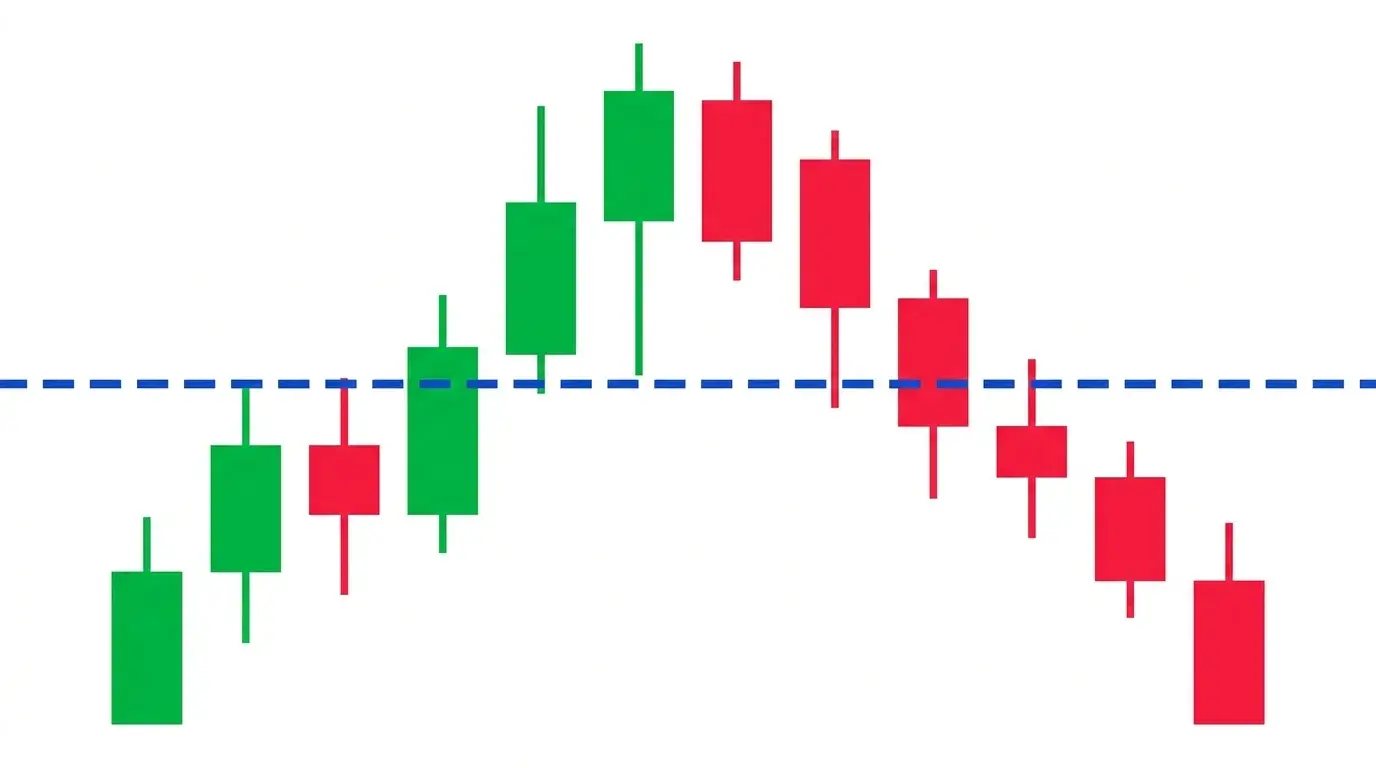
7. VWAP as Intraday Support and Resistance
VWAP — volume-weighted average price — is the level every institutional intraday trader benchmarks against. The number represents the average price a unit traded at for the session, weighted by volume. If you bought above VWAP you are underwater versus the session average; if you sold above it, you are ahead. Fund managers get paid on their fills relative to VWAP, which means the level gets actively defended by real money.
For retail traders the practical takeaway is simple: in a trending session, price pulls back to VWAP and bounces. In a ranging session, price oscillates around VWAP without committing. The direction of the lean — above or below — tells you whether the session is bullish or bearish before any other signal fires. VWAP flipping from support to resistance is often the earliest intraday trend-change signal you will get.
VWAP is most useful on pairs with concentrated institutional volume — EUR/USD, GBP/USD, USD/JPY, and gold. On exotic crosses the volume is too fragmented for VWAP to be meaningful. For the pairs it works on, it is arguably the single best dynamic intraday level in the book.
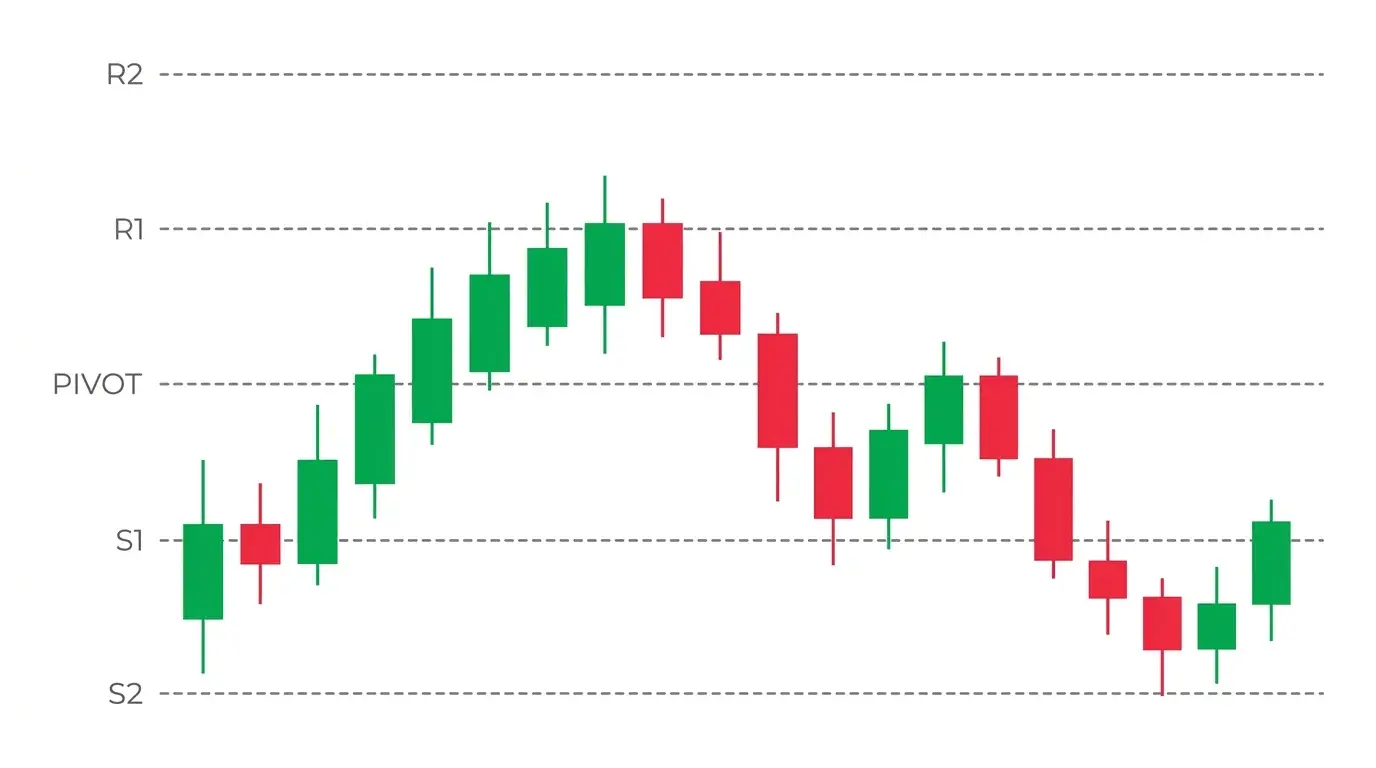
8. Daily Pivot Points (Pivot, R1/R2, S1/S2)
Floor pivots are five horizontal levels calculated from yesterday's high, low, and close. The central pivot point is the midpoint of the previous day's range; R1 and R2 are resistance levels above; S1 and S2 are support levels below. They get calculated once at the session rollover and stay fixed for the next 24 hours. Every professional intraday trader has them on their chart, which is the only reason they work.
The rules of thumb that actually hold: price opening above the pivot and holding is bullish for the session. Price opening below and holding is bearish. S1 and R1 are the most frequently tagged levels — most sessions fail to reach S2 or R2. When they do reach R2 or S2, reversals are common because the move has stretched more than a typical session's range.
Pivots are at their strongest on news-light days and weakest on event days. On an FOMC or NFP day the pivots get vaporised by the volatility. On a quiet Tuesday with no red-folder releases, price often pings between S1 and R1 all session like the levels were magnetic. Use accordingly.
9. Order Blocks (Smart Money Concepts)
An order block is the last candle of one colour before a strong impulse in the opposite direction. In a bullish setup, it is the last bearish candle before price rips higher. In a bearish setup, it is the last bullish candle before price drops. The theory is that institutions filled their positions during that candle and will defend the zone on any retest. You mark the high and low of the candle as a zone and treat it as a strong support or resistance area.
Order blocks are real. The number of retests that reject cleanly off the last opposite candle before an impulse is way too high to be random. But they get massively overused by retail SMC traders who mark every candle on the chart as an order block and then wonder why nothing works. The rule is the same as every advanced type: an order block that lines up with a horizontal level, a prior session extreme, or a Fibonacci retrace is high-probability. An order block sitting in empty space is decoration.
The best-quality order blocks are the ones that produce a break of structure (BOS) immediately after forming — that is the signature of real institutional accumulation, not just an algorithmic wiggle. If you want to go deeper, our smart money concepts guide walks through the full framework.
10. Volume Profile Point of Control (POC)
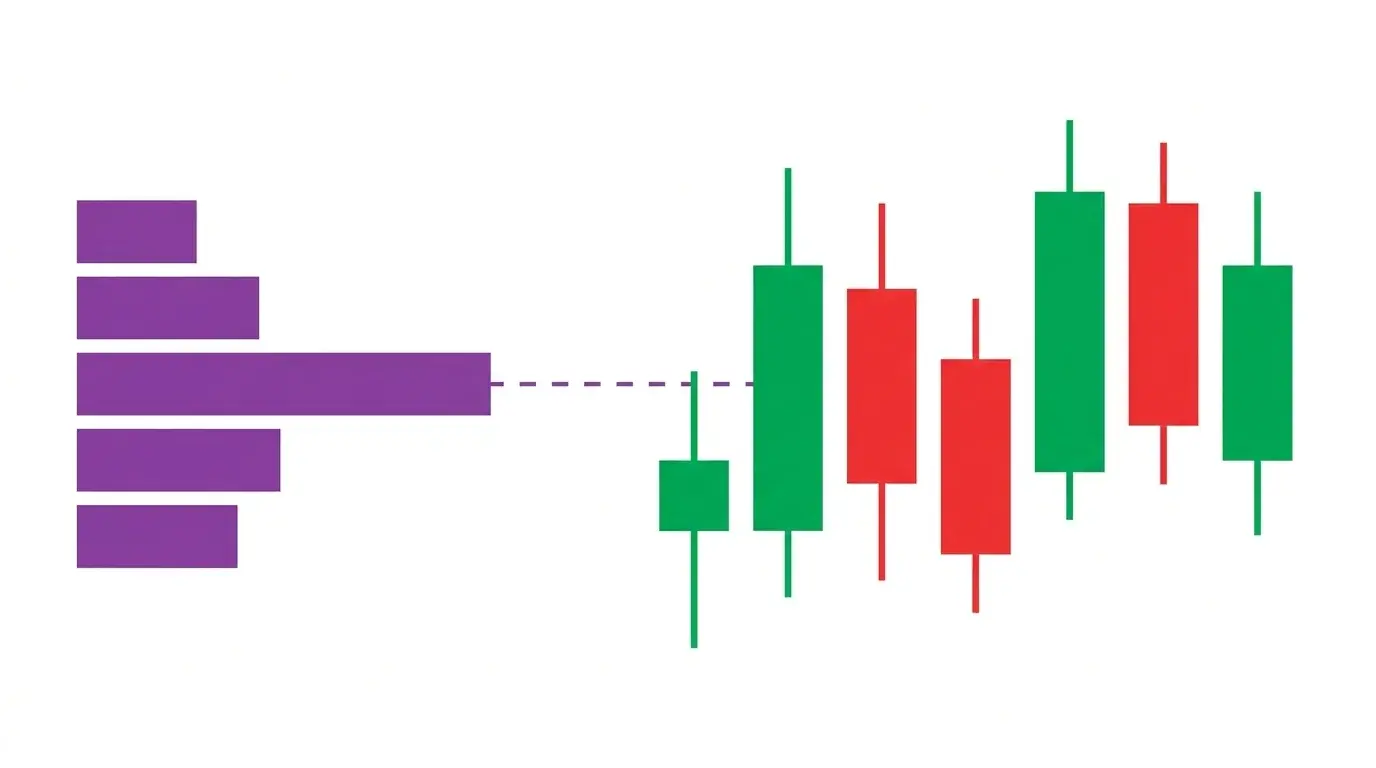
Volume profile is a sideways histogram that shows how much volume traded at each price level across a chosen period. The price that traded the most volume is called the point of control (POC), and it is almost always the strongest horizontal level on the chart. The logic is identical to horizontal S/R — more orders were filled at that price than anywhere else, so more traders are watching it.
The two derivative levels that matter are the value area high (VAH) and value area low (VAL), which bracket the price range where 70% of the session's volume traded. Price above VAH is overextended; price below VAL is discounted; price inside the value area is balanced. Most professional intraday traders think in terms of the value area first and the POC second.
For forex traders, volume profile is most useful on the 24-hour session boundary — the POC of yesterday's full session is a brutal magnet today. For index and crypto traders who trade on volume-reporting venues, it is arguably the most important single level on the chart. The combination of POC plus previous day high or low plus a round number is as clean a confluence as you will find.
ChartSnipe Pricing
- Free: 2 chart analyses per month + unlimited Trading Quiz
- Pro ($20/month): 120 analyses + Daily News Impact Analysis (BTC, FX, gold, indices)
- Premium ($50/month): 600 analyses + all features including Liquidity Snipe mode
See full pricing on the pricing page.
Frequently Asked Questions
What is the most reliable type of support and resistance?
Horizontal support and resistance drawn from obvious swing highs and swing lows is still the most reliable form because every major algorithmic and discretionary desk on earth sees the same line. The more times a level has been tested and held, the more orders accumulate around it. Start with horizontal and add the other types on top when the setup calls for them.
How many support and resistance levels should I draw on one chart?
Three to five is the usable range. Any more and the chart becomes noise — every candle is near something, which means nothing is actually meaningful. Pick the most recent swing high, the most recent swing low, the higher-timeframe level above, the higher-timeframe level below, and maybe one intraday pivot. Everything else is decoration.
What is the difference between static and dynamic support and resistance?
Static levels — horizontal lines, round numbers, previous day high and low, pivot points — stay in the same place all session. Dynamic levels — trendlines, moving averages, VWAP — move as new price prints. Static levels are better for limit orders and breakouts. Dynamic levels are better for trend-following pullbacks.
Do order blocks and volume profile really matter for retail traders?
Yes, when you use them as confluence rather than a standalone signal. An order block that lines up with a horizontal level and a prior day low is a high-probability zone. An order block floating in empty space with nothing around it is wishful thinking. The rule for every advanced type of support and resistance is the same — it only matters when it agrees with the simple stuff.
Should I use support and resistance from higher timeframes or lower timeframes?
Higher timeframe levels are stronger. A daily swing high survives intraday tests that would blow through a 5-minute swing high in seconds. The professional approach is to mark levels on the daily and 4-hour charts first, drop down to the 1-hour and 15-minute for intraday structure, and ignore anything below that unless you are scalping. Higher timeframe always wins a conflict.
The Bottom Line
Every one of these ten types of support and resistance has a place. But almost none of them work in isolation. The traders who consistently make money off S/R are the ones who stack two or three independent types at the same price — a horizontal level that also happens to be the previous day high, sitting right on a 200 SMA, and tagged by a fresh Fibonacci 61.8. When four signals point at the same price, that is a setup. When one signal points at a random level, that is a wish.
Start with horizontal. Add trendlines when trending. Bring in moving averages, VWAP, and pivots for intraday work. Use Fibonacci, order blocks, and volume profile as confluence amplifiers rather than standalone triggers. Draw fewer lines, not more. The chart gets cleaner, the setups get rarer, and the winrate finally starts to climb.
Sources & Further Reading
- • Investopedia — Support and Resistance Basics — standard reference on the core concept.
- • Babypips — Support and Resistance — beginner-friendly walkthrough of horizontal levels and the bounce vs break decision.
- • TradingView — Volume Profile Documentation — technical reference for POC, value area, and volume histogram mechanics.
- • CME Group — Trading With Pivot Points — exchange-published primer on floor pivot calculations.
- • Reuters Currencies — live FX market reporting for context on major pair levels.
Related Articles
Smart Money Concepts: Order Blocks & Liquidity
Order blocks, market structure breaks, power of three, and liquidity grabs explained with charts.

Currency Strength Meter Guide
How strength meters work, the strong-vs-weak pairing rule, and the four mistakes traders make.

High-Impact Forex News Events
The 15 releases that actually move FX pairs — ranked by pip movement and follow-through.
Written by the ChartSnipe Team
ChartSnipe is an AI-powered chart screenshot analysis tool and daily AI news impact analysis platform for forex, gold, Bitcoin, S&P 500, and Nasdaq traders. Our team combines deep experience in technical analysis, AI vision models, and live market data across 32+ instruments to deliver actionable trading insights.
See every major pair with live prices, strength, and AI context
Daily AI news impact analysis across 32 instruments. The levels in this guide applied to every FX pair, gold, BTC, and indices.
Open News Impact Dashboard