
We Put Claude, ChatGPT and Gemini on Real Charts
Everyone has an opinion on which model is “best.” So we stopped arguing and handed the same trading charts to all three. Each one earned a genuine lane. Then we asked the one question that actually matters for trading — where is price and where are the levels — and all three walked into the same wall.
The “which model is best” debate is mostly people comparing the thing they use to the thing they read a thread about. It is also the wrong question. Claude, ChatGPT and Gemini are all generalists, and a generalist is rarely best at everything — it is best at something. So we ran them the way a trader actually would: same charts, same prompts, over and over, watching not for the cleverest single answer but for the model we could rely on twice in a row.
What came back was clearer than the marketing suggests. Each model has a lane it genuinely owns. And each model has the exact same hole in the middle of its game when you ask it to read price off a chart image. This piece is the fair version of the comparison — strengths named honestly, weaknesses named just as honestly — and then the part nobody selling you a subscription wants to say out loud: for the actual chart read, none of the three is the right tool.
If you want the version where we pit these general models against a tool built for the job, we did that separately in Claude vs ChatGPT vs ChartSnipe. This post is model-against-model first, then the honest verdict. The tool we reference throughout is ChartSnipe, used the way it is meant to be used — research, not signals.
Key Takeaways
- →Claude is the most consistent. It holds a rule set across a whole session and returns the most structured, reproducible read — the trait that matters most for a process.
- →ChatGPT is the best all-round generalist for data, code and brainstorming — but its trade plans are not reproducible run to run, so you cannot audit them.
- →Gemini's real edge is real-time news and search — it is the fastest of the three to surface what is moving a market right now.
- →The shared blind spot: none can see live prices, and all three confidently invent support and resistance off a screenshot. That is not a bug you prompt away.
- →The verdict: use the LLMs for research in a multi-model workflow, and a purpose-built tool for the actual chart read.
1. The test — same charts, three models
We used a spread of screenshots a working trader would actually stare at: a XAUUSD daily mid-correction, a EUR/USD 4-hour range, a USD/JPY chart pinned near 162, a Nasdaq chart at record highs, and a Bitcoin chart consolidating in the mid-$50,000s. For each one, three prompts. First, “read this chart and give me bias, entry, stop and target.” Second, the same prompt with a fixed rule set attached — only trade with the daily trend, stop beyond structure, minimum 1.5R. Third, “what is moving this market today?”
Then the part most comparisons skip: we ran every prompt three times. A model that gives a brilliant answer once and a contradictory one on the re-run is not something you can build a process on. Consistency is not a tie-breaker here; it is the main event. A single dazzling read is a party trick. The same disciplined read three times in a row is an edge.

One framing point before the results. As of June 2026 the assistant landscape had shifted: ChatGPT, still the biggest single name, had slipped below 50% of the AI-assistant market as Claude picked up share, particularly among people who value consistent, structured output over conversational flair. That shift maps almost exactly onto what we saw on the charts. Popularity and fitness-for-task are different axes, and trading lives on the second one.
2. ChatGPT — the strong generalist with non-reproducible plans
Give ChatGPT credit where it is due: it is the most versatile of the three. Paste in a messy block of trade history and it cleans, groups and summarises it faster than the others. Ask it to write a Pine Script indicator or a Python backtest and it produces the most usable first draft. As a brainstorming partner — “give me five reasons this USD/JPY long could fail” — it is genuinely excellent, wide-ranging and quick. If you want one model to be a competent second brain across everything around trading, it is the safe default.
The problem shows up the moment you ask for a trade plan and expect the same one twice. On the EUR/USD 4-hour, run one came back bearish with a short into the range low. Run two, identical screenshot, identical prompt, came back cautiously bullish looking for a range-high breakout. Both reads were articulate. Both were internally coherent. They were also opposites. That is fine when you are fishing for ideas and want the spread of possibilities. It is a real problem when you are trying to run a rules-based process, because you cannot audit a decision you cannot reproduce, and you cannot trust a backtest of a plan that changes when you blink.
We dug into the same reproducibility gap specifically for chart reads in does ChatGPT work for trading charts. The short version: it is a superb thinking partner and a shaky decision engine, and traders get burned when they treat the second thing like the first.
Where ChatGPT wins
- Cleaning and summarising trade data.
- Writing indicator and backtest code.
- Fast, wide-ranging brainstorming.
- Explaining a concept you half-understand.
Where it lets you down
- Trade plans differ run to run.
- Bias can flip on an identical prompt.
- Hard to audit for a rules-based process.
- Confident tone hides the variance.
3. Claude — best at holding rules and structured output
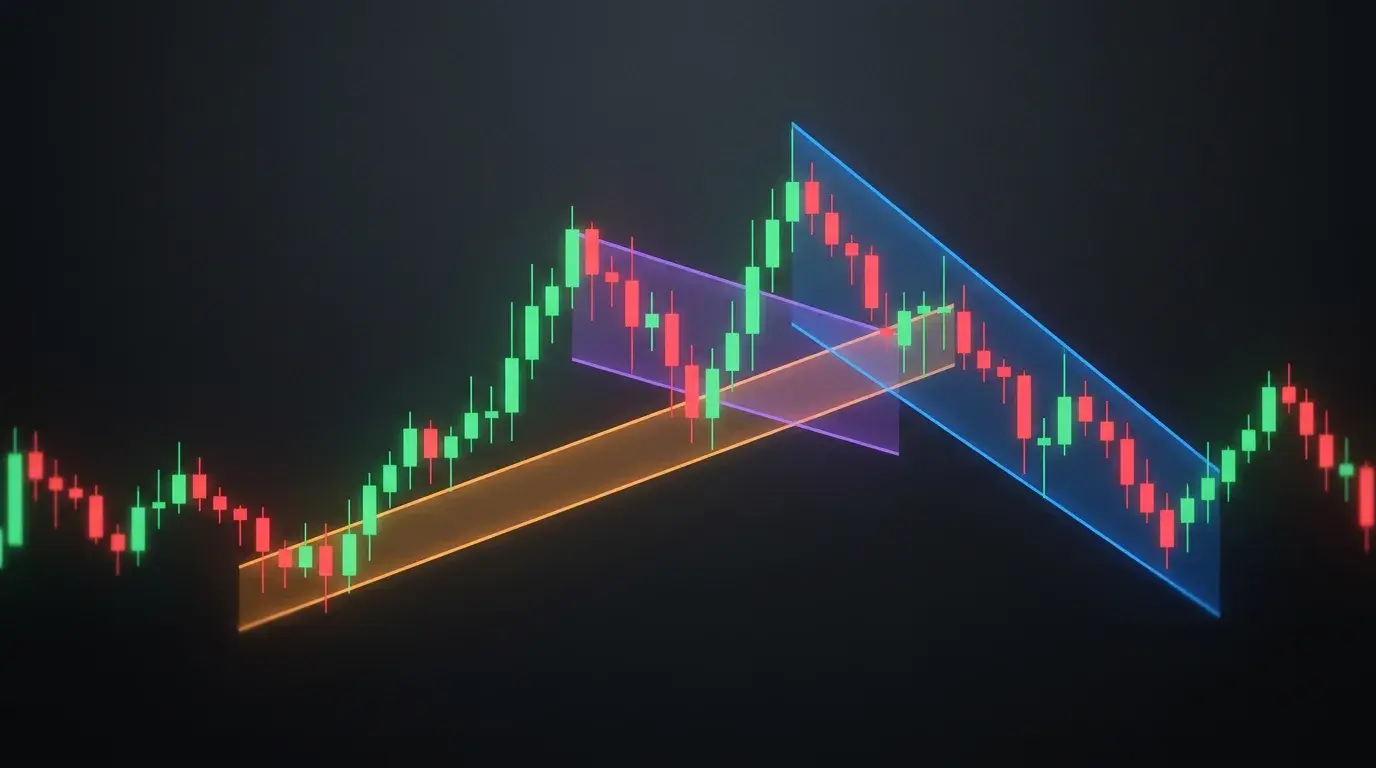
Claude's advantage is the one that is easy to undersell in a demo and impossible to ignore in a workflow: it holds instructions. Attach the rule set — trade with the daily trend, stop beyond structure, minimum 1.5R, no counter-trend entries — and Claude keeps applying it, consistently, across the whole session and across re-runs. When a chart did not fit the rules, it was the model most willing to say “no valid setup here” rather than manufacture one to be helpful. For a rules-based trader that restraint is worth more than any flourish.
It also returns the cleanest structure. Ask for bias, entry, stop, target and reasoning and you get exactly those fields, in that order, formatted the same way every time — which means you can drop the output straight into a journal or a checklist without reformatting. On the same EUR/USD chart that made ChatGPT flip, Claude's three runs stayed on one side and disagreed only on the exact entry, not the direction. That is the difference between a colleague you can plan around and one who reinvents the plan each morning.
Be fair about the limits, though. Claude's consistency is consistency of reasoning, not of perception. It will structure a beautifully disciplined read around price levels it still cannot actually measure — more on that in section five. And on pure open-ended brainstorming breadth, ChatGPT usually surfaces more angles. Claude is the model you want holding the rules; it is not automatically the model you want when you deliberately want the rules broken for ideas.
4. Gemini — the real-time news and search edge
Gemini's standout is speed to context. Ask “what is moving gold today?” and its tight integration with live search means it is usually first to pull the relevant headline — a hot inflation print, an oil-market escalation, a central-bank line — and stitch it into a readable summary. When the question is about the world rather than the candles, Gemini is the one we reached for. For a macro instrument, knowing the driver before you look at the chart is half the job.
Two honest caveats. First, “real-time” means indexed-and-searchable, not live. A headline price Gemini surfaces can lag the market by minutes, and minutes are eternities on an event candle. Second, a good news summary is not a trade. Gemini would correctly explain that the dollar was bid on firm-yields expectations, then, asked for levels on the DXY chart, invent them with the same confidence as the other two. The search edge is real and it stops precisely at the point where you need measured price.
The pattern across all three. ChatGPT is the widest generalist, Claude is the most disciplined, Gemini is the most current. Those are three different strengths, and none of them is “can read a chart.” That is not a coincidence — it is what section five is about.
5. The shared blind spot: no live prices, hallucinated levels
Here is where all three converge, and it is the most important paragraph in this post. A general LLM cannot see the market. It sees the pixels of a screenshot or the words you paste in. There is no connection to your broker, no exchange feed, no live bid and ask. So when you ask “where is price” or “where is resistance,” the model does not measure anything — it estimates from the image and then states the estimate as if it were a reading off an instrument.
A chart screenshot has no numeric axis the model can lock onto. It infers the price scale by eyeballing candle positions, then produces round, confident numbers — “support at 4,150, resistance at 4,240.” Sometimes they are close. Often they are off by an amount that would blow your stop. The dangerous part is the tone: the output reads exactly as authoritative when it is invented as when it is roughly right. Our test made this obvious — the surest tell is to feed the same screenshot twice. The narrative stays similar; the specific levels drift. Measured numbers do not drift.
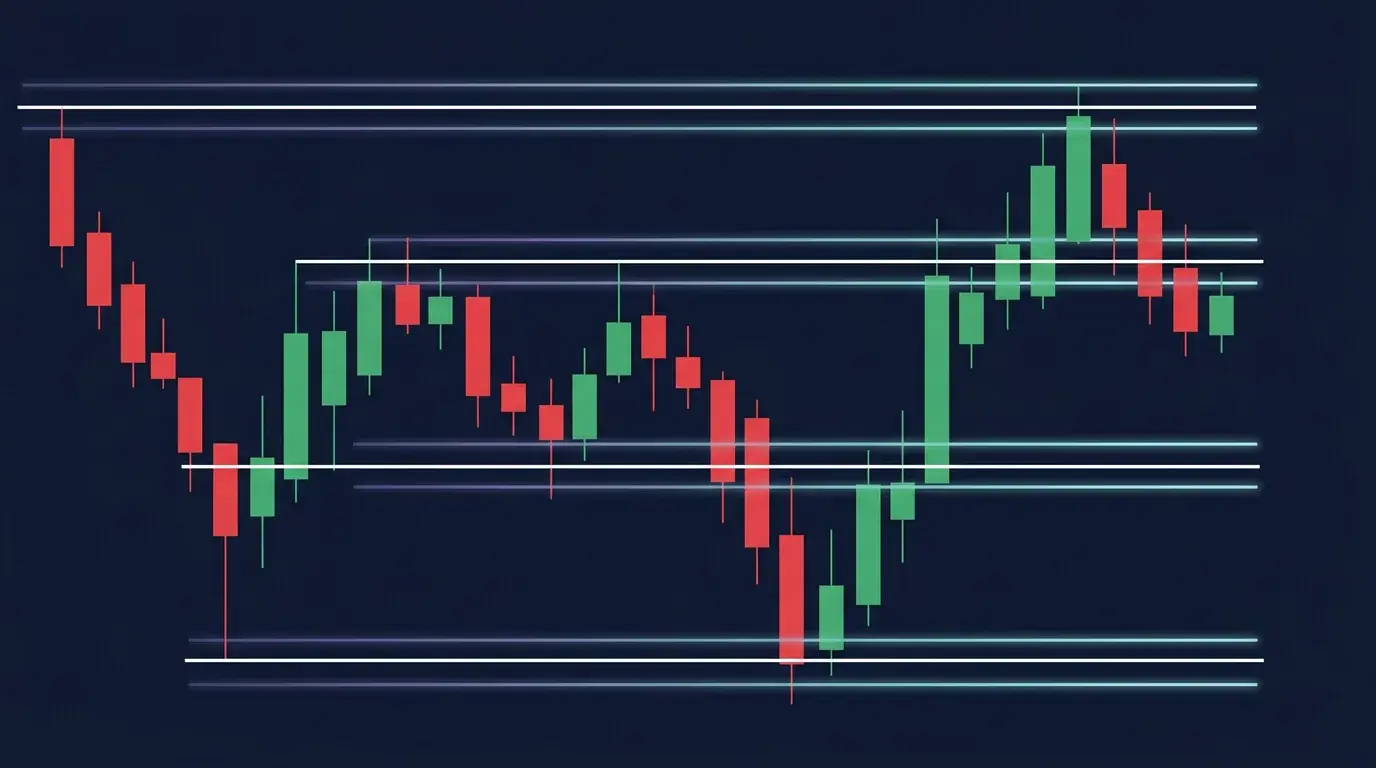
This is not a prompt-engineering problem, and no amount of “be precise” fixes it. It is architectural. A model with no live data and no measurable axis cannot ground a level, so it approximates and presents the approximation smoothly. Claude's discipline makes it more likely to hedge or refuse; ChatGPT and Gemini are more likely to just hand you a number. But not one of the three actually knows the level. We laid out the wider version of this argument in whether AI trading actually works — the summary is that a generalist LLM is a reasoning tool, not a market-data tool, and confusing the two is how accounts get hurt.
Rule of thumb. Trust these models on the why — the reasoning, the context, the “what could go wrong.” Do not trust them on the where — the exact price, the exact level, the exact stop. The where has to come from something that can measure it.
6. The multi-model workflow that actually works
Once you accept that each model owns a different job, you stop asking which one to marry and start assigning tasks. The traders getting real value out of LLMs in 2026 are not loyalists — they run two or three, each on the part it is best at, and none on the part none of them can do.
A workflow that held up in our testing: start with Gemini for the morning context — what is moving, what prints today. Hand the reasoning to Claude — give it your rule set and let it pressure-test the idea and keep the structure consistent. Use ChatGPT to widen the search for failure modes and to write any code or clean any data around the trade. Then take the where — the live price, the measured levels, the actual read — to a tool built to measure it, because that is the one thing you have just confirmed none of the three can do.

Notice what the workflow quietly admits: the LLMs are the research layer, not the execution layer. They frame the trade. They do not read the chart's price and they do not size the position. If you are choosing among AI helpers for the research layer, we compared the full field in the best AI chart screenshot analysis tools.
7. Where a purpose-built chart tool beats all three
The gap the three models leave is specific and it is the same for all of them: live price and measured levels. That is exactly the gap a purpose-built tool is engineered to fill. ChartSnipe is not a smarter chatbot — it is a narrower tool that starts from real numbers. It carries live prices for 28 FX pairs plus gold, a currency strength index across the eight majors, and a daily AI news impact read, so the context and the price come from data instead of from a screenshot the model is squinting at.
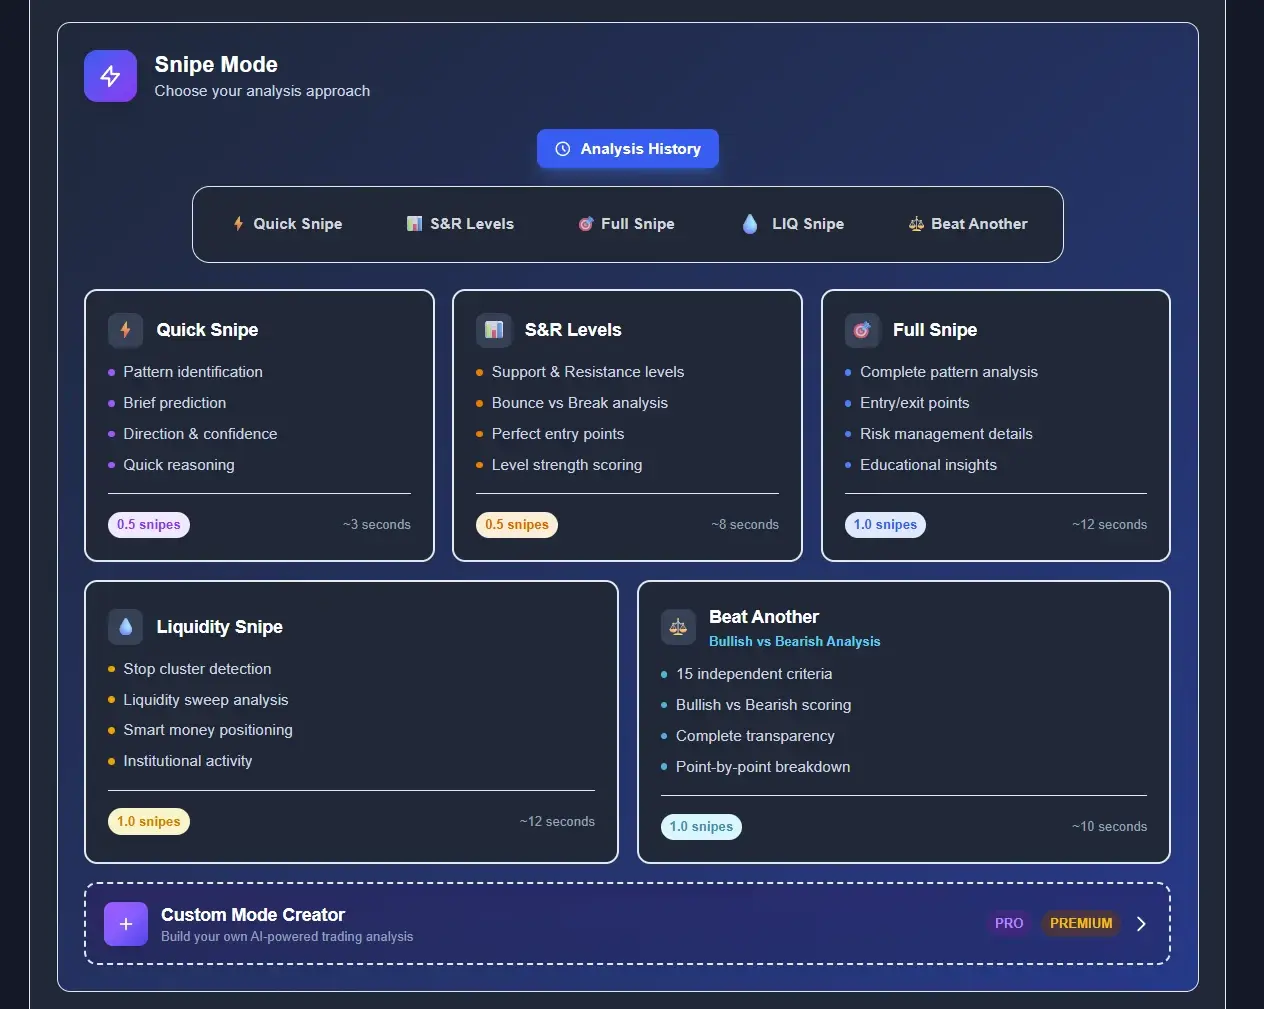
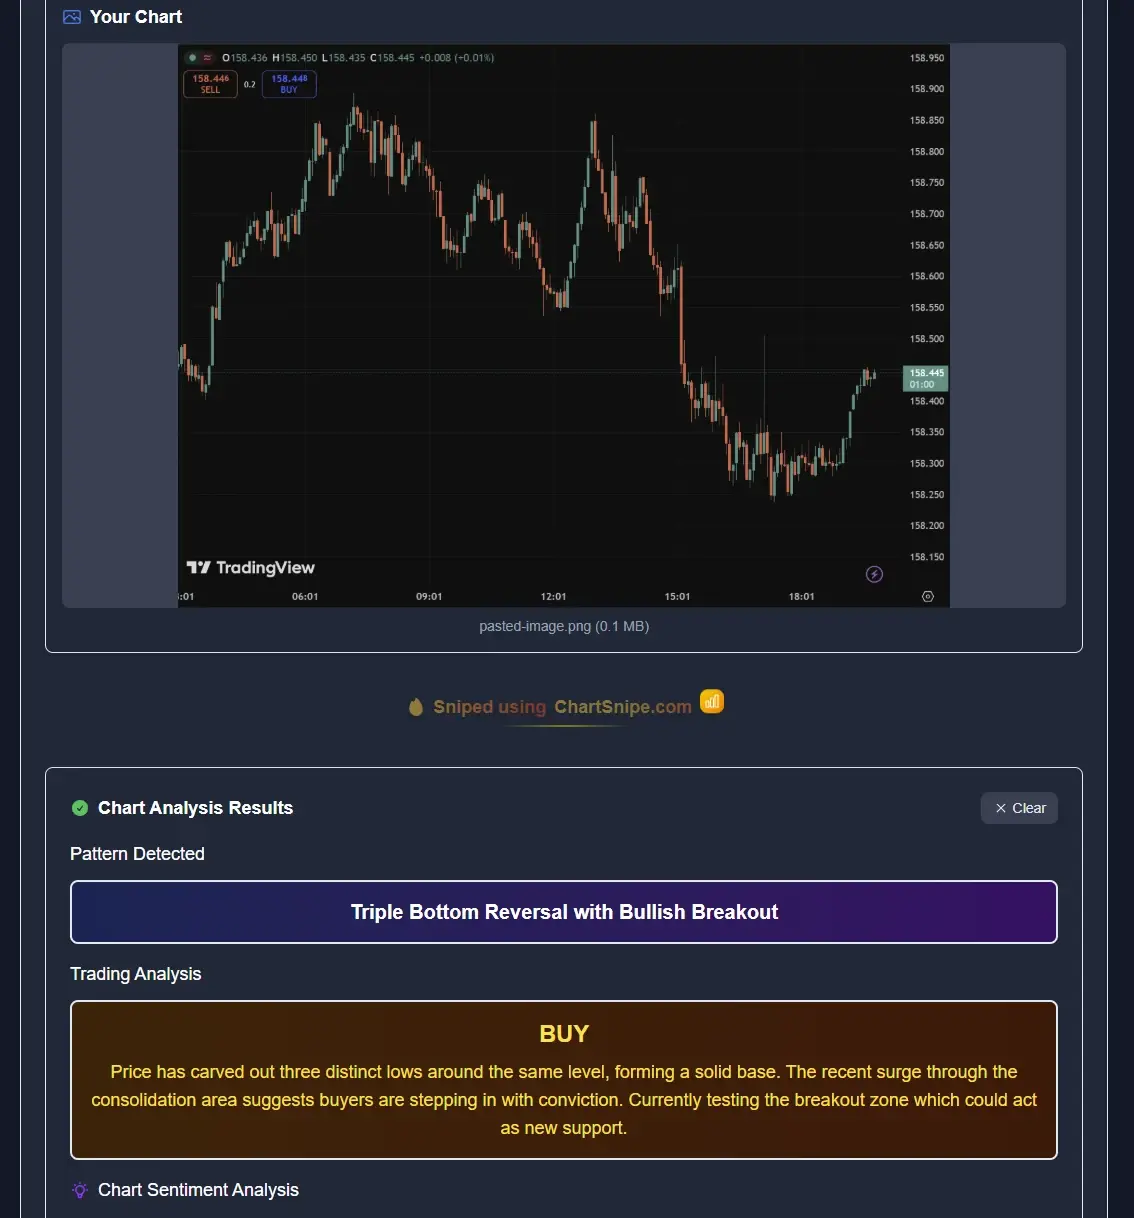
On the screenshot itself, it runs fixed analysis modes — a fast triage, a support-and-resistance read, a full pattern-entry-stop-target readout, a smart-money liquidity view, and a second-opinion mode — that return the same structure every time. Because the modes are constrained and grounded, the output is auditable: you can compare today's read to last week's and it is measuring the same things the same way, not re-improvising the format and the levels. That is the reproducibility ChatGPT lacks and the measured grounding all three lack, in one place.
None of this makes the LLMs redundant. Gemini still finds the news faster, Claude still reasons more consistently in prose, ChatGPT still writes the backtest. The honest division of labour is the whole conclusion: LLMs for the research and the reasoning, a purpose-built tool for the price and the levels. Anyone telling you one general chatbot does all of it either has not run the re-run test or is selling you something.
Frequently asked questions
Which is best for trading, Claude, ChatGPT or Gemini?
None wins outright, because they win at different jobs. Claude is the most consistent at following a rule set and returning structured, reproducible output. ChatGPT is the strongest all-round partner for data, code and brainstorming. Gemini has the edge on real-time news and search. For the actual chart read all three are limited the same way, so use them for research and a purpose-built tool for price.
Can Claude, ChatGPT or Gemini see live market prices?
Not reliably. A general LLM works from a screenshot or pasted text with no live feed to your broker or an exchange, so any price it states is read off the image, pulled from stale training data, or invented. Gemini can search for a recent quote, but a delayed headline price is not the live bid and ask you trade against.
Why do LLMs hallucinate support and resistance levels?
A chart screenshot has no numeric axis the model can measure against. It infers where price is by eyeballing pixels, then produces round, plausible numbers. Because the output reads confident, traders take estimated levels as measured. Run the same screenshot twice and the invented levels shift — that drift is the tell.
Are ChatGPT trade plans reproducible run to run?
Often not. Ask for a plan on the same chart twice and you can get two different biases, entries and stops. That is fine for brainstorming and bad for a rules-based process, because you cannot audit a decision you cannot reproduce. In our runs Claude held a given rule set more consistently across repeats.
Is ChatGPT still the most popular AI assistant in 2026?
It is still the largest single assistant, but by June 2026 it had slipped below 50% of the AI-assistant market as Claude gained share, particularly among users who value consistent, structured output. Popularity is not the same as being the right tool for a chart read.
What does a purpose-built chart tool do that the LLMs cannot?
A tool built for the job like ChartSnipe pulls live prices for 28 FX pairs plus gold, computes a currency strength index, scores the day's news impact, and reads a screenshot through fixed modes that return the same structure every time. It grounds the read in real numbers instead of estimating levels off pixels, so the output is auditable rather than merely plausible.
Sources & further reading
Use the LLMs for research. Use ChartSnipe for the read.
Live prices for 28 pairs plus gold, a currency strength index, a daily AI news-impact score, and five screenshot analysis modes that return the same structure every time — grounded in real numbers, not estimated off pixels. Two free snipes to test it on your own chart.