The Bitcoin FOMC Playbook: How BTC Actually Reacts to Fed Rate Decisions
The dump-then-rip pattern, the DXY-BTC inverse correlation, and the minute-by-minute timeline every crypto trader should have taped to their monitor before 2:00 PM ET.

Ask a crypto Twitter veteran what moves Bitcoin more than any headline about ETFs, halving cycles, or on-chain flows, and the honest answer is the Federal Reserve. Eight times a year, Jerome Powell walks up to a microphone and, for roughly 45 minutes, becomes the single most important variable in the Bitcoin market. Funding rates flip. Open interest gets liquidated. Long-term holders take screenshots of candles they will remember for years.
And yet most retail crypto traders still treat FOMC days like any other Wednesday. They leave leverage on. They forget to check the DXY. They buy into the first green candle after 2:00 PM ET and get stopped out by the press conference reversal 35 minutes later. This is the ChartSnipe Bitcoin FOMC playbook — the patterns, the timeline, and the strategies that actually work when the Fed speaks.
Key Takeaways
- →Bitcoin is a high-beta macro asset on FOMC days — it reacts to the same inputs as the SPX and Nasdaq but with 3–5x the amplitude.
- →The "dump-then-rip" pattern is structural: leverage is unwound in the 24–48 hours before the decision, then uncertainty collapses at 2:00 PM ET and price reverses hard.
- →DXY is the single most useful macro signal for BTC on Fed day — a dovish Fed weakens the dollar and lifts BTC, a hawkish Fed does the opposite.
- →The press conference at 2:30 PM ET usually produces a larger move than the 2:00 PM statement — wait for Powell's tone before committing size.
- →HODLing through FOMC is fine for multi-year horizons but disastrous for anyone running leverage — size down, widen stops, or flatten into the release.
1. Why FOMC Matters to Bitcoin More Than People Realize
There is a persistent myth in crypto that Bitcoin is somehow insulated from traditional finance. "BTC is uncorrelated," the pitch goes. "It is digital gold." The charts disagree. Since 2020, Bitcoin has traded like a high-beta Nasdaq stock on almost every major macro day, and FOMC is the most macro day of them all.
There are three structural reasons Fed decisions hit BTC harder than almost any other asset class:
Global Liquidity Sensitivity
Bitcoin is the purest expression of risk-on liquidity ever invented. When the Fed signals easing, dollars search for yield — and BTC is the highest-convexity bet on the board. When the Fed signals tightening, leverage comes off first where it is cheapest to unwind: crypto perps.
Dollar-Denominated Pricing
Every BTC/USD quote on earth is a two-sided bet: one on Bitcoin, one on the dollar. A hawkish Fed strengthens DXY, which mechanically reprices BTC lower before any sentiment-driven flow even fires. The inverse DXY-BTC correlation is not magic — it is arithmetic.
Risk-On / Risk-Off Regime Switches
Powell's press conference is the single biggest risk-regime signal of any eight-week cycle. Equities, crypto, and high-yield credit all trade off the same tape. BTC just has the highest volatility coefficient, so the same macro input produces a 3-5x larger move.
Pair this with the fact that crypto markets trade 24/7 and carry far more leverage than traditional equities, and you get a predictable outcome: FOMC days are where Bitcoin either makes or destroys entire account balances. Understanding the playbook is not optional. If you want to see how we integrate these Fed-day views alongside forex and gold each morning, the AI News Impact dashboard is the clearest place to start.

2. The Dump-Then-Rip Pattern: Why BTC Often Bleeds Into the Decision
If you watch enough FOMC cycles, you start to see the same choreography. Bitcoin drifts lower in the 24 to 48 hours before the announcement. Funding rates cool. Open interest declines. A few long liquidation cascades clean out late longs. Then, at 2:00 PM ET on Wednesday, the statement drops and price rips — sometimes in the opposite direction of the pre-event drift, sometimes in continuation, but almost always with violence.
Traders call this the "dump-then-rip" pattern, and it is not a conspiracy. It is the natural consequence of how market makers and leveraged funds manage risk into binary events. Here is the mechanical explanation:
The Mechanics of the Pre-FOMC Drift
- Market makers widen spreads — they cannot hedge cleanly into a binary event, so they pull passive bids.
- Funds de-risk — quant shops and CTAs reduce gross exposure into announcements as a standard risk rule.
- Leveraged longs get trimmed — perp traders see funding cool and close positions to avoid tail-risk wicks.
- Order book gets thin — the combination means sellers find no bids, so even modest flows push price down noticeably.
- Stops trigger cascades — late longs who did not de-risk get liquidated, adding fuel to the drift.
The key insight: this pre-FOMC bleed is not bearish conviction. Nobody is selling BTC because they believe it is going to zero — they are selling because holding a leveraged position through a coin-flip event is bad risk management. Once 2:00 PM hits and uncertainty collapses, the bids return. If the print is dovish or in-line, the dump reverses into a rip. If the print is genuinely hawkish, the dump extends but with much more liquid two-sided tape.
Recognising the dump-then-rip pattern is the single most valuable pattern-recognition skill a BTC trader can develop around Fed days. It tells you that the pre-event weakness is noise, not signal. The signal arrives at 2:00 PM and evolves through 3:15 PM.
3. The Three FOMC Scenarios and BTC's Typical Reaction
Every FOMC meeting resolves into one of three broad scenarios. Knowing which scenario you are in — and how BTC typically behaves in each — is the difference between a prepared trader and a reactive one.
| Scenario | BTC | DXY | Gold | S&P 500 |
|---|---|---|---|---|
| Dovish cut / dovish hold | Rips higher (2-5%) | Sells off | Rallies | Up |
| Neutral / as expected | Choppy, then trend | Sideways | Quiet | Range |
| Hawkish hold / hawkish cut | Dumps (3-8%) | Rallies hard | Dumps | Down |
Notice the symmetry: BTC, gold, and the S&P 500 are all on the same side of the trade, while DXY sits on the opposite side. This is because all four assets are trading the same macro input — the marginal cost of dollar liquidity. When dollars get cheaper, risk assets rip. When dollars get scarcer, risk assets bleed. BTC just rips and bleeds harder than anything else on the board.
The tricky part — and the reason so many traders lose money on FOMC — is that "dovish" and "hawkish" are not objective. They are measured relative to what the market already priced in. A 25 basis point cut can be hawkish if the market was pricing 50 bps. A hold can be dovish if Powell's tone in the press conference signals a coming pivot. This is why watching the economic calendar consensus matters more than watching the headline number.
4. The DXY-BTC Inverse Correlation (and When It Breaks)
If you only monitor one chart alongside Bitcoin on FOMC day, make it the DXY (US Dollar Index). The inverse correlation is the single most reliable macro signal BTC has. When the dollar weakens, BTC rallies. When the dollar strengthens, BTC sells. On FOMC days specifically, the correlation tightens to near -1 during the 30 minutes around the 2:00 PM release.
Why does this work? Because DXY is a basket of six currencies weighted heavily toward EUR, JPY, and GBP — the three biggest dollar counterparts. When Powell sounds hawkish, yields on US treasuries rise, capital flows into dollars, EUR/USD sells, USD/JPY rallies, and DXY ticks higher. Meanwhile BTC, which is quoted in dollars and has no coupon, loses its relative attractiveness. The flow is mechanical and fast.
But the correlation is not bulletproof. It breaks in two specific situations:
Liquidity crises
When markets panic (March 2020, September 2022), dollar demand spikes AND risk assets dump simultaneously. BTC and DXY can both rally or both dump as leveraged books get liquidated across the board. In these windows, correlations go to 1 across every risk asset and the DXY signal loses its edge.
BTC-specific catalysts
ETF inflow days, halving events, exchange collapses, or regulatory headlines can override macro temporarily. If Binance gets sued at 2:05 PM while Powell is speaking, BTC is trading the headline, not the Fed.
Outside those two edge cases, the DXY-BTC inverse correlation should be your primary directional compass. If DXY prints a new intraday high and BTC is still offered, short the retrace. If DXY breaks its intraday low and BTC is consolidating, load the dip.
5. Press Conference Volatility: Why Powell Speaks for 45 Minutes and BTC Swings 3%
Here is the part most retail traders miss entirely: the FOMC statement is not the main event. The press conference is. The statement drops at 2:00 PM ET and delivers the headline decision — usually 25 or 50 bps, or a hold. But the statement is short, sanitised, and written by committee. The real information flow happens between 2:30 and 3:15 PM, when Jerome Powell takes questions from reporters and has to think on his feet.
In those 45 minutes Powell will:
- Describe the Fed's view of current inflation trajectory
- Comment on the labour market and wage dynamics
- Hint (deliberately or accidentally) at the path of future rate decisions
- React to questions about financial stability, credit conditions, and the economy
- Occasionally say something completely off-script that moves every risk asset 2-3%
Each of those inputs is a separate catalyst. BTC rarely moves in one clean direction during the press conference — it tends to zigzag as Powell shifts topics. You will often see a sharp move on the statement at 2:00, a retrace between 2:05 and 2:30, another move as Powell reads his opening statement, then three or four additional spikes as reporters pull answers out of him.
The 3:15 PM rule
Experienced BTC traders wait until roughly 3:15 PM ET to form a directional opinion. By then, Powell has finished the press conference, the market has digested his full tone, and the dominant trend for the rest of the session is usually in place. Traders who chase the first 2:00 PM candle are trading the headline. Traders who wait until 3:15 are trading the interpretation — and the interpretation is where the real money lives.
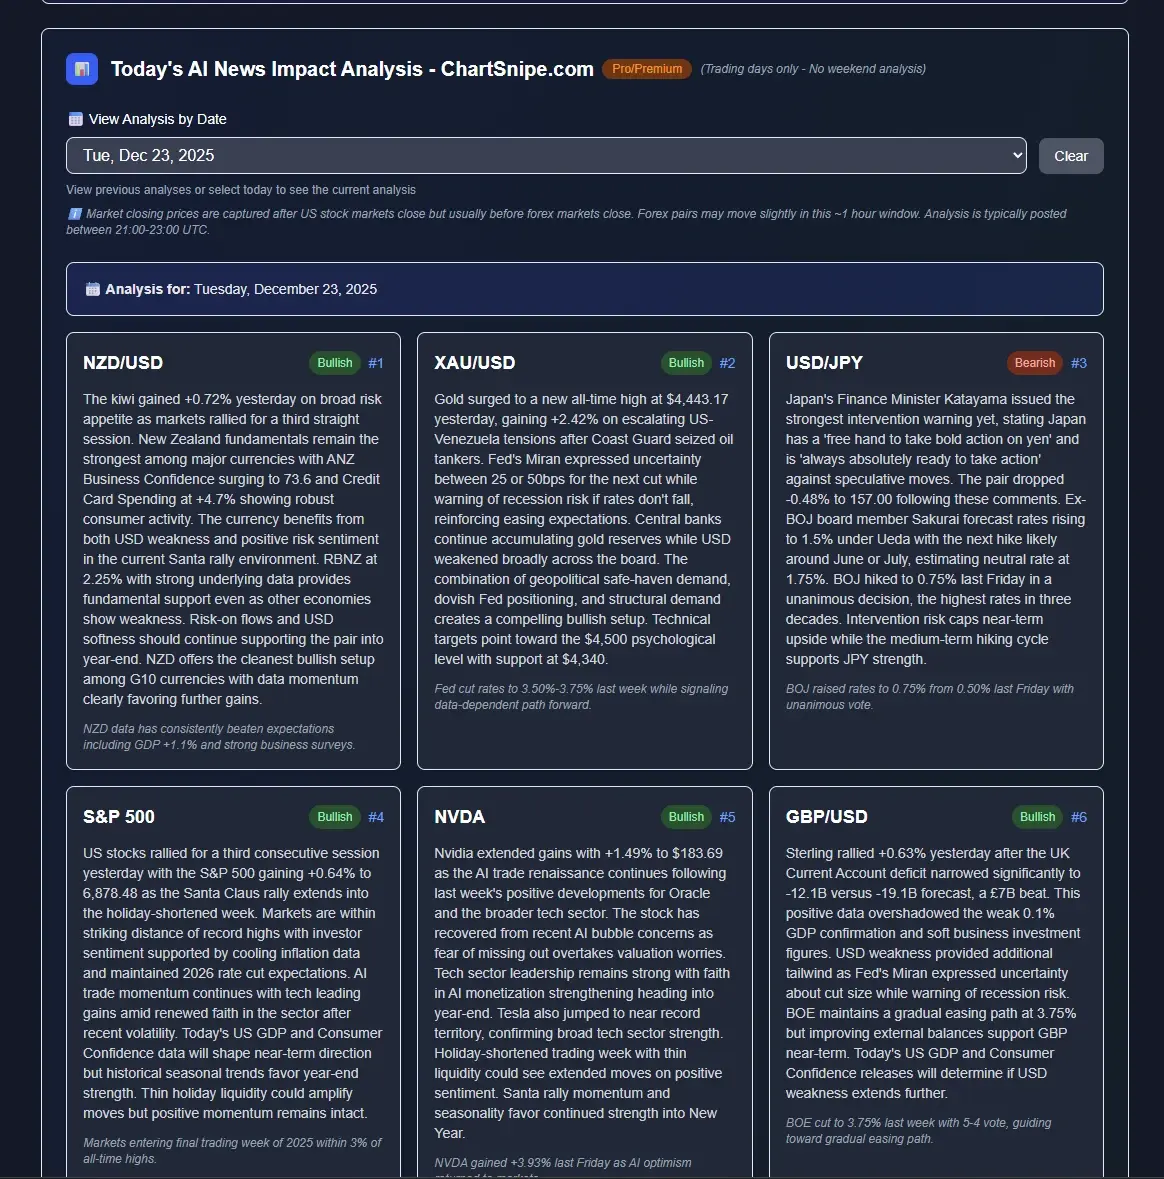
How ChartSnipe Flags FOMC Impact Before the Meeting
One of the reasons retail BTC traders get blindsided on Fed day is that they only start thinking about the meeting an hour before 2:00 PM ET. By then, market makers have already pulled, funding has already cooled, and the pre-event drift is already underway. The edge is in knowing — before the session starts — which Fed-related catalyst is the actual driver for the day and which instruments are in its blast radius.
This is exactly what the ChartSnipe Risk Analysis panel does every morning. It scans the calendar for Fed events — rate decisions, FOMC minutes, scheduled Powell and voting-member speeches — scores each one by severity, and spells out which pairs and instruments the event is expected to hit hardest. BTC does not trade in isolation on those days; it trades alongside gold, US tech, and the dollar pairs that sit on the same risk curve.

Notice how the FOMC minutes row sits on the same board as Iran war headlines, RBNZ decisions, Tokyo intervention, and IRGC oil attacks. That is how Fed day actually looks in 2026 — the Powell catalyst is stacked against geopolitical shocks and competing central bank flows, and the risk panel forces you to see them together rather than trading BTC as if the Fed is the only thing on the calendar.

6. The FOMC Day Timeline for a Bitcoin Trader
Here is the exact timeline we recommend BTC traders follow around every Fed meeting. Save it. Print it. Tape it to your monitor.
Review expectations
Check CME FedWatch probabilities. What is the market pricing in? Write down your hawkish, neutral, and dovish scenarios before anyone else tells you what to think.
Reduce leverage
If you are running 3-5x perp leverage, bring it down to 1-2x or flat. Move stops wider or off. Crypto overnight gap risk is real even though futures trade 24/7.
Observe, don't trade
The last hour before FOMC is almost always noise. Market makers have pulled. Spreads are wide. Any move here is a head-fake. Sit on your hands.
The statement drops
First reaction candle prints. Expect a 1-3% move in the first 30 seconds. Do NOT chase. The first move is the headline; the second move is the truth.
Press conference begins
Powell walks to the podium. The next 45 minutes is where the real directional trend forms. Watch DXY and 10-year yields alongside BTC — they confirm the tone before BTC commits.
Form the directional view
Press conference ends. Now you can trade with conviction. The dominant trend from 3:15 to the close is usually the cleanest intraday move of the entire cycle.
The follow-through day
The day after FOMC is when real money re-enters. If Wednesday's trend holds into Thursday morning, it is legitimate. If it reverses, the initial move was a knee-jerk and the true direction is opposite.

7. Historical Context: What the Last 8 FOMC Meetings Did to BTC
We're not going to quote exact percentages here because every cycle is different and you can pull the history yourself. But across the past two years of FOMC meetings, a few qualitative patterns repeat with remarkable consistency:
Pre-FOMC drift is almost always red
In the 24 hours before the decision, BTC has bled several hundred to a couple of thousand dollars in the vast majority of recent meetings. Low-single-digit percentage drops into the event are the norm, not the exception.
The first 30 seconds rarely settles the direction
More than half of recent FOMC meetings have seen BTC move in one direction on the statement release, then fully reverse during the Powell press conference. Trading the 2:00:01 PM candle has been close to a coin flip.
Dovish surprises produce the biggest up-moves
When Powell sounds more accommodative than the market expected, BTC has delivered some of its largest single-day moves of recent cycles — mid-single-digit percentage rips are common on genuine dovish surprises.
Hawkish surprises are faster and meaner
On the hawkish side, BTC moves faster down than up. Leverage on the long side is almost always larger than on the short side, so hawkish surprises trigger cascading liquidations that produce bigger candles in less time.
Neutral meetings are surprisingly volatile
Even when the statement is exactly as expected, BTC rarely sits still. Press conference tone alone has produced 2-3% intraday swings on meetings where the headline was a total non-event.
The takeaway: do not try to predict direction. Predict volatility instead. FOMC days are guaranteed to move Bitcoin more than an average Wednesday, and the best strategies take advantage of that volatility rather than trying to front-run the committee.
8. The 3 BTC FOMC Trading Strategies That Actually Work
There are three legitimate ways to trade Bitcoin around FOMC. Each has its own risk/reward profile, and each suits a different type of trader. Pick the one that matches your style — do not try to run all three.
Pre-Position with a View
Who it's for: Traders with high macro conviction.
How it works: Scale into a BTC position in the days before the meeting based on your expectation of Powell's tone. Size conservatively — FOMC risk is asymmetric. Use 10-20% of your normal size, not 100%.
Risk: You can be 100% right on the fundamentals and still get wicked out by a hawkish statement or a press conference surprise. This is the lowest-winrate strategy.
Fade the Knee-Jerk
Who it's for: Active scalpers with fast execution.
How it works: Wait for the 2:00 PM initial move. If BTC spikes 2-3% in either direction in the first 90 seconds, fade it back toward the pre-release level. The first move is almost always overshoot as algos react to the statement before humans parse it.
Risk: On hawkish surprises the "knee-jerk" becomes the actual trend and fading it is a liquidation. Only scale into the fade after you see the first rejection wick.
Wait for the Press Conference Trend
Who it's for: Anyone who values winrate over action.
How it works: Sit out the entire 2:00-3:15 PM window. Once the press conference ends, identify the dominant intraday trend (confirmed by DXY and SPX direction) and enter in that direction with a close stop. Hold into the Thursday follow-through.
Risk: You miss the biggest candles of the day. But you also dodge the biggest wicks. This is the highest-winrate strategy and the one we recommend for almost everyone.

Whichever strategy you pick, the meta-rule is the same: size down, widen stops, and accept that FOMC volatility is a tax on every open position. The traders who survive long-term on FOMC days are the ones who treat it as a risk-management exercise first and an opportunity second.
9. Why "Just HODL" Fails on FOMC Days
The HODL philosophy works on a multi-year horizon. If you bought BTC five years ago and never looked at the chart, FOMC days are irrelevant to your thesis. But almost nobody who claims to HODL actually holds the way the ideology demands. Most "HODLers" are checking prices hourly, watching liquidation cascades, and making emotional decisions at 2:05 PM ET.
For anyone in that middle ground — active enough to care but not disciplined enough to ignore — HODL is the worst possible strategy around FOMC because:
It exposes you to maximum volatility with zero edge. You are taking the tail risk without getting paid for it. A hawkish surprise can cost you weeks of gains in 90 seconds.
It forces emotional decisions at the worst moment. If you do not have a plan entering 2:00 PM, you will panic-sell the first red candle and panic-buy the first green one.
It wastes the single most predictable volatility window of the month. FOMC Wednesdays are guaranteed to move BTC. Sitting through them passively is leaving money on the table for other traders.
The right answer is not "trade more aggressively" — it is "trade deliberately." Have a plan. Know your scenario triggers. Reduce leverage. Watch the DXY. And if you have no edge on the day, be flat. There is zero shame in sitting out a coin flip.
10. How ChartSnipe Tracks BTC Alongside Forex & Gold on FOMC Days
Bitcoin does not trade in a vacuum on FOMC days. Its biggest moves come from the interplay with DXY, gold, US yields, and the S&P 500. This is exactly why ChartSnipe tracks BTC as one of 32 live instruments alongside 28 FX pairs, gold, the S&P 500, and the US tech 100. When Powell talks, you see the entire risk regime reprice in a single view — not just the BTC candle in isolation.

On FOMC mornings, the AI News Impact dashboard shows you the consensus expectations, the key risks for the day, and a ranked view of which instruments carry the highest conviction and which are best avoided. The USD strength card is the single most relevant tile for a Bitcoin trader — it aggregates the dollar's move against seven major crosses into one number, and BTC trades as an inverse of that number more reliably than it trades any on-chain metric. If USD strength is ticking red through the press conference, the setup for a BTC rip is there; if it is ticking green, the bid is gone.
Beyond the news dashboard, the chart analysis tool lets you drop a BTC screenshot from any platform — TradingView, Binance, Coinbase — and get instant AI-powered pattern recognition, support/resistance levels, and entry zones. On FOMC Thursdays, this is where most of our users spend the first hour of the session sizing up the follow-through move.

For traders also watching NFP, CPI, or central bank meetings, we've written companion playbooks: the NFP trading strategy guide applies the same event-driven framework to non-farm payrolls, and how to read the economic calendar walks through how to find the consensus numbers that define "hawkish" and "dovish" in the first place.

And if you're wondering how AI stacks up against manual chart reading more generally, our breakdown of AI forex chart analysis in 2026 and does ChatGPT work for trading charts covers the comparison in detail.
The ChartSnipe edge on FOMC days: you see BTC, DXY, gold, and the S&P 500 together, with AI-generated daily context on each — not 32 browser tabs of TradingView and Discord noise.

ChartSnipe Pricing
- Free: 2 chart analyses per month + unlimited Trading Quiz
- Pro ($20/month): 120 analyses + Daily News Impact Analysis (BTC, FX, gold, indices)
- Premium ($50/month): 600 analyses + all features including Liquidity Snipe mode
See full pricing on the pricing page.
Frequently Asked Questions
Why does Bitcoin dump before the FOMC decision?
Bitcoin often bleeds into the FOMC decision because leveraged traders de-risk ahead of a high-uncertainty event. Market makers widen spreads, funding rates cool, and longs get trimmed to avoid catastrophic wicks. It is not bearish conviction — it is risk reduction. Once the decision is out and uncertainty collapses, liquidity returns and price frequently rips in the opposite direction of the pre-event drift.
How does FOMC affect Bitcoin compared to stocks?
Bitcoin reacts to the same macro inputs as the S&P 500 and Nasdaq — liquidity, real yields, and dollar strength — but with 3 to 5 times the amplitude. When the SPX moves 1% on Powell, BTC typically moves 3 to 5%. Bitcoin is essentially a high-beta risk asset on FOMC days, which is why crypto traders cannot ignore the Fed calendar.
What is the DXY-BTC inverse correlation?
The US Dollar Index (DXY) and Bitcoin have historically moved inversely around FOMC decisions. A dovish Fed weakens the dollar, which lifts BTC; a hawkish Fed strengthens the dollar, which weighs on BTC. The correlation is not perfect and it breaks during liquidity crises, but it is the single most useful macro signal for BTC positioning on FOMC day.
Should I hold Bitcoin through FOMC?
HODLers can ride through FOMC because their horizon is measured in years, not hours. But for anyone running leverage, trading short-term swings, or managing a size-appropriate book, FOMC days demand a specific plan — reduce leverage, widen stops, or flatten entirely into the release and redeploy once the press conference trend is clear.
What time does the FOMC decision come out and when does BTC move?
The FOMC statement drops at 2:00 PM ET (19:00 UTC) and the Powell press conference begins at 2:30 PM ET. Bitcoin typically delivers its biggest move in the first 30 seconds after 2:00 PM on the statement, then a second larger move between 2:30 and 3:15 PM during the presser as Powell qualifies his tone. The post-conference drift from 3:15 to close often continues the press conference direction.
Is there a repeatable Bitcoin FOMC pattern?
Yes — the "dump-then-rip" pattern is well documented across multiple FOMC cycles. BTC drifts lower in the 24 to 48 hours before the decision as leverage is unwound, then reverses hard once uncertainty resolves. The direction of the rip depends on how dovish or hawkish Powell actually sounds relative to expectations, which is why watching the press conference matters more than the statement alone.
The Bottom Line
Bitcoin is not decoupled from the Federal Reserve. It is one of the most Fed-sensitive assets on the board, and FOMC days are where most of the damage — and most of the opportunity — happens. The traders who consistently come out ahead on Powell Wednesdays are the ones who understand the dump-then-rip pattern, watch DXY alongside BTC, wait for the press conference trend to form before committing capital, and size down to survive the tail risk.
Everyone else is gambling. Pick a strategy. Stick to the timeline. And stop chasing the 2:00 PM candle.
Sources & Further Reading
- • Federal Reserve — FOMC Calendar & Statements — official FOMC meeting schedule, statements, and dot plot releases.
- • CME FedWatch Tool — market-implied rate probabilities used by traders to pre-position into FOMC decisions.
- • CoinDesk Markets — BTC price action coverage and on-chain liquidation data during FOMC events.
- • Investopedia — FOMC Explained — primer on the Federal Open Market Committee structure and process.
- • Reuters US Markets — live Fed decision coverage and Powell press conference reporting.
Related Articles

High-Impact Forex News Events
The 15 releases that actually move FX pairs — ranked by pip movement, tradability, and follow-through.

NFP Trading Strategy Playbook
How to trade Non-Farm Payrolls across forex and gold with a repeatable pre-release framework.

How to Read a Forex Economic Calendar
A complete guide to decoding red-folder events, forecasts, and actuals on the economic calendar.
Written by the ChartSnipe Team
ChartSnipe is an AI-powered chart screenshot analysis tool and daily AI news impact analysis platform for forex, gold, Bitcoin, S&P 500, and Nasdaq traders. Our team combines deep experience in technical analysis, AI vision models, and live market data across 32+ instruments to deliver actionable trading insights.
See the next FOMC day in context — for BTC, FX, and gold
Daily AI news impact analysis across 32 instruments including Bitcoin. Updated before every FOMC Wednesday.
Open News Impact Dashboard