
How to Trade the W Pattern (Double Bottom)
A W is a double bottom seen by the traders who search for it by shape. Here is what makes one tradeable, where to enter, where the stop goes, how to measure the target in pips, and the three ways it usually fails.
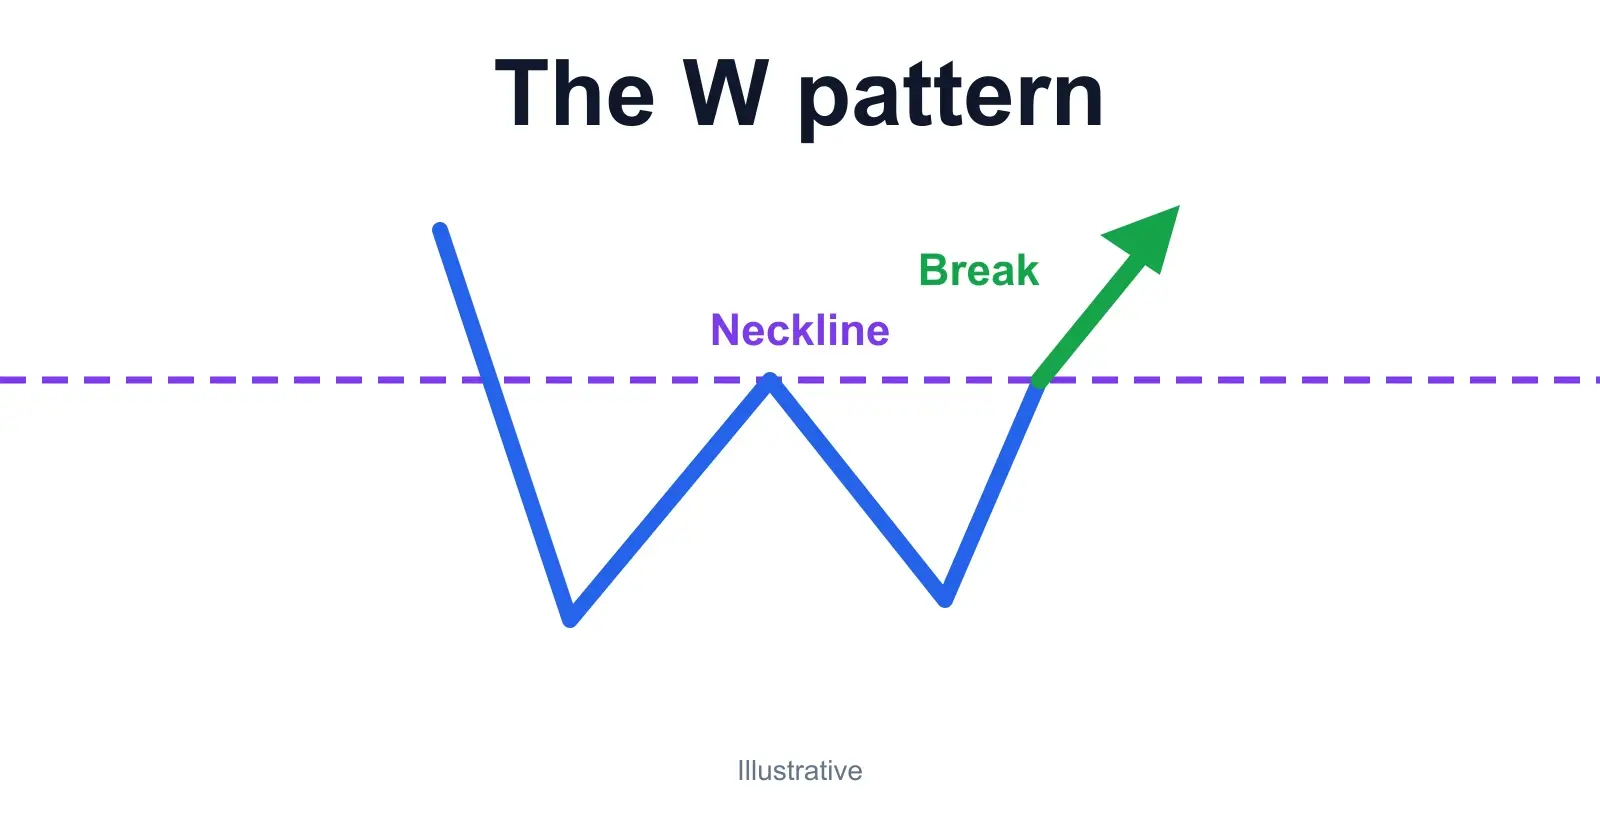
The W pattern is a bullish reversal that looks like the letter W: price drops to a low, bounces to a ceiling, drops back to a similar or higher low, then pushes through the ceiling. If that sounds like a double bottom, it is. Same shape, same rules. Traders who search for "W pattern" are describing what they see, and the textbooks call it a double bottom.
The catch is that almost any chart has two lows that look a bit alike. A tradeable W needs a prior downtrend, a real neckline, lows that sit close together (or a second one that is higher), and a candle that closes above the neckline. The classic entry is that close or a retest of it, with the stop under the second low and a target one W-height above the neckline. For the wider family of reversal shapes, see our guide to double tops, double bottoms and head and shoulders.
Key Takeaways
- →W pattern and double bottom are the same shape. The W is only a trade once a candle closes above the neckline.
- →Six checks separate a W from two random lows: prior downtrend, close lows, a real neckline, volume, a break that holds, and a reward that beats the risk.
- →Target is the neckline plus the W height. Entering on the retest instead of the break turned a 0.69R setup into a 1.22R one in our worked example.
- →The three failures: a W inside a strong downtrend, a neckline break that reverses, and buying the second low before confirmation.
- →The M pattern is the exact mirror: two highs, a close below the trough, a target below it.
1. What is the W pattern in trading?
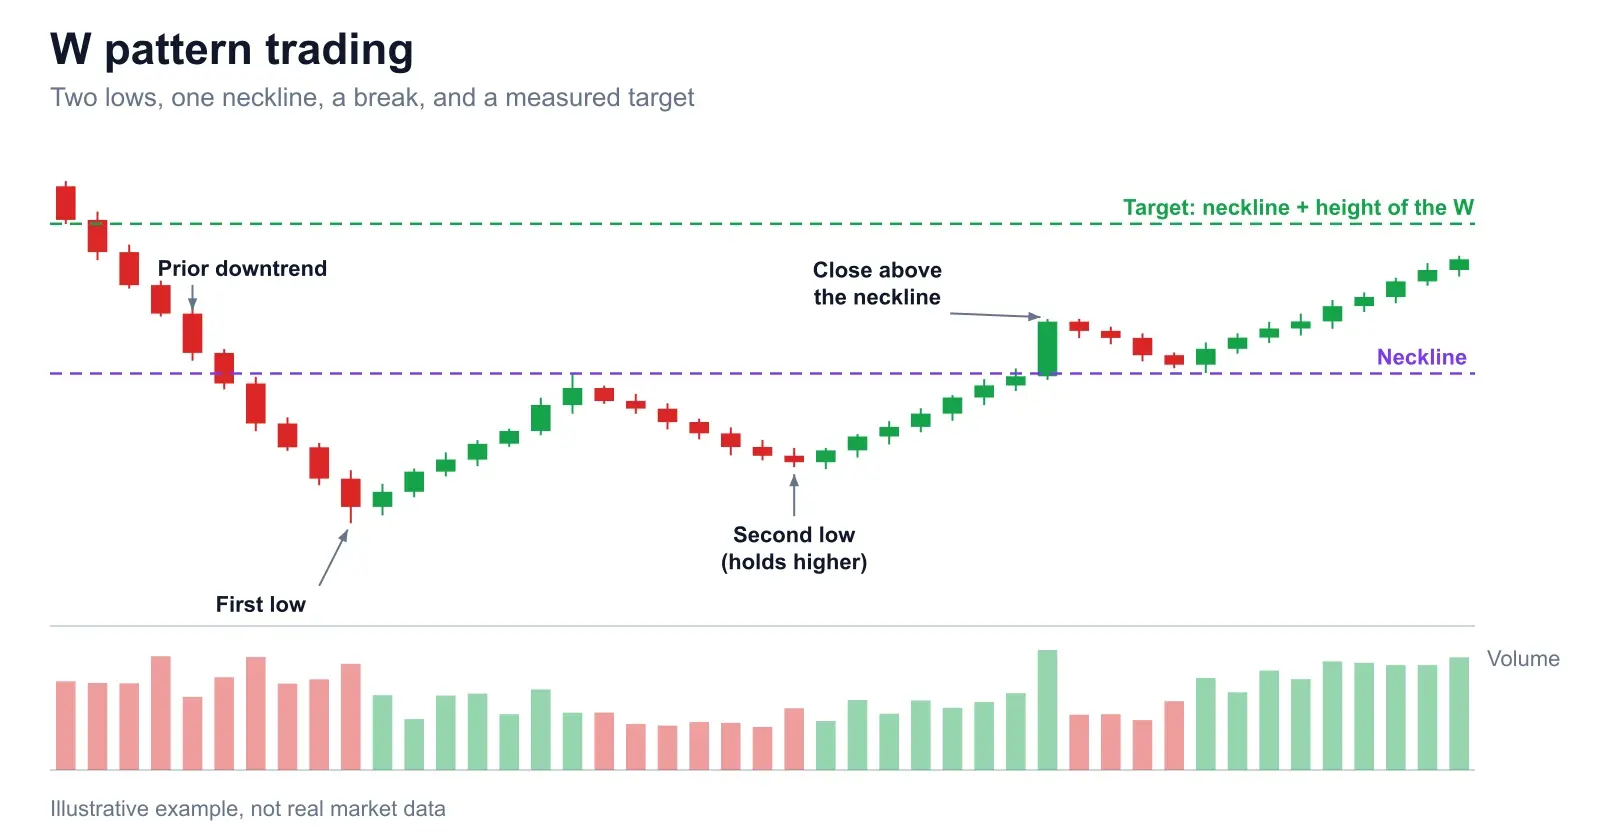
Picture a market sliding for days or weeks. It hits a low, bounces, then slides back to roughly the same area and stops falling. The peak of the bounce is the neckline. When price finally closes above it, buyers have shown they can overpower the sellers who defended that ceiling, and the pattern is complete.
Capital.com's double bottom guide puts the confirmation rule plainly: the pattern is generally only confirmed on a close above the neckline. Until then you have two lows and a hope. That sentence is the most useful thing in this whole post, because most W trades that go wrong were entered before it was true.
On naming: "W pattern" and "double bottom" point at the same shape, and the M pattern is the double top. Some traders say W when the second low is clearly higher, or when it dips under the first and snaps back. Those are variations, covered below, and the confirmation rule does not change.
2. A tradeable W versus two lows
Open any chart and you will find two lows that rhyme. What turns them into a setup is context. Tastytrade's double bottom page lists the same ingredients most traders use: a preceding decline, two troughs at similar levels, a neckline, a close above it, and breakout volume above the recent average.
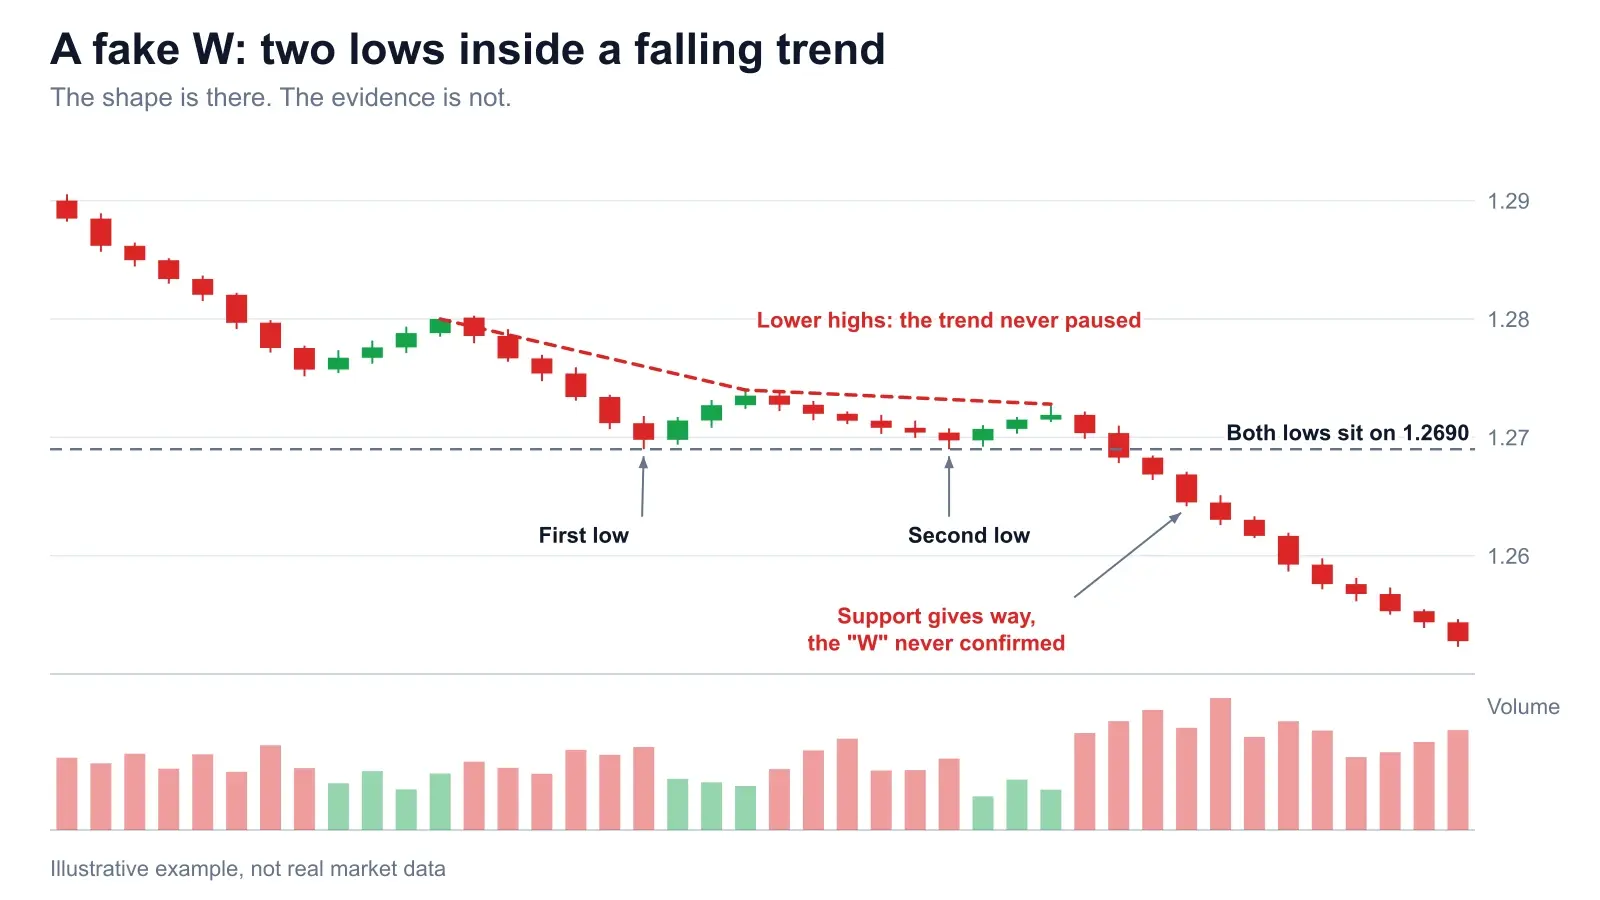
The failure case looks like this. The two lows exist, but they sit inside a steady slide with lower highs the whole way down. Nothing paused. There was no exhaustion, no real bounce, and the second "low" is just the market catching its breath before the next leg.
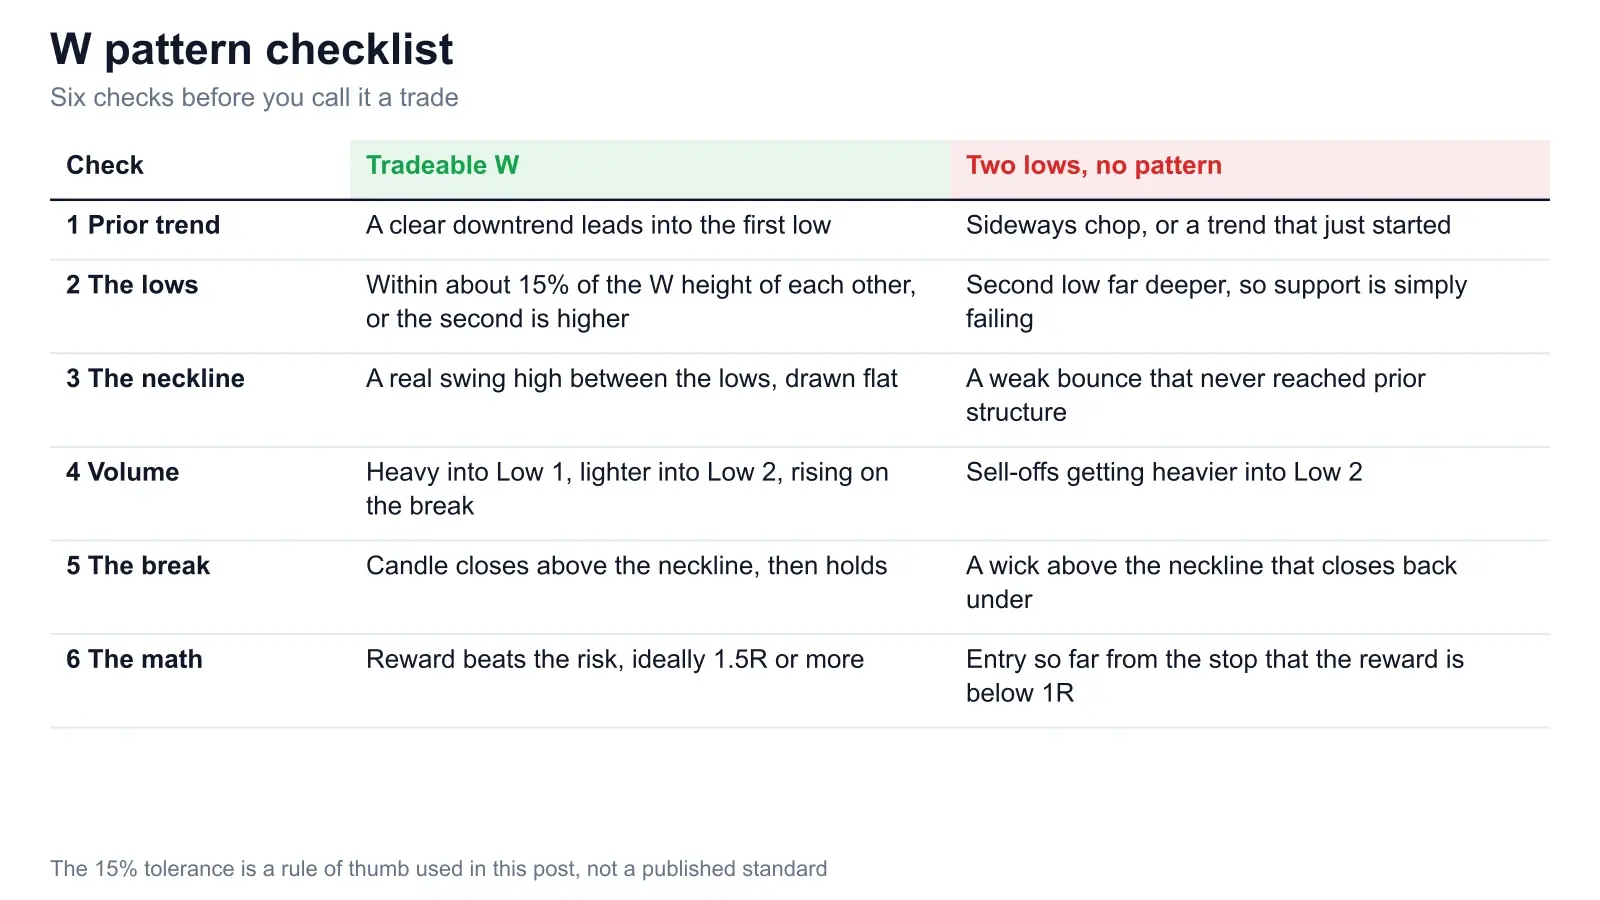
Here are the checks I run before I call it a W:
- A prior downtrend. A reversal pattern needs something to reverse. A W in sideways chop is just a range.
- Lows within a sensible tolerance. My own rule of thumb: the second low within about 15% of the W's height of the first. On an 80 pip W that is roughly 12 pips. Tastytrade says a few percent and StockCharts ChartSchool says within 3%, but both are describing stock charts where a few percent is a lot of room. On a forex pair 3% is hundreds of pips, so I scale the tolerance to the pattern instead. A second low that is higher is fine. One that is far lower means support is failing.
- A real neckline. The peak between the lows should be a proper swing high that stood out before, not a one-candle blip.
- Volume. Often heavier into the first low, lighter into the second, and expanding on the break. Tastytrade flags a breakout on light volume as more failure-prone. Spot forex volume is tick volume, so treat it as a rough guide there.
- The second low holds or sweeps. It either holds above the first, or briefly undercuts it and closes back above.
- The maths works. Covered in the worked trade below. If the reward does not beat the risk, skip it.
3. Equal lows, higher low and sweep
The second low comes in three flavours, and each says something different about the buyers.
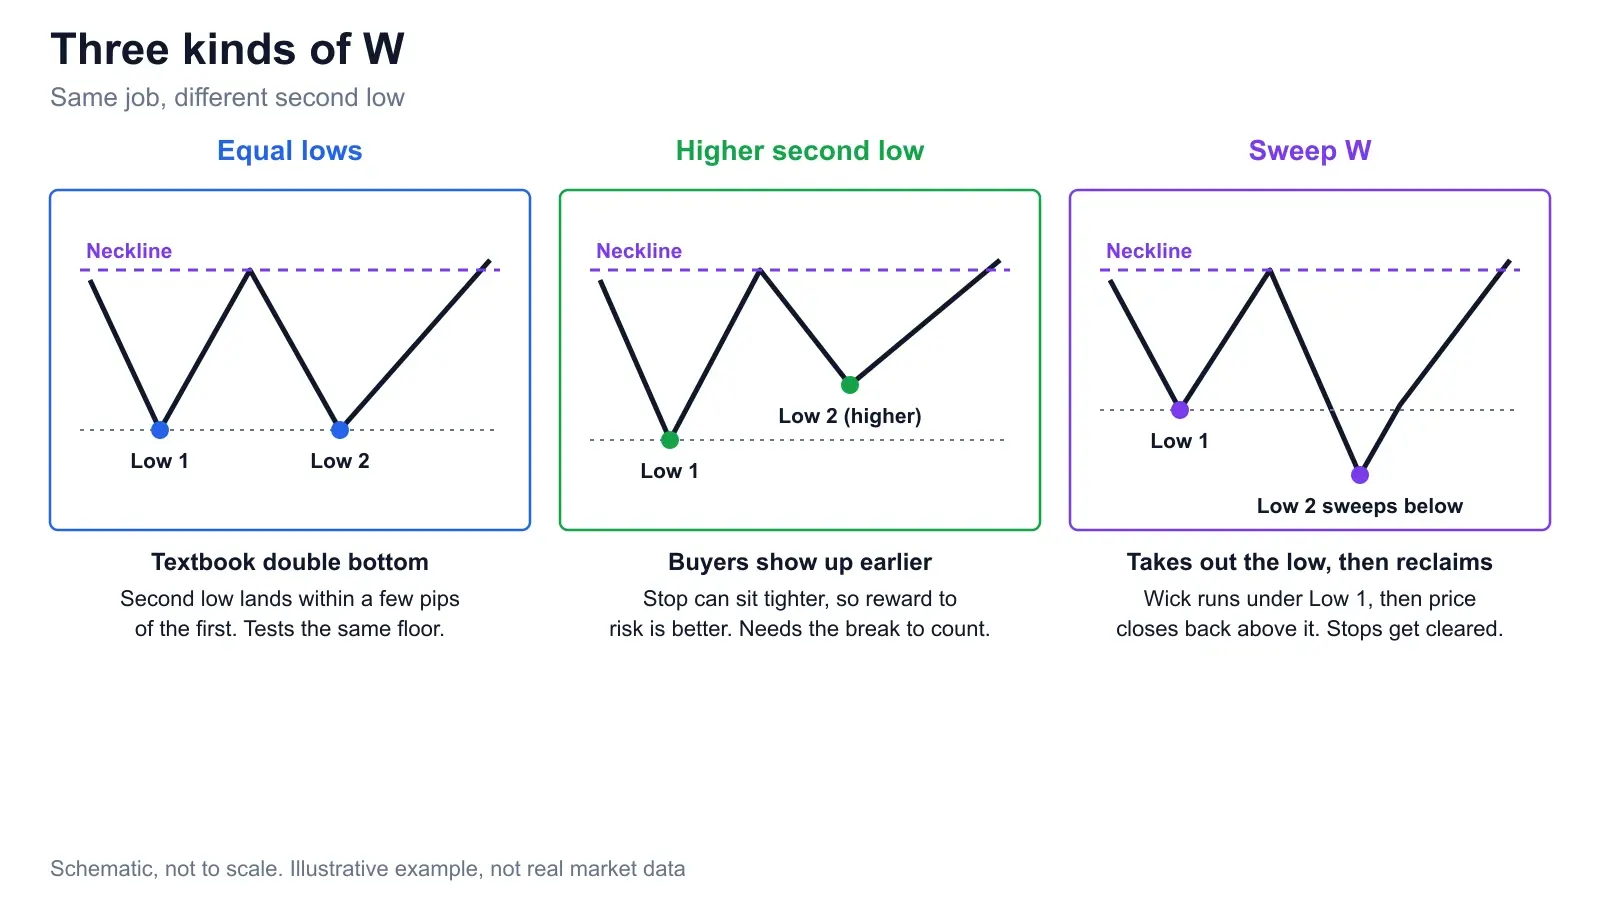
Equal lows are the textbook case: price tests the same floor twice and holds it. A higher second low is the one I like most, because buyers stepped in earlier than the first time, and because the stop can sit tighter, which helps the reward to risk. If you want the stop maths in more depth, our stop-loss placement guide covers structure stops and buffers.
The sweep W is the second low that takes out the first, then reclaims it. The wick runs under the old low, triggers the stops resting there, and price closes back above. It looks like a failure for a few candles and then it is not. This is the same liquidity idea we cover in smart money concepts, order blocks and liquidity: equal lows are where stops pile up, and a sweep is a move designed to collect them.
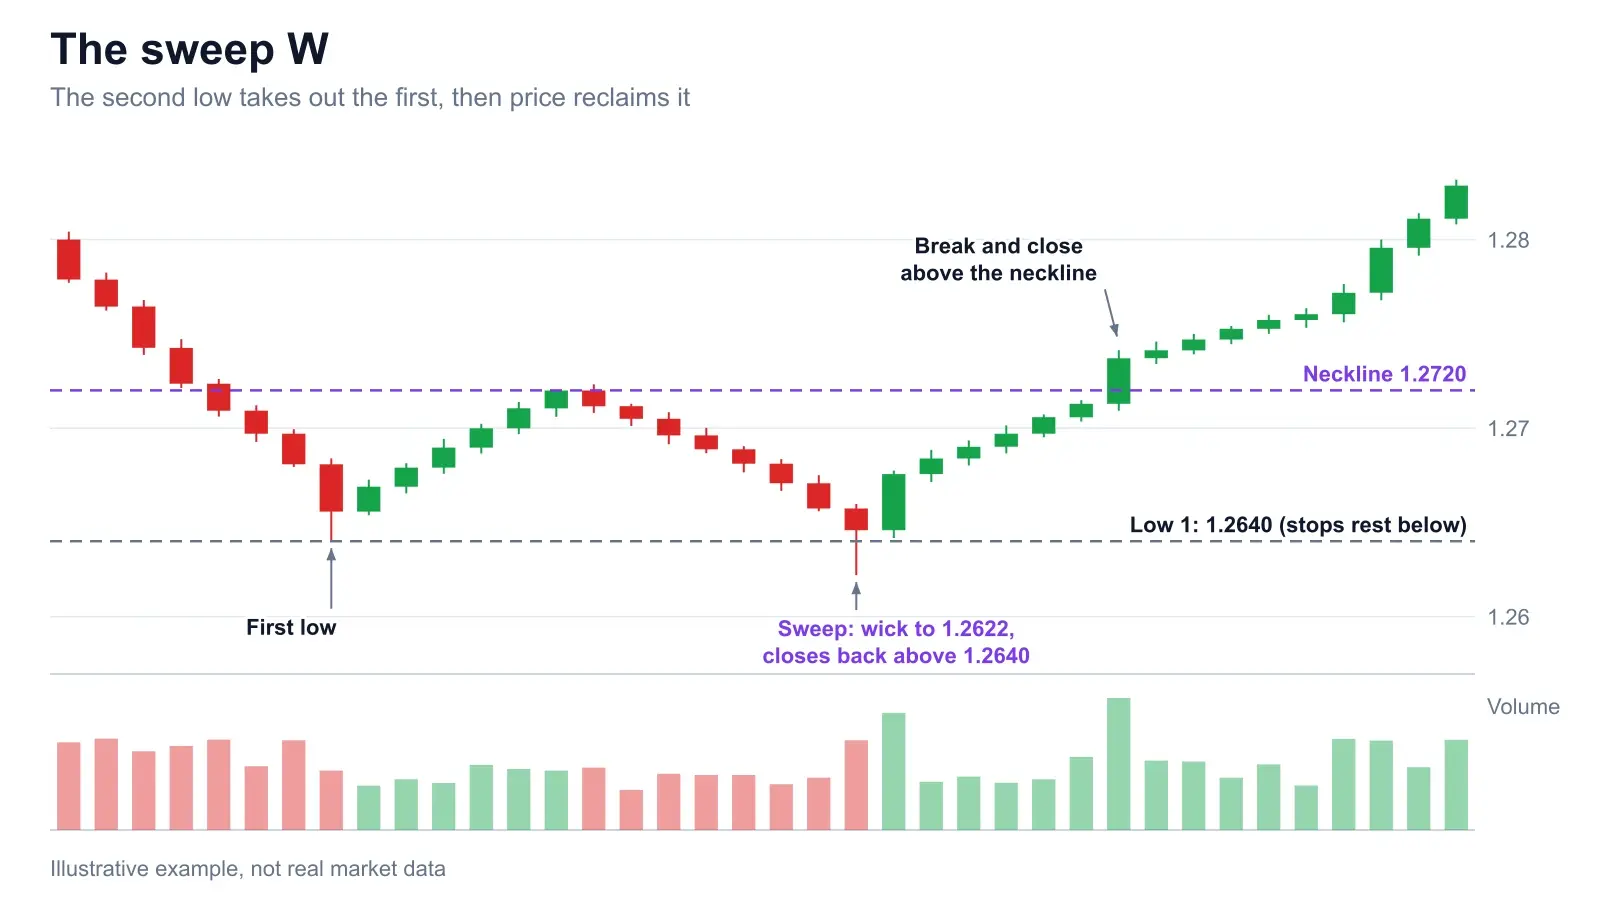
The difference matters for risk. A sweep W gives you a clean invalidation point (the wick low), but only after price has reclaimed the old low. Buying the sweep wick as it forms is just catching a falling knife with extra steps.
4. How to trade the W pattern
There are two standard entries. Both wait for the close above the neckline. They differ in what you do next.
Breakout entry. Buy on the close that clears the neckline. You catch the move early and you risk missing nothing, but you are paying a high price relative to your stop, and breakouts are where false moves live. Retest entry. Wait for price to come back and hold the neckline as support, then buy. Tastytrade treats a retest that holds as one of its three confirmations, and Capital.com notes the trade-off: you get extra confirmation but can miss the move entirely if price never returns.
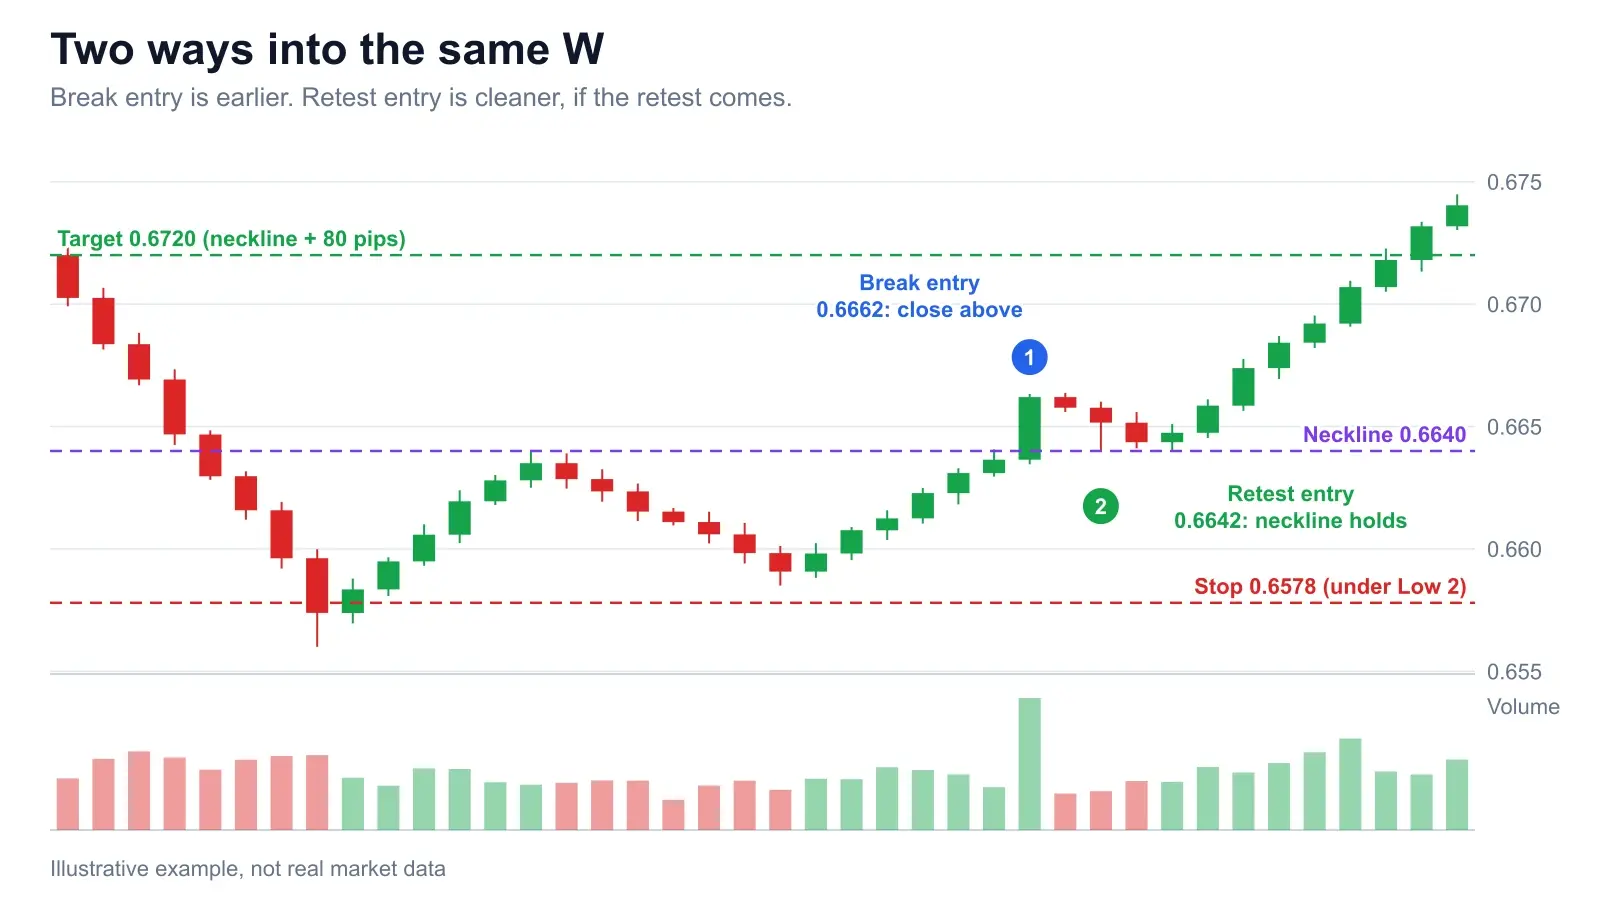
Read the caption again, because it is the whole argument. The target is fixed by the pattern. The stop is fixed by the pattern. The only variable you control is where in between you buy, and that single choice swung the reward to risk from 0.69 to 1.22. That is why many traders refuse to chase the break. It is also why the retest is not free: it often does not come, and the best W breakouts sometimes run without looking back.
A note on stops. The common placement is below the second low, which both sources above agree on, with a small buffer for spread. If you enter on a retest, some traders tuck the stop under the retest low instead. That only works when the retest candle is clean. For the full reward to risk framework, our risk-reward ratio examples show how much win rate each ratio needs.
5. A worked trade with numbers
This is an illustrative setup on EUR/USD, drawn for this post. It is not a real historical trade and the candles are invented. The numbers are what matter.
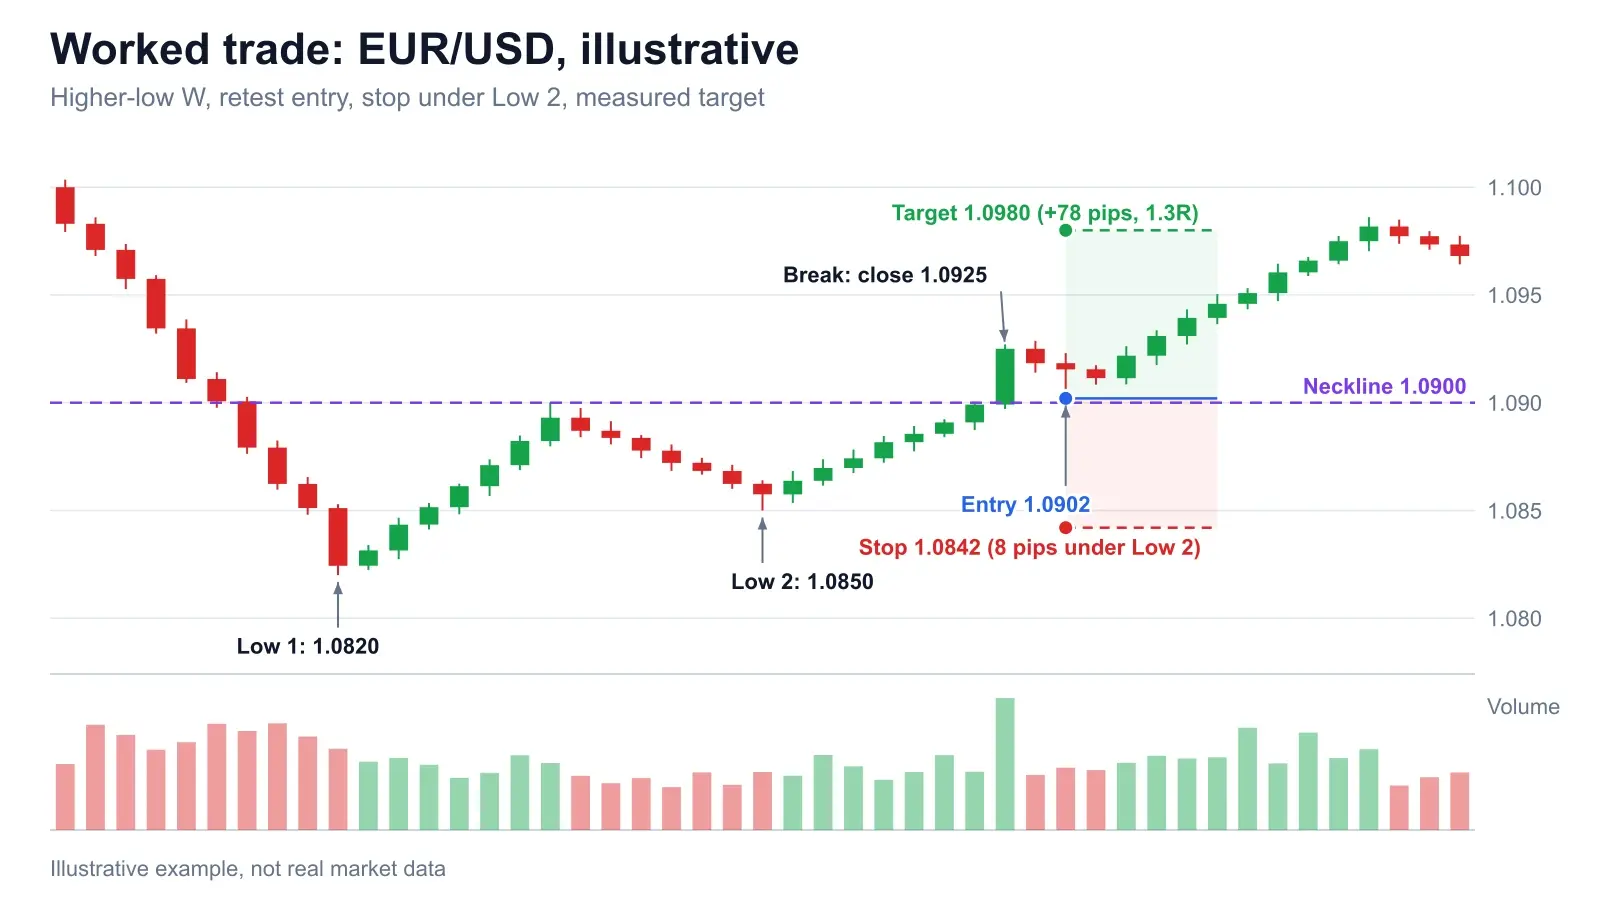
| Step | Level | How it is worked out |
|---|---|---|
| W height | 80 pips | Neckline 1.0900 minus lowest low 1.0820 |
| Entry (retest) | 1.0902 | Limit order just above the neckline after the 1.0925 break close |
| Stop | 1.0842 | 8 pips under the second low of 1.0850 |
| Risk | 60 pips | 1.0902 minus 1.0842 |
| Target | 1.0980 | Neckline 1.0900 plus 80 pips |
| Reward | 78 pips | 1.0980 minus 1.0902 |
| Reward to risk | 1.3R | 78 divided by 60 |
| Position size | 0.16 lots | 1% of $10,000 is $100; $100 / 60 pips = $1.67 per pip, about 0.17 lots; rounded down to 0.16 lots = $96 at risk, $124.80 to target |
At 1.3R you need to win about 43.5% of the time to break even (1 divided by 2.3), before spread. That is a fair but not generous trade. Because the stop sits under the second low and the target is only one W-height up, the 1.3R only exists because the second low is higher. With equal lows at 1.0820 the same entry needs a stop near 1.0812, which is 90 pips of risk for 78 of reward, or 0.87R. An entry at the neckline with equal lows always risks a full W-height plus a buffer to make one W-height, so it can never reach 1R. If I want more, I look for a higher second low (which shrinks the risk, as here), a next resistance level well above the target, or a plan to take half off at the target and trail the rest. The same logic works on gold, where the W height is just measured in dollars per ounce instead of pips.
6. When the W fails
A W is a probability, not a promise. Capital.com says outright that no chart pattern is a guarantee, so I will not quote you a success rate. What I can do is show you how it breaks. There are three ways.
1. The W inside a strong downtrend. The fake W earlier is this. Lower highs, heavier selling, and a second low that is just a pause. If the neckline sits far below where the decline began, you are buying a small bounce in a big fall. Check the higher timeframe before you trust a W on the lower one, as we explain in our multi-timeframe analysis guide.
2. The neckline break that reverses. A wick above the neckline, or a close that barely clears it on light volume, and then price falls back under. Tastytrade describes the false breakout as price closing back below the neckline within a few sessions, and a break below the second trough as the sign the downtrend is resuming.
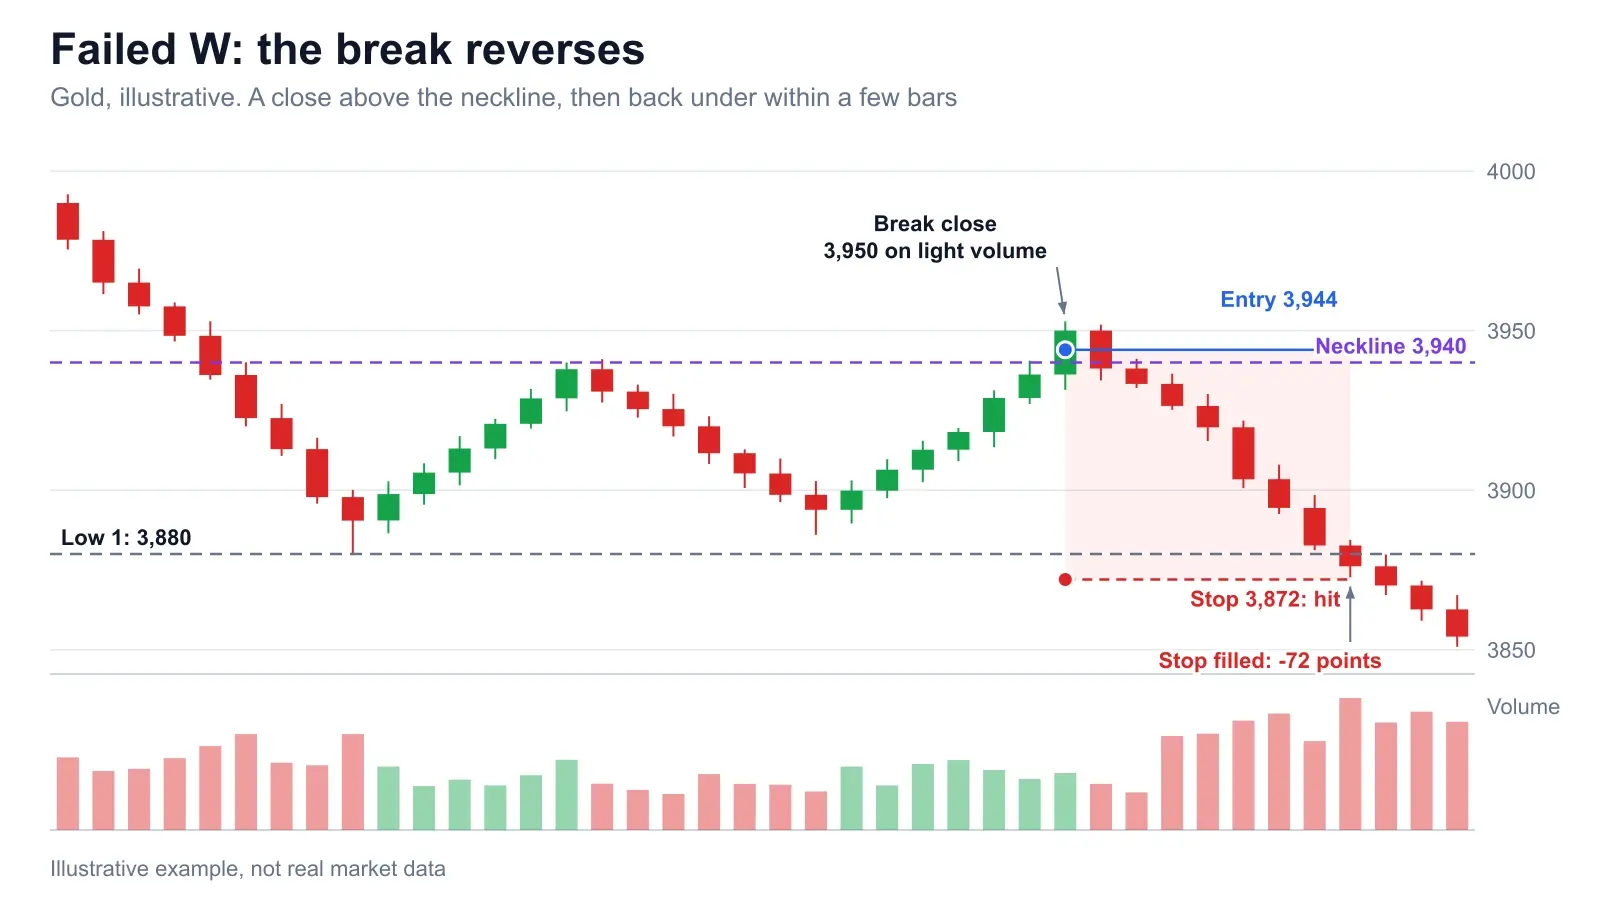
Look at the maths of the loser. The W height was 60 points (3,940 minus 3,880), so the measured target was 4,000. From the 3,944 entry that is 56 points of reward against 72 points of risk: 0.78R. The trade was a poor bet before it started, and the light-volume break was the warning. A setup that needs more than a coin flip to break even, and shows weak confirmation, is a pass.
3. Buying the second low before confirmation. This is the most common one. The second low looks like the first, the price feels cheap, and you buy it with a tight stop. Sometimes it works and you tell people about it. Often it is the first low of the next leg down, and you are the liquidity. Wait for the close.
7. What is the M pattern?
The M pattern is the W turned upside down. After an uptrend, price makes a high, pulls back to a trough, rallies to a similar high, and fails. The neckline runs through the trough. When a candle closes below it, the pattern is confirmed, the stop goes above the higher of the two highs, and the measured target is the neckline minus the height of the M. StockCharts' double top reversal page says the same: the pattern is complete only after support breaks, and the break should come with expanding volume.
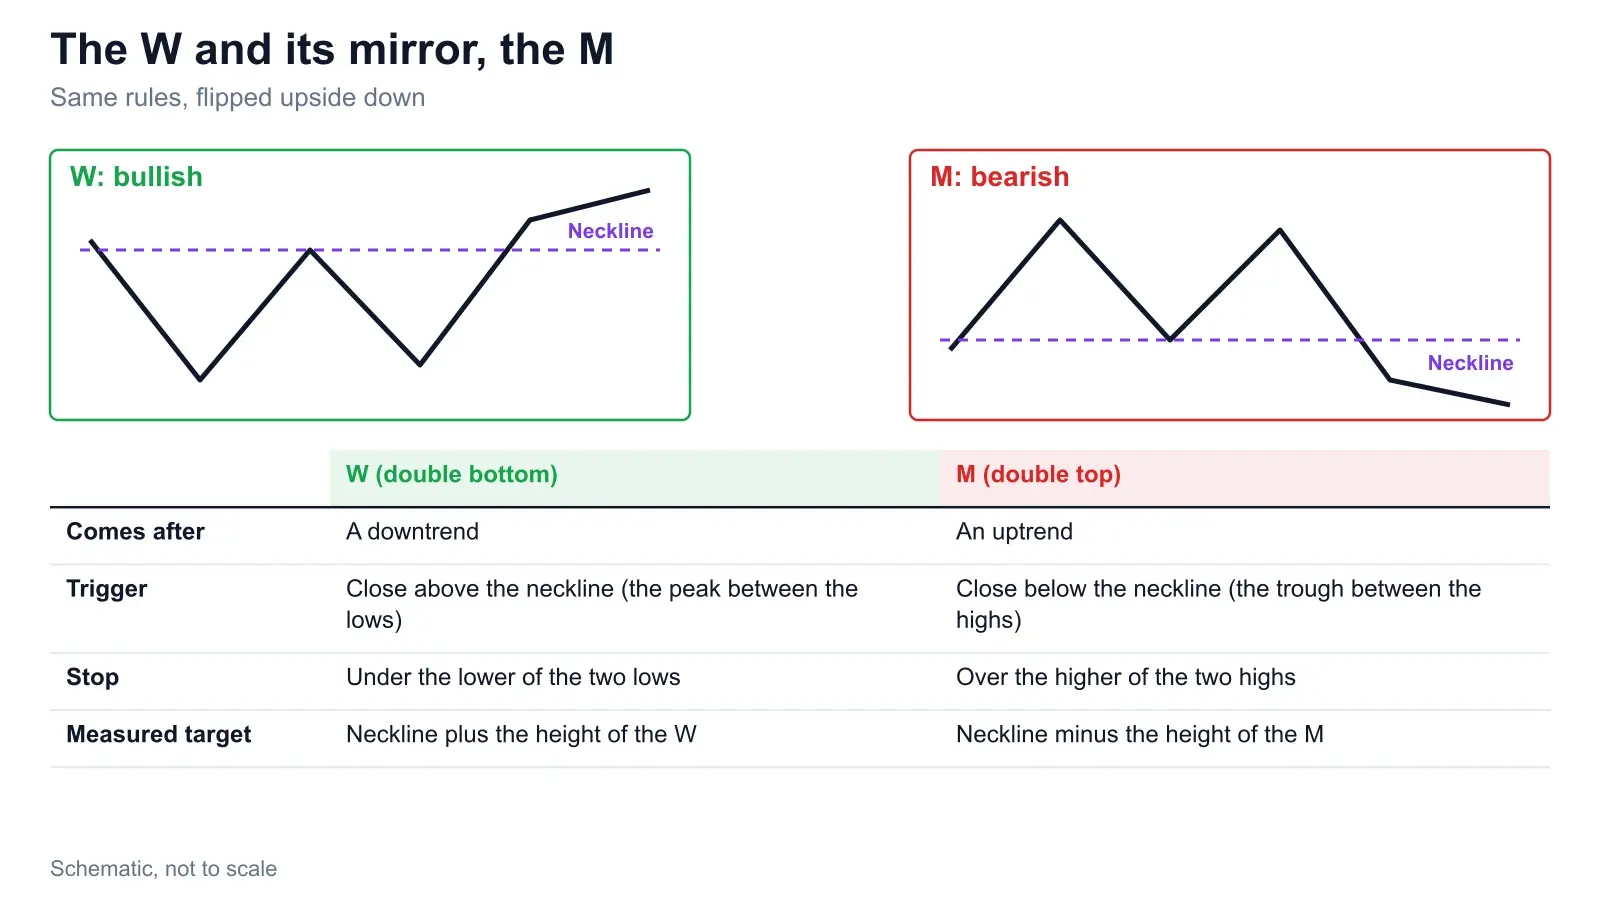
All the same cautions apply, mirrored. An M inside a strong uptrend is a pause, not a top. A break below the trough that closes back above it is a failed M. Our double top and bottom guide covers the pair side by side.
8. Checking a W with ChartSnipe
If you are staring at two lows and cannot decide whether they are a W, screenshot the chart and put it through the Chart Snipe tool. It reads the screenshot for trend, patterns and key levels and gives entry and risk guidance, which makes it a useful second opinion on the neckline and the stop. It is not a signal service and it can misread a messy chart, so check that the neckline it identifies is the one you would draw. Then log the outcome in the trading journal, because after twenty W trades your own numbers will tell you more than any article.
Frequently asked questions
What is the W pattern in trading?
The W pattern is a bullish reversal that looks like the letter W on a chart: price falls to a low, bounces to a neckline, falls back to a similar or higher low, then breaks above the neckline. It is the same shape traders also call a double bottom. It is only confirmed when a candle closes above the neckline.
What is the difference between a W pattern and a double bottom?
Nothing in the shape. W pattern is the name traders use when they search for it by what it looks like, and double bottom is the textbook name. Some traders use W more loosely, to include a second low that is clearly higher or one that sweeps below the first low and reclaims it.
How do you calculate the target for a W pattern?
Measure from the lowest low to the neckline, then add that distance to the neckline. With lows at 1.0820 and 1.0850 and a neckline at 1.0900, the height is 80 pips and the measured target is 1.0980. Treat it as a guide, not a promise.
Where does the stop loss go on a W pattern?
Below the second low, with a small buffer for spread and noise. If you enter on a retest, some traders use the retest low instead. A close back below the second low means the pattern has failed, so the stop should not sit inside the pattern.
Why do W patterns fail?
Three common reasons: the W forms inside a strong downtrend and is just a pause, the neckline break is a wick or a weak close that reverses, or the trader buys the second low before any confirmation. Breaking below the second low usually means the downtrend is resuming.
What is the M pattern in trading?
The M pattern is the mirror of the W, a bearish reversal after an uptrend. Price makes two similar highs with a trough between them, and the pattern is confirmed when a candle closes below that trough. The stop goes above the higher high and the measured target is the neckline minus the height of the M.
Sources & further reading
- → Capital.com: double bottom trading strategy, the close-above-neckline confirmation, retest trade-off and measured target.
- → Tastytrade: double bottom pattern, confirmation checks, volume, stop placement and failure cases.
- → StockCharts ChartSchool: double bottom reversal, prior trend, 3% trough tolerance, breakout volume and the measured target.
- → StockCharts ChartSchool: double top reversal, the mirror M pattern, volume and its measured target.
All price examples in this post are invented for illustration. None of them are real historical trades, and nothing here is a promise of profit.
Got a possible W on your screen?
Upload a screenshot to the Chart Snipe tool and see where it puts the neckline, the trend and the risk. Compare it with your own read before you place the order.