Smart Money Concepts: Order Blocks & Liquidity Guide
A complete breakdown of institutional trading patterns including order blocks, market structure breaks, liquidity grabs, Wyckoff phases, and ICT Power of Three setups.
Smart Money Concepts (SMC) have transformed how a new generation of traders understand markets. Instead of relying on lagging retail indicators like RSI or MACD, SMC traders focus on where institutional capital is flowing by reading the footprints that banks, hedge funds, and market makers leave on price charts. If you have ever been stopped out right before price reversed in your direction, you have experienced smart money at work.
The core idea is simple: retail traders lose money because they trade against institutions without realizing it. Smart money needs liquidity to fill large orders, and that liquidity comes from retail stop losses and breakout entries. By understanding concepts like order blocks, market structure breaks, liquidity grabs, and Wyckoff phases, you can stop being the liquidity and start trading alongside the institutions. This guide covers 12 essential SMC and ICT patterns with real chart examples, entry strategies, and the logic behind each setup.
These concepts draw from Richard Wyckoff's original work on accumulation and distribution from the early 1900s, modernized and expanded by the ICT (Inner Circle Trader) methodology. Whether you trade forex, crypto, or indices, understanding how smart money operates gives you a structural edge. For more advanced pattern recognition including fair value gaps and bull and bear trap fakeouts, see our companion guides.
Order Blocks: The Institutional Entry Zones
Order blocks are arguably the most important concept in SMC trading. They represent the price zones where institutional traders placed massive buy or sell orders before a strong impulsive move. Because institutions cannot fill their entire position at once without moving the market, they leave behind a "footprint" in the form of the last opposing candle before displacement. When price returns to this zone, there is often unfilled institutional interest waiting, making these zones high-probability areas for entries.
A valid order block is confirmed by the displacement that follows it. Displacement refers to one or more large-bodied candles that move aggressively away from the order block zone, often leaving behind fair value gaps. Without displacement, you simply have a regular candle with no institutional significance. The stronger the displacement, the more likely the order block will hold when retested.
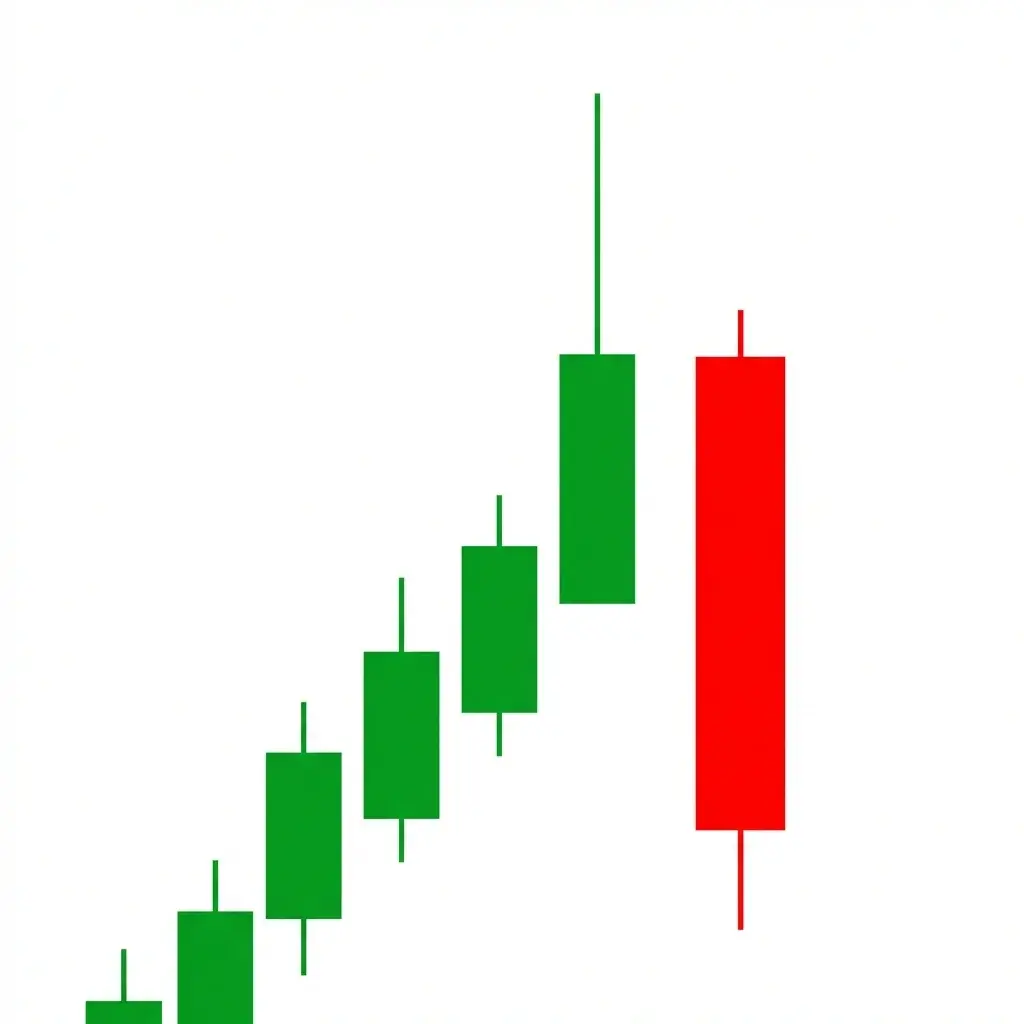
1. Bullish Order Block
What it looks like: A bullish order block forms as the last bearish (down-close) candle before a sharp move upward. The candle body typically engulfs prior price action, and the subsequent move away is aggressive with large-bodied bullish candles. Look for the open of this bearish candle as the top of the zone and the low as the bottom.
What it signals: Institutional buyers absorbed all selling pressure at this level and initiated a strong move higher. The order block represents unfilled buy orders that smart money left behind. When price pulls back to this zone, remaining institutional interest acts as demand, creating a high-probability long entry.
How to trade it: Wait for price to retrace into the order block zone after the impulsive move. Enter long when price shows a bullish reaction from the zone, such as a bullish engulfing candle or pin bar on a lower timeframe. Place your stop loss below the order block low and target the recent swing high or the next liquidity pool above.
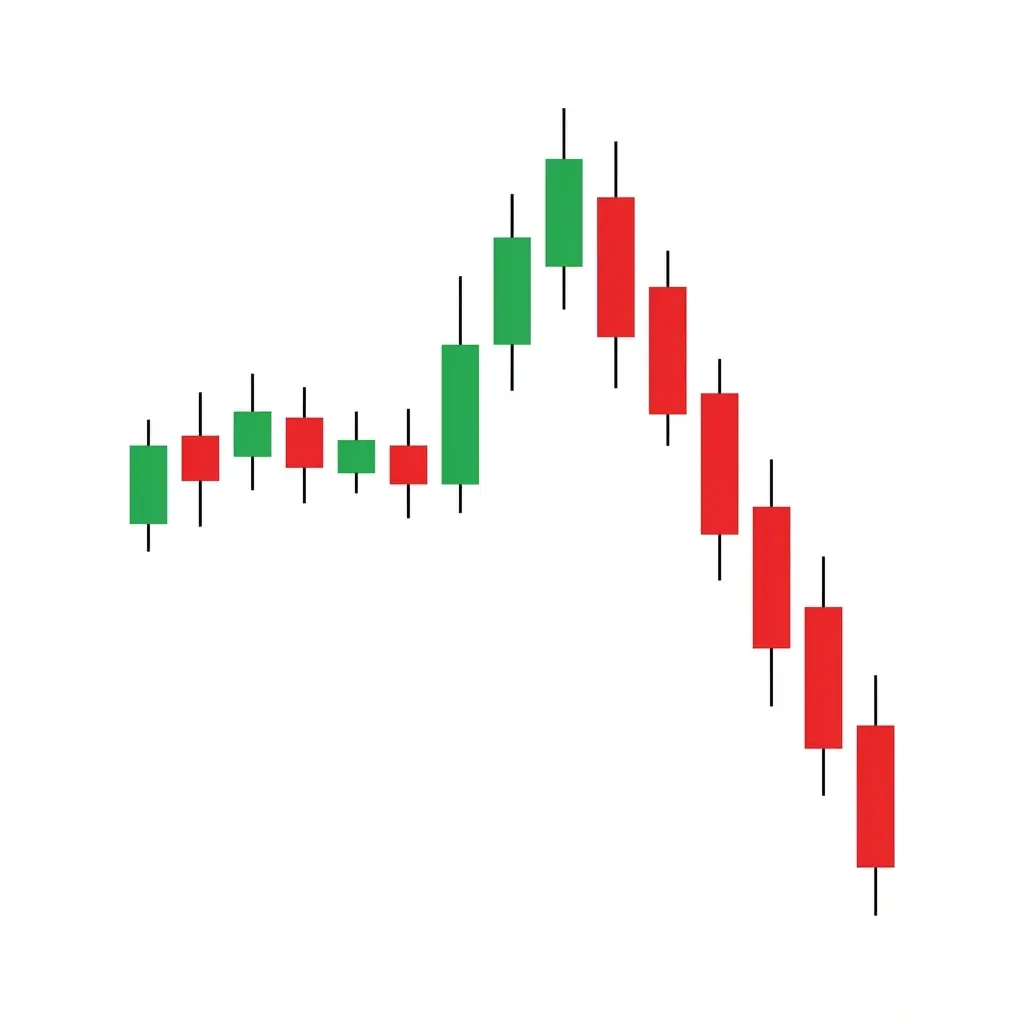
2. Bearish Order Block
What it looks like: A bearish order block is the last bullish (up-close) candle before a sharp sell-off. The candle often appears near a swing high, and the displacement that follows consists of large bearish candles that break through previous structure. The zone extends from the candle's low to its high.
What it signals: Institutional sellers filled their short positions at this level and drove price aggressively lower. The bearish order block marks a supply zone where smart money is positioned short. When price rallies back into this zone, institutions defend their positions by adding more sell orders, creating heavy selling pressure.
How to trade it: Wait for price to rally back into the bearish order block zone. Enter short when you see bearish confirmation such as a rejection wick, bearish engulfing, or change of character on a lower timeframe within the zone. Set your stop loss above the order block high and target the recent swing low or the next area of resting liquidity below.
Market Structure Breaks: Reading the Trend Shift
Market structure is the backbone of SMC analysis. Price moves in a series of higher highs and higher lows during an uptrend, and lower highs and lower lows during a downtrend. A Break of Structure (BOS) confirms trend continuation, while a Change of Character (ChoCH) signals a potential reversal. Understanding when structure shifts is crucial because it tells you when smart money has changed its directional bias.
The key distinction between a BOS and a ChoCH is context. In an uptrend, when price breaks above the most recent swing high, that is a BOS confirming bullish continuation. However, when price breaks below the most recent swing low in that same uptrend, that is a ChoCH signaling that bears may be taking control. Smart money traders wait for these structural shifts before committing capital to a new directional bias.
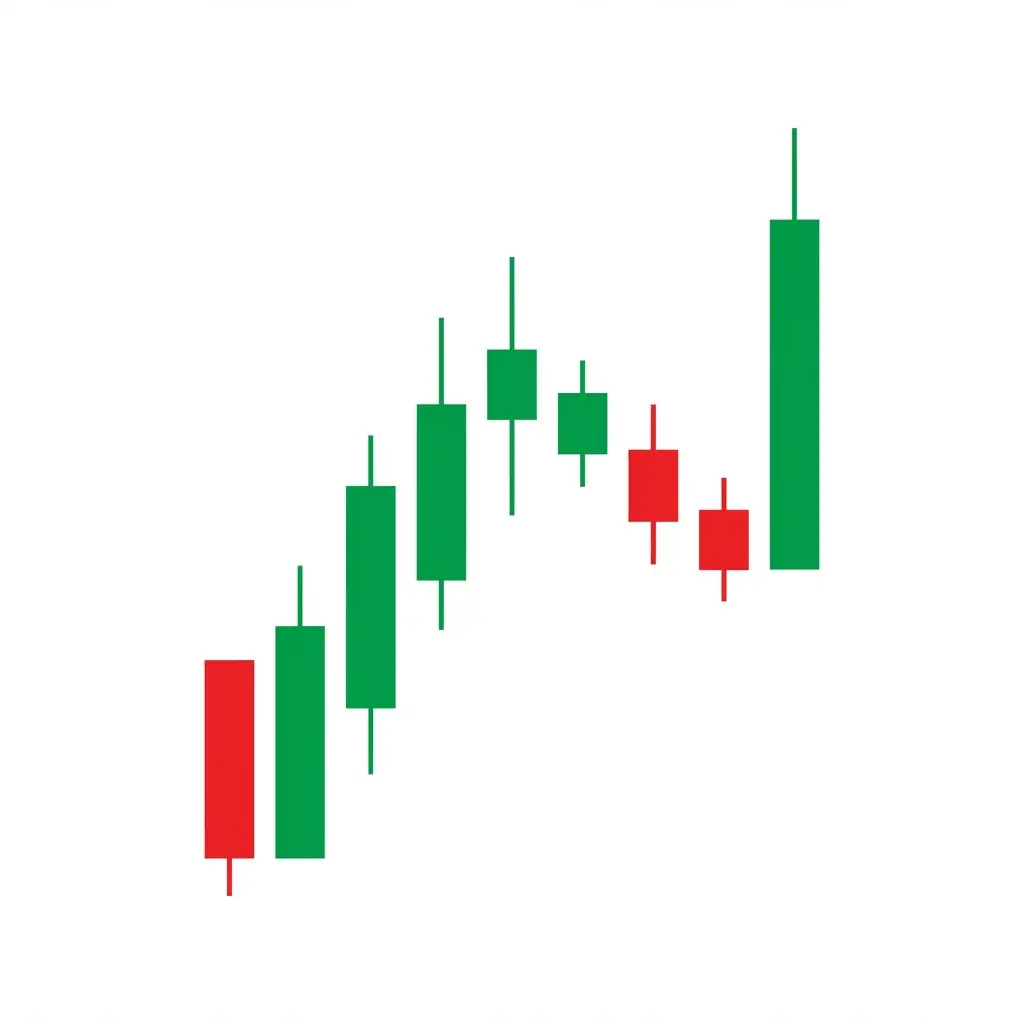
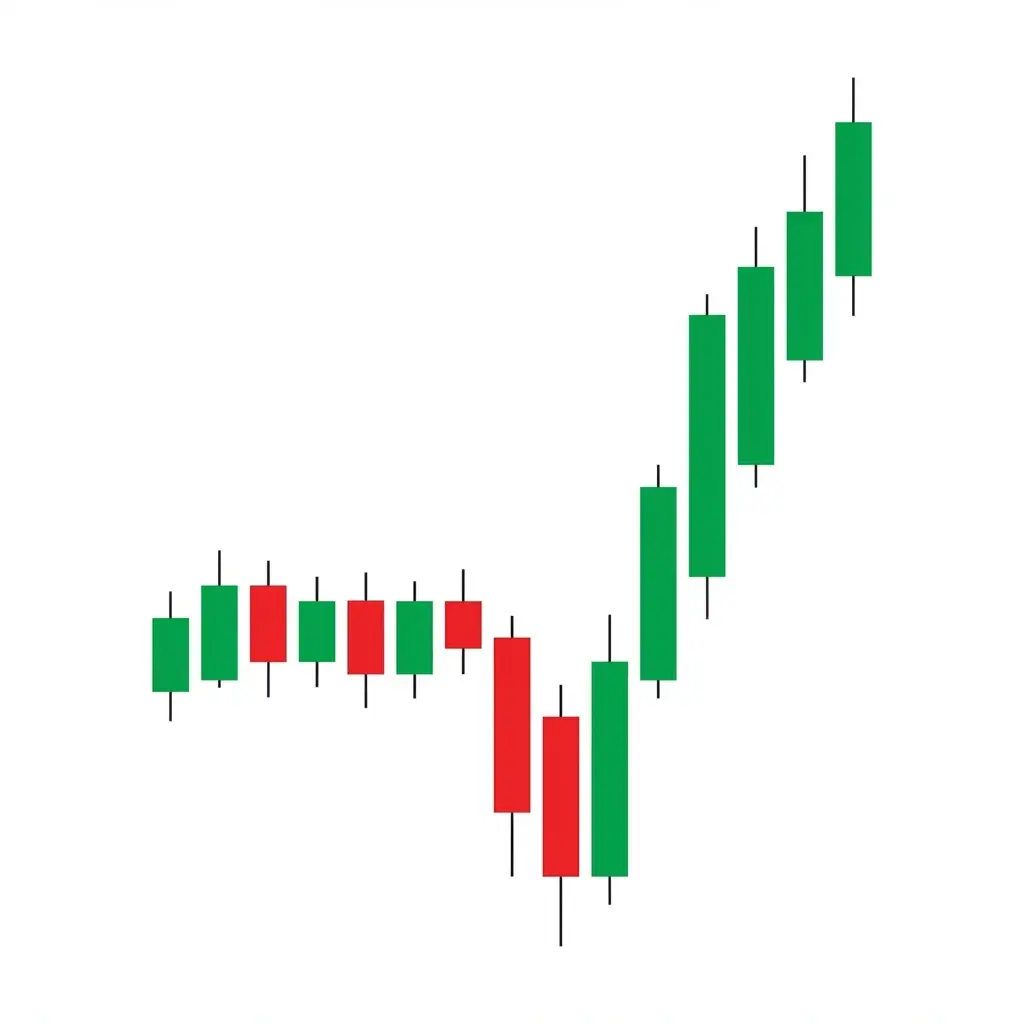
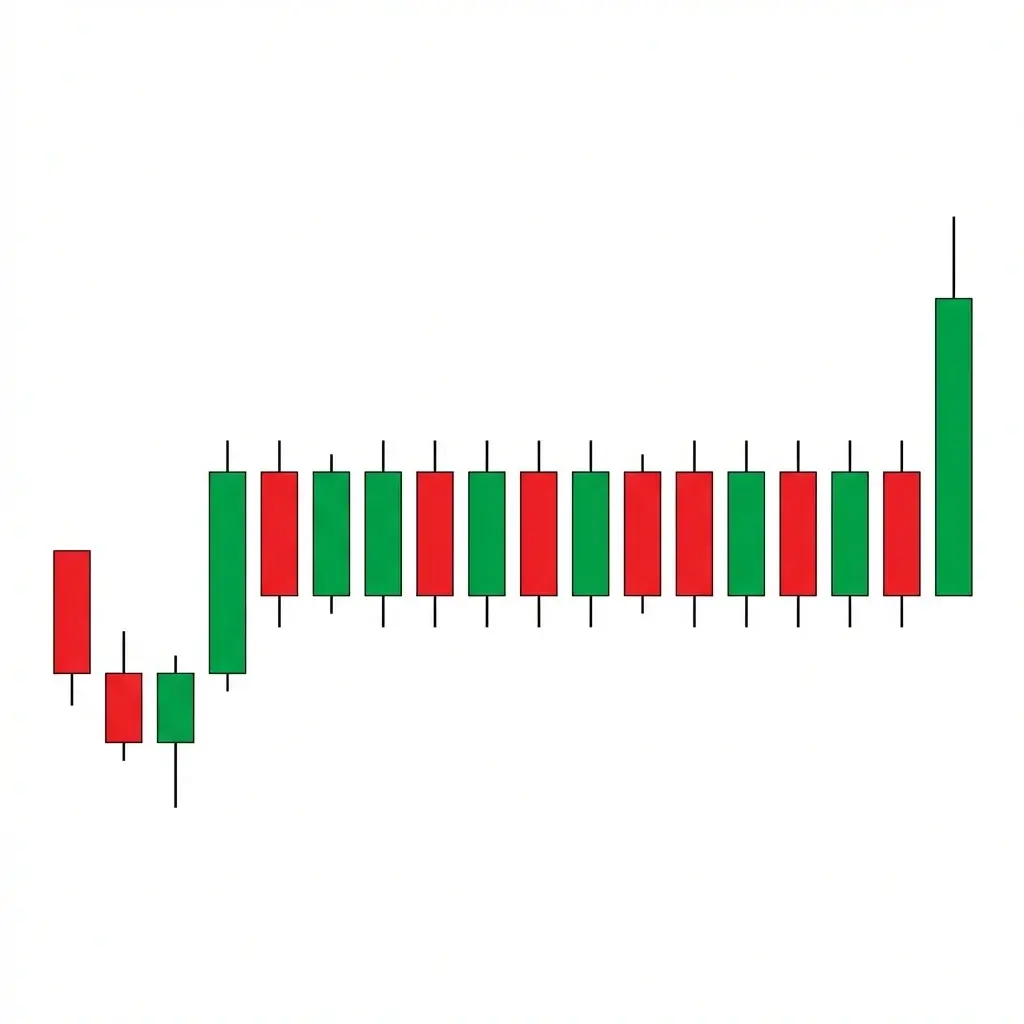
3. Bullish Market Structure Break
What it looks like: A bullish market structure break occurs when price is in a downtrend making lower lows and lower highs, then breaks above the most recent lower high with conviction. The break should come with strong momentum, ideally displacement candles that close well above the broken level. This creates the first higher high in the new structure.
What it signals: The ChoCH from bearish to bullish indicates that institutional selling pressure has been exhausted and smart money is now accumulating long positions. This is often preceded by a liquidity grab below the previous low, where institutions collected the final batch of sell-side liquidity before reversing the market. The structure break confirms their intent.
How to trade it: After the bullish structure break, wait for price to pull back into the order block that caused the break or into the fair value gap left behind. Enter long on the retracement with a stop loss below the swing low that preceded the break. Target the next significant swing high or premium price zone. Avoid chasing the initial break as the best risk-to-reward comes from the pullback entry.
4. Bearish Market Structure Break
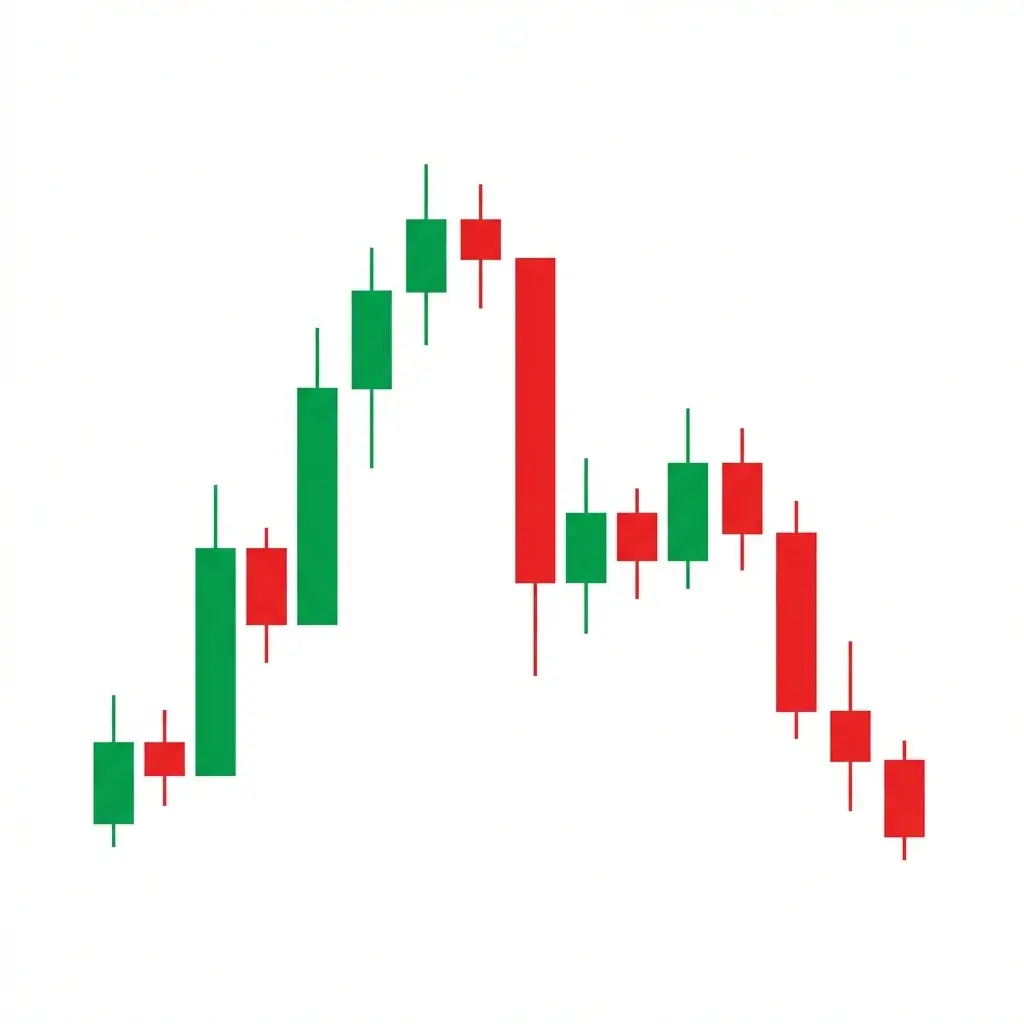
What it looks like: A bearish market structure break happens when price is trending higher with higher highs and higher lows, then breaks below the most recent higher low with aggressive selling. The displacement should be clear, with large bearish candles closing well below the broken level and often leaving fair value gaps in the process.
What it signals: This ChoCH from bullish to bearish indicates that smart money has finished distributing their long positions and is now actively shorting. Institutions often engineer a liquidity grab above the previous high before the breakdown, sweeping buy-side liquidity and retail breakout entries before dumping price. The structural break is the confirmation that distribution is complete.
How to trade it: After the bearish structure break, look for price to retrace into the bearish order block or fair value gap that initiated the break. Enter short when price reaches this supply zone and shows rejection. Place your stop loss above the swing high that preceded the break. Target the next significant swing low or discount price zone where buy-side liquidity rests.
Power of Three: The ICT Session Model
The Power of Three (PO3) is one of the most powerful ICT concepts for intraday traders. It describes how smart money operates within a single trading session through three distinct phases: Accumulation, Manipulation, and Distribution. Understanding this daily cycle reveals why price often fakes out in one direction early in the session before trending in the opposite direction for the remainder of the day.
During accumulation, the market consolidates in a tight range as smart money quietly builds their position. During manipulation, price is pushed in the opposite direction of the intended move to sweep liquidity and trap retail traders. Finally, during distribution, price moves aggressively in the true direction as smart money offloads their accumulated position at a profit. This three-phase cycle is visible on daily candles as well: the open is accumulation, the wick against the close direction is manipulation, and the close represents distribution.
5. Bullish Power of Three
What it looks like: The bullish PO3 begins with a consolidation range during the Asian session or early London session. Price then dips below this range during the manipulation phase, sweeping sell-side liquidity and triggering retail stop losses. After the sweep, price reverses sharply and rallies through the consolidation range, closing near the highs of the session during distribution.
What it signals: Smart money is bullish for the session. The dip below the range is engineered to fill institutional buy orders at discount prices using the liquidity from triggered sell stops. The sharp reversal and rally confirm that the manipulation is complete and institutions are now distributing their position at premium prices as retail traders chase the move higher.
How to trade it: Identify the Asian session range. During the London or New York open, watch for a sweep below the range low. Enter long when price reclaims the range with a bullish displacement candle. Place your stop below the manipulation low and target the opposite side of the range as a minimum, with the session high or a higher-timeframe premium zone as the extended target.
6. Bearish Power of Three
What it looks like: The bearish PO3 starts with a consolidation range, followed by a spike above the range during manipulation that sweeps buy-side liquidity. Price then reverses sharply, breaking below the consolidation range, and sells off aggressively during the distribution phase, closing near the session lows. The upper wick of the daily candle represents the manipulation phase.
What it signals: Institutions are bearish for the session. The spike above the range is designed to trigger buy stops and retail breakout entries, providing smart money with the sell-side liquidity they need to fill their short positions. Once liquidity is collected, price dumps as institutions distribute their short position and retail longs get trapped.
How to trade it: Identify the consolidation range from the Asian session. Wait for a sweep above the range high during the London or New York open. Enter short when price fails to hold above the range and produces a bearish displacement candle back into the range. Stop loss goes above the manipulation high, and your target is the opposite side of the range at minimum, with the session low or discount zone as the extended target.
Wyckoff Spring & Upthrust: The Liquidity Trap
Richard Wyckoff identified these patterns over a century ago, and they remain remarkably relevant because institutional behavior has not changed. The Spring and Upthrust are classic liquidity grabs that occur at the boundaries of trading ranges. In modern SMC terminology, these are stop hunts designed to collect liquidity before the real move begins. Every trader who has been stopped out at the exact low before a massive rally has experienced a Wyckoff Spring.
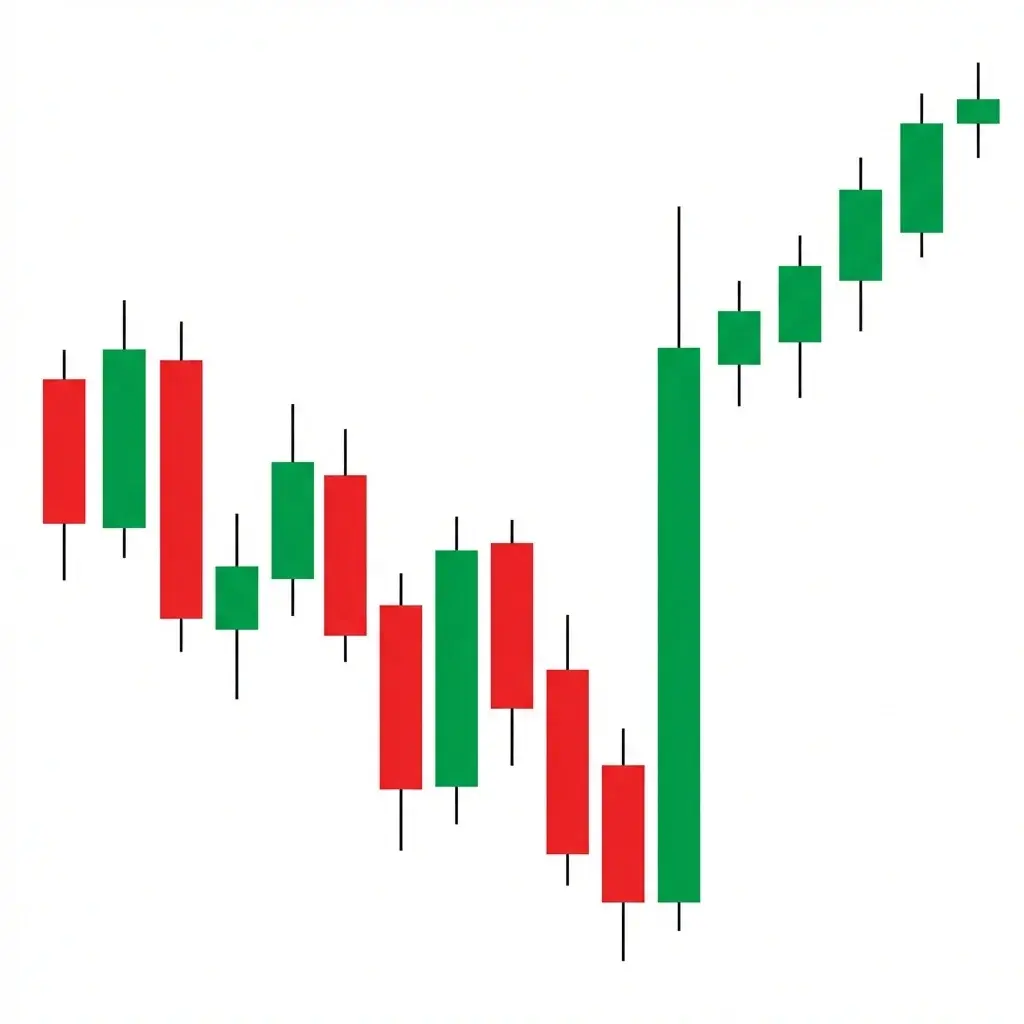
7. Bullish Spring (Wyckoff)
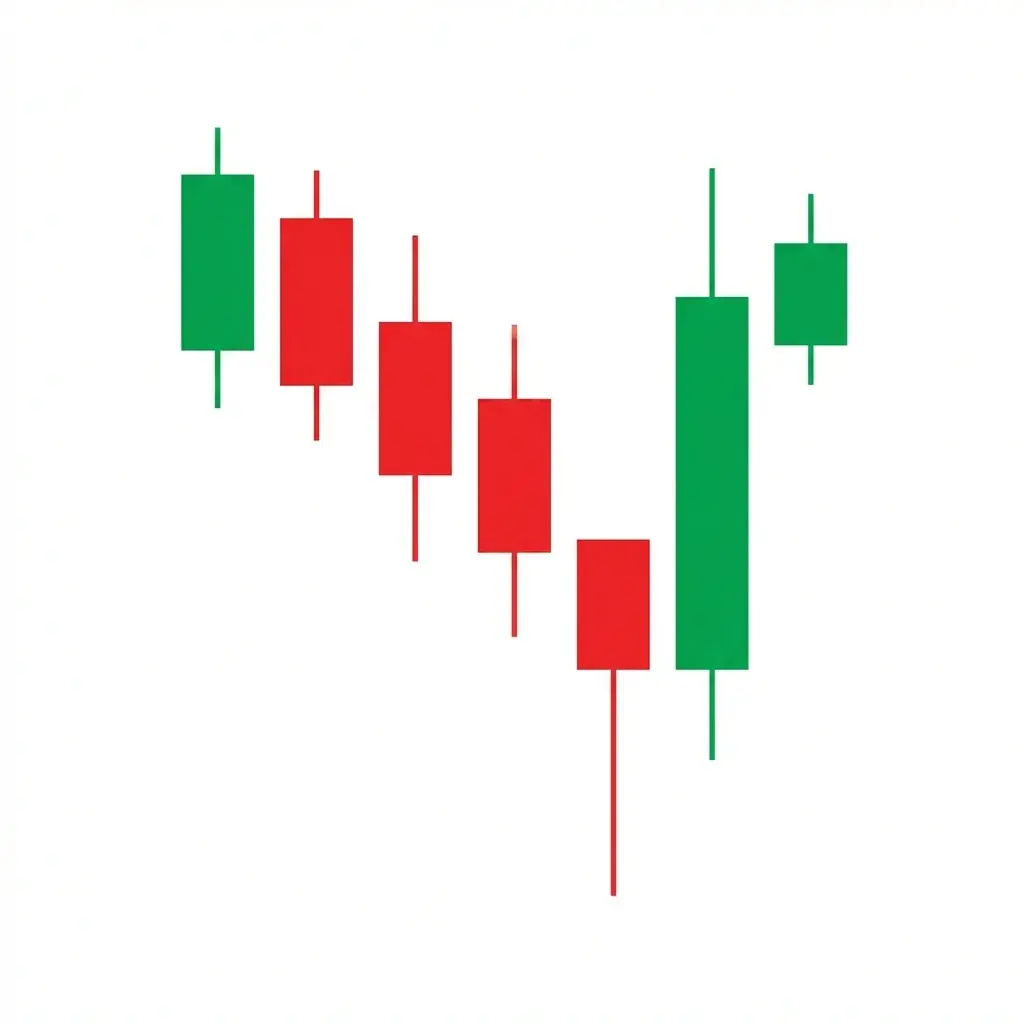
What it looks like: Price trades within a defined range and then briefly breaks below the range support. Instead of continuing lower, price quickly reverses back above the support level. The break below is typically on a long-wicked candle with a close back inside or near the range. Volume often spikes on the spring as stop losses are triggered and institutions fill their buy orders.
What it signals: The spring is a deliberate move by smart money to sweep sell-side liquidity resting below the range support. Retail traders who shorted the breakdown and those whose long stop losses were triggered provide the liquidity institutions need to accumulate large long positions. The rapid recovery signals that selling pressure is exhausted and the accumulation phase is nearing completion.
How to trade it: Wait for price to break below the range support and then reclaim it with conviction. Enter long when price closes back above the support level, ideally with a bullish candle that shows strong buying. Place your stop loss below the spring low, which represents the extreme of the liquidity sweep. Target the range high initially, with higher targets as the markup phase begins.
8. Bearish Upthrust (Wyckoff)
What it looks like: Price is trading within a range and spikes above the resistance level, creating a false breakout. The move above resistance is short-lived, and price reverses quickly back below the resistance level. The candle typically has a long upper wick, showing that buyers could not sustain the higher price. This upthrust often occurs after a prolonged distribution phase.
What it signals: Smart money engineered a breakout above resistance to sweep buy-side liquidity. Retail traders who bought the breakout and those with buy stops above resistance provided the sell-side liquidity that institutions needed to fill their short positions. The failure to hold above resistance and rapid reversal confirms that distribution is complete and the markdown phase is about to begin.
How to trade it: Watch for price to spike above range resistance and then fail to hold, closing back below with a bearish candle. Enter short on the close back below resistance or on the next bearish confirmation candle. Stop loss goes above the upthrust high. Target the range low as the initial objective, with lower targets as the markdown continues. This pattern is particularly powerful when combined with bull trap fakeout confirmation.
Accumulation & Distribution: The Full Wyckoff Cycle
Wyckoff's accumulation and distribution schematics describe the complete cycle of how smart money transitions markets between trends. Accumulation is the process of institutions building long positions after a markdown (downtrend), while distribution is the process of institutions offloading long positions and building shorts after a markup (uptrend). These phases can last weeks or months and contain multiple internal patterns including springs, upthrusts, tests, and signs of strength.
Reaccumulation and redistribution are pauses within an existing trend where institutions add to their positions before the trend continues. These look similar to accumulation and distribution but occur mid-trend rather than at trend reversals. Recognizing the difference between an accumulation (reversal) and a reaccumulation (continuation) is one of the most valuable skills an SMC trader can develop.
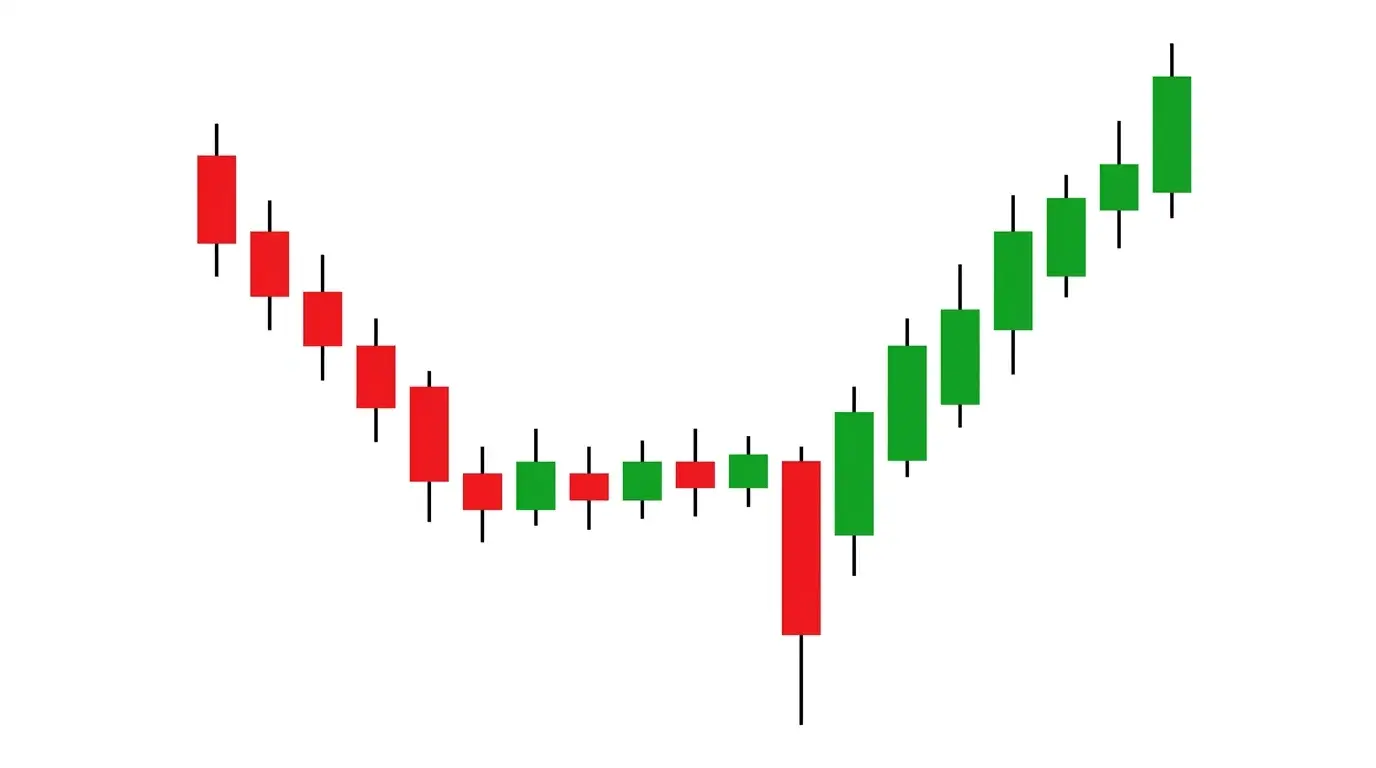
9. Bullish Accumulation
What it looks like: After a prolonged downtrend, price enters a trading range. The structure typically includes a Selling Climax (SC) where panic selling creates a sharp low, an Automatic Rally (AR) that bounces from the climax, and a Secondary Test (ST) that retests the low on declining volume. A Spring may occur to sweep final sell-side liquidity before a Sign of Strength (SOS) rally breaks above the range.
What it signals: Smart money is systematically absorbing all available supply from retail sellers, panicked longs exiting at a loss, and short sellers pressing their advantage. Each phase serves a purpose: the selling climax stops the markdown, the secondary test confirms selling pressure is waning, and the spring collects the last pocket of liquidity. When accumulation is complete, institutions have built a substantial long position and are ready to mark price up.
How to trade it: The highest-probability entry is after the spring and sign of strength. Wait for the spring to sweep below the range low, then enter long when price rallies back above support with a strong bullish candle. Alternatively, enter on the Last Point of Support (LPS) pullback after the SOS, which is essentially a retest of the breakout level. Stop loss goes below the spring low, and your target is a measured move equal to the range height projected upward.
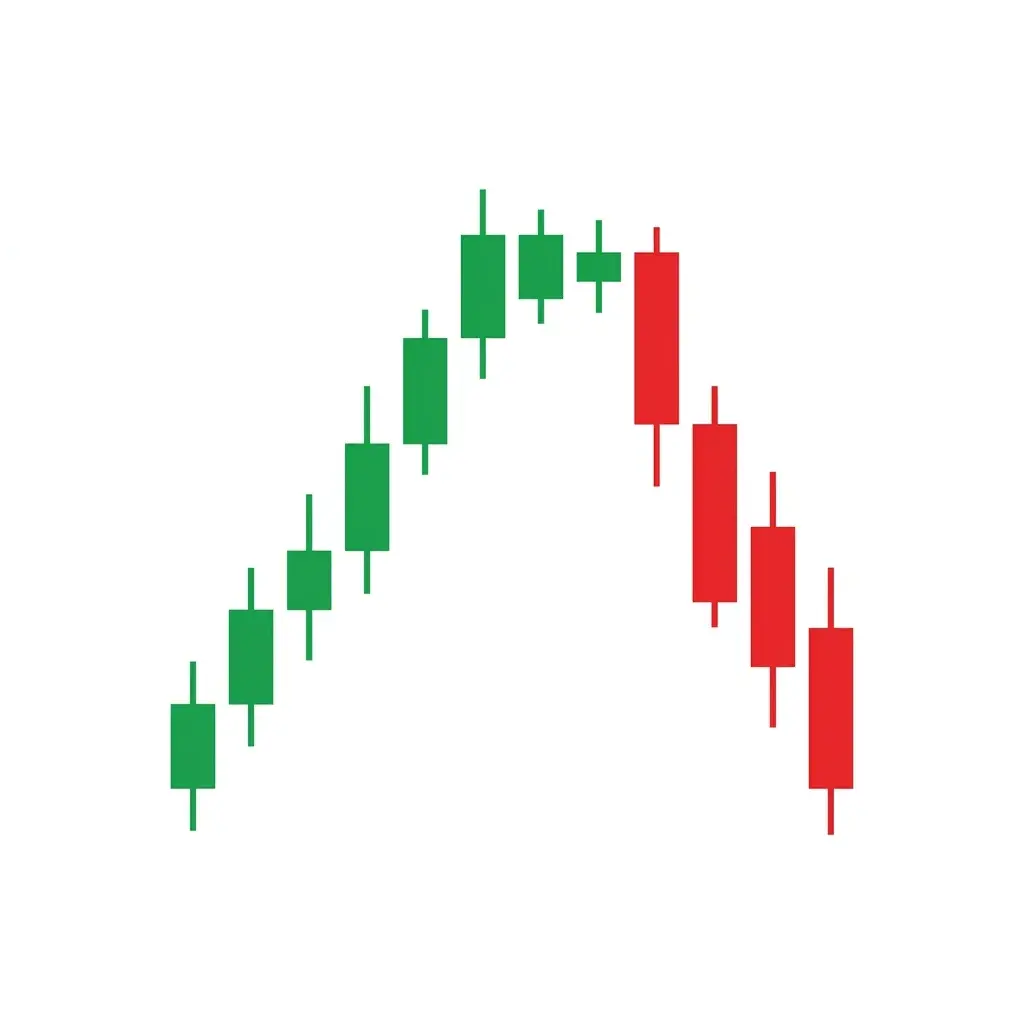
10. Bearish Distribution
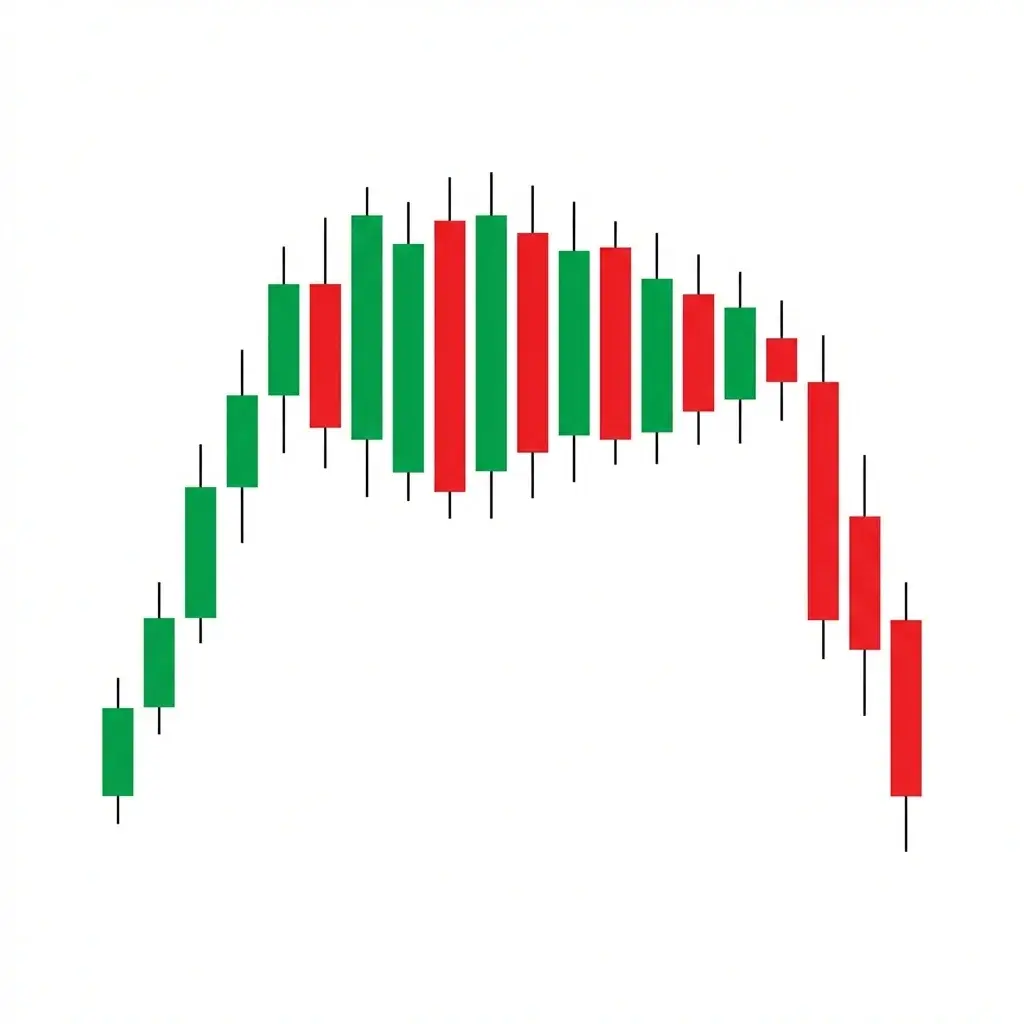
What it looks like: After a prolonged uptrend, price enters a trading range at the top. The structure includes a Buying Climax (BC) where euphoric buying creates a sharp high, an Automatic Reaction (AR) that sells off from the climax, and a Secondary Test (ST) that retests the high on declining volume. An Upthrust After Distribution (UTAD) may sweep buy-side liquidity before a Sign of Weakness (SOW) breaks below range support.
What it signals: Smart money is systematically distributing their long positions to eager retail buyers, FOMO traders entering late, and short sellers covering too early. The buying climax represents peak retail enthusiasm, while each subsequent test of the high on lower volume reveals that institutional buying has dried up. They are handing off their positions to the public at premium prices before marking price down.
How to trade it: The best short entry is after the upthrust and sign of weakness. Wait for the upthrust to sweep above the range high, then enter short when price drops back below resistance with conviction. Alternatively, short the Last Point of Supply (LPSY), which is a weak rally that fails to reach the range high before rolling over. Stop loss goes above the upthrust high, and your target is a measured move equal to the range height projected downward.
11. Bullish Reaccumulation
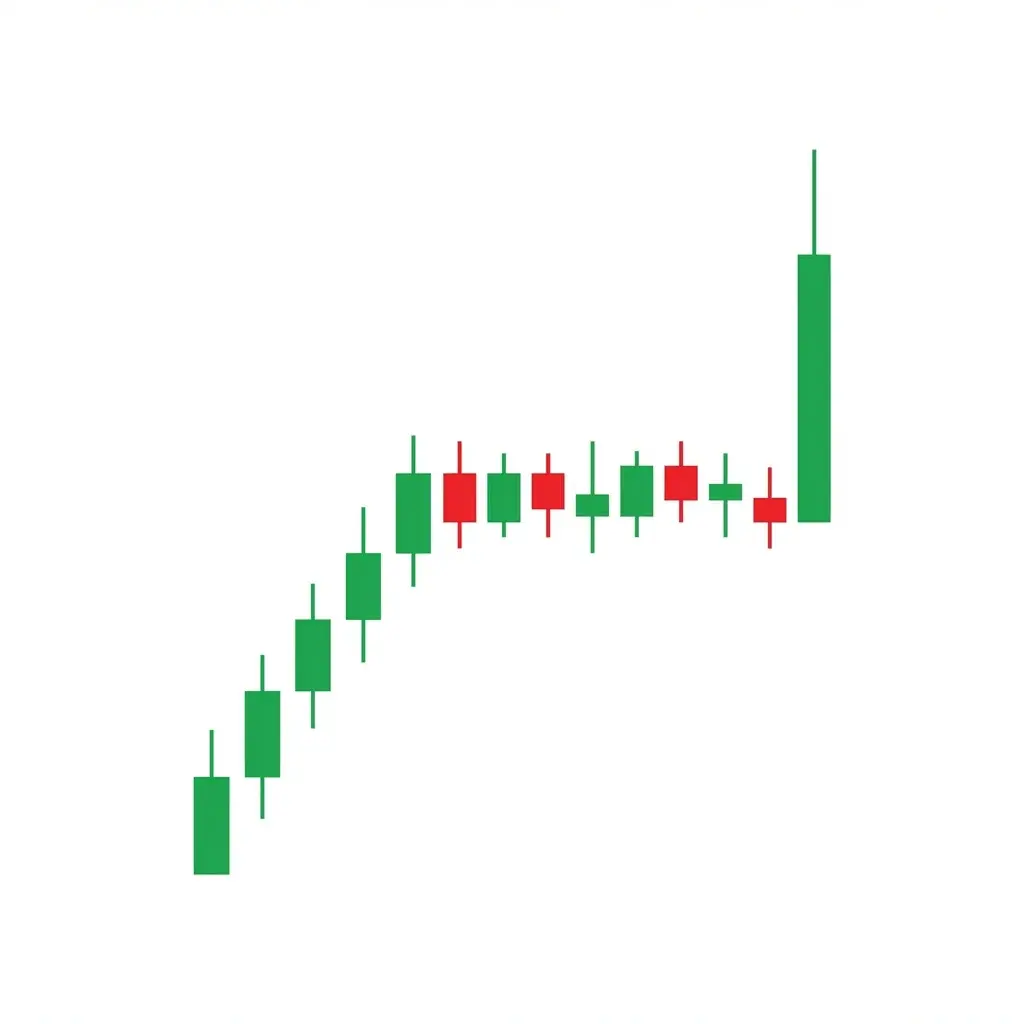
What it looks like: During an established uptrend, price pauses and consolidates into a range that looks similar to a distribution pattern. The range has a defined support and resistance, and may include a shakeout (spring) below support. However, the overall context is bullish, the range forms after a markup leg, and the eventual breakout is to the upside. Volume typically contracts during the range and expands on the breakout.
What it signals: Institutions are not distributing despite the range appearing at higher prices. Instead, they are absorbing supply from profit-takers and early bears, adding to their existing long positions at these levels. The reaccumulation confirms that the uptrend is healthy and smart money expects higher prices. Any shakeout below support is an aggressive liquidity grab to accumulate even more before the next markup phase.
How to trade it: The key is identifying that this range is a continuation pause rather than a distribution. Look for the context of an existing uptrend. Enter long on the spring or shakeout below range support, or on the breakout above range resistance with a pullback entry. Stop loss goes below the shakeout low. Target the next higher-timeframe resistance level or use a measured move projection from the range height.
12. Bearish Redistribution
What it looks like: During an established downtrend, price consolidates into a range that may appear similar to an accumulation pattern. The range has defined boundaries and may include an upthrust above resistance. The context is bearish since the range forms after a markdown leg, and the eventual breakdown is to the downside. Rallies within the range tend to be weak and on declining volume.
What it signals: This is not accumulation despite the apparent base-building appearance. Institutions are using the range to redistribute their short positions, adding more shorts as retail traders attempt to bottom-pick and catch a reversal. Any upthrust above resistance is designed to sweep buy-side liquidity from retail longs and breakout traders, giving institutions better fills on their short additions.
How to trade it: Identify the bearish context from the existing downtrend. Enter short on the upthrust above range resistance when price fails and drops back below, or on the breakdown below range support with a pullback entry. Stop loss goes above the upthrust high. Target the next lower-timeframe support level or a measured move projection from the range height extended downward. Avoid buying dips in a redistribution as this is where retail capital gets trapped.
How Smart Money Manipulates Retail Traders
Understanding institutional manipulation is not about conspiracy theories. It is about recognizing the structural reality of how large orders are filled in financial markets. A hedge fund managing billions cannot simply place a market order for 500 million dollars worth of EUR/USD without moving the price against themselves. They need counterparty liquidity, and the most accessible source of that liquidity is retail traders' stop losses and breakout orders.
Stop Hunts Below Support
Price is driven below obvious support levels to trigger sell stops. Once these stops execute as market sell orders, institutions buy against them at discount prices. Price then reverses sharply, leaving retail traders stopped out at the worst possible moment.
False Breakouts Above Resistance
Price pushes above resistance to trigger buy stops and attract breakout buyers. Institutions sell into this buy-side liquidity, filling their short positions. Price then reverses, trapping breakout buyers who entered at the worst level. This is the bull trap pattern in action.
Equal Highs and Lows as Liquidity Targets
When price creates equal highs (double tops) or equal lows (double bottoms), retail traders place stops just beyond these levels. Smart money views these clean levels as liquidity pools that will eventually be targeted. The more times a level is tested without breaking, the more liquidity accumulates there.
News Event Volatility
High-impact news events create volatility spikes that sweep both buy and sell liquidity in rapid succession. Smart money uses these volatile moves to accumulate or distribute positions while retail traders are whipsawed by the chaos. This is why you see long wicks on both sides of candles during major news releases.
The takeaway: If you can identify where liquidity is resting and understand how institutions target it, you can position yourself alongside smart money rather than being the liquidity they consume. Every pattern in this guide is a variation of this core dynamic.
Frequently Asked Questions
What are Smart Money Concepts in trading?
Smart Money Concepts (SMC) is a trading methodology that focuses on tracking institutional order flow rather than retail indicators. It uses concepts like order blocks, liquidity grabs, market structure breaks, and displacement candles to identify where banks and hedge funds are positioning. SMC builds on the foundational work of ICT (Inner Circle Trader) and Wyckoff methodology to decode how smart money accumulates and distributes positions.
What is an order block in trading?
An order block is the last opposing candle before a strong impulsive move, representing the zone where institutional traders placed large orders. A bullish order block is the last bearish candle before a sharp rally, while a bearish order block is the last bullish candle before a sharp sell-off. Price often returns to these zones before continuing in the impulsive direction, giving traders high-probability entry points.
What is the difference between a break of structure and a change of character?
A Break of Structure (BOS) confirms continuation of the existing trend when price breaks past the most recent swing high in an uptrend or swing low in a downtrend. A Change of Character (ChoCH) signals a potential trend reversal when price breaks in the opposite direction of the current trend. ChoCH is the first sign that smart money may be shifting direction, while BOS confirms they are still committed to the current trend.
How does smart money manipulate retail traders?
Smart money manipulates retail traders through liquidity grabs and stop hunts. Institutions push price into areas where retail stop losses cluster, such as above obvious resistance or below obvious support, to fill their large orders at favorable prices. Patterns like the Wyckoff Spring and Upthrust are classic examples where price briefly breaks a key level to trigger stops before reversing sharply in the opposite direction.
What is the Power of Three pattern in ICT trading?
The Power of Three (PO3) is an ICT concept describing three phases that occur within a single trading session: Accumulation, Manipulation, and Distribution. During accumulation, price consolidates in a range. During manipulation, smart money drives price against the intended direction to grab liquidity and trap retail traders. During distribution, price moves sharply in the true intended direction. This pattern frequently appears at the daily and session open levels.
Where to Go From Here
The biggest mistake people make with SMC is trying to learn everything at once. Don't. Start with market structure breaks - just learn to identify when a trend changes character. Then add order blocks. Then Wyckoff. Build it layer by layer.
These two guides pair well with what you just learned:
- Fair value gap patterns - the imbalance zones institutions leave behind
- Trap and fakeout patterns - the retail side of liquidity grabs
Done reading? Upload a chart and see what ChartSnipe finds.
Analyze a chart