Double Top, Double Bottom & Head and Shoulders Guide
The definitive guide to trading the most recognized reversal chart patterns in stocks, forex, and crypto. Learn neckline breaks, measured move targets, and volume confirmation techniques used by professional traders.
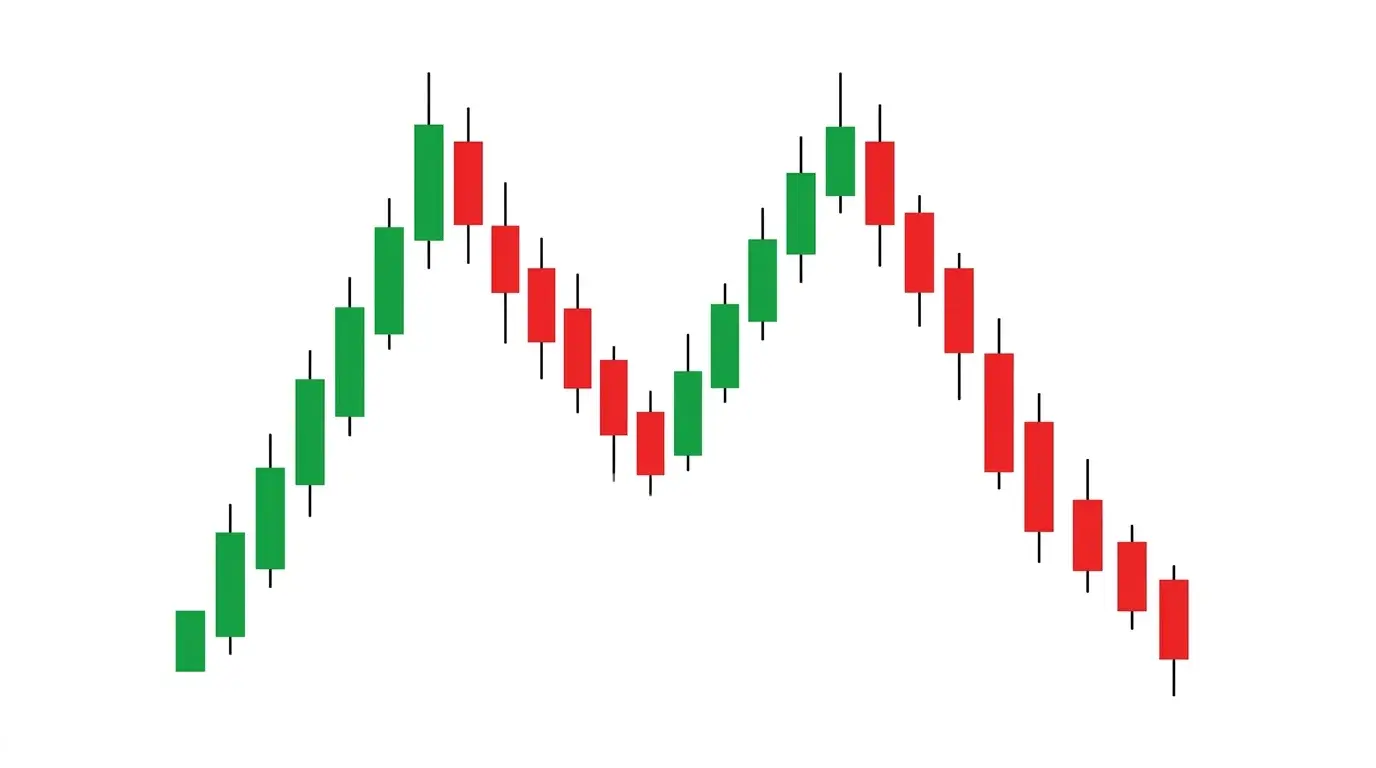
Classic reversal patterns are the foundation of technical analysis. Long before algorithms and AI dominated markets, traders identified repeating price structures that signaled trend exhaustion and impending reversals. Double tops, double bottoms, and head and shoulders patterns remain the most searched and most traded chart patterns today because they work across every market and every timeframe.
These patterns reflect the underlying psychology of market participants. A double top forms because buyers lose conviction at the same price level twice. A head and shoulders develops because each successive rally produces weaker buying pressure. Understanding why these formations occur gives you an edge that purely mechanical trading cannot match. In this guide, we will cover 11 classic reversal patterns with real chart examples, entry and exit strategies, and the volume analysis techniques that separate high-probability setups from traps.
Whether you trade stocks, forex, or cryptocurrency, these patterns appear consistently because they reflect universal market psychology. Combine these structures with the bullish reversal candlestick patterns and breakout chart patterns we have covered in previous guides, and you will have a complete framework for reading price action at every stage of a trend.
Double Top Patterns
The double top is arguably the most recognized bearish reversal pattern in all of technical analysis. It appears at the end of an uptrend when price reaches a resistance level, pulls back, rallies to the same level again, and then fails. This failure to break higher on the second attempt reveals that buying pressure is drying up and distribution is underway.
1. Double Top Pattern

What it looks like: The double top forms an "M" shape on the chart. Price rallies to a resistance level, pulls back to create a trough (the neckline), then rallies again to approximately the same high. The two peaks should be within 1-3% of each other in price. The neckline is drawn horizontally through the low point between the two peaks, and this level becomes the critical trigger for the pattern.
What it signals: The double top represents a battle between buyers and sellers at a significant resistance level. On the first peak, sellers overwhelm buyers and push price down. When price rallies back to the same level, buyers are unable to generate enough momentum to break through. This second failure is a clear sign that the smart money is distributing positions and that the uptrend is exhausted. Volume typically declines on the second peak compared to the first, confirming weakening demand.
How to trade it: Enter a short position when price closes below the neckline on increased volume. Your price target is the measured move: subtract the height of the pattern (distance from peaks to neckline) from the neckline breakout point. Place your stop loss above the second peak. For a more conservative entry, wait for price to break the neckline and then retest it as resistance from below before entering the short. The double top is one of the most reliable patterns in forex major pairs and large-cap stocks where institutional participation ensures clean price structures.
2. Double Top Breakdown

What it looks like: The double top breakdown is the confirmation phase of the double top pattern. After forming the characteristic "M" shape, price breaks decisively below the neckline support level. The breakdown candle is typically a strong bearish candle with above-average volume, often accompanied by a gap down in stocks or an impulsive move in forex. The former neckline support now becomes overhead resistance.
What it signals: The neckline break confirms that the distribution phase is complete and sellers are now firmly in control. Buyers who purchased near the neckline are now underwater and their stop losses being triggered adds fuel to the downside move. Institutional traders who were distributing near the highs have completed their selling, removing the buying support that previously held the neckline. This creates a cascading effect as retail stop losses and institutional sell orders compound the decline.
How to trade it: If you missed the initial neckline break, look for a retest of the neckline from below as a secondary entry opportunity. Price will often rally back to the broken neckline, fail to reclaim it, and resume the downside move. This retest entry offers a tighter stop loss (just above the neckline) and a clearer invalidation level. The measured move target remains the same: the pattern height projected downward from the neckline. In crypto markets, double top breakdowns can be particularly violent due to leveraged liquidations cascading below key support levels.
Double Bottom Patterns
The double bottom is the bullish mirror image of the double top. It forms at the end of a downtrend and signals that selling pressure is exhausted. These patterns are particularly powerful at major support zones and historical demand areas where institutional buyers step in to accumulate positions.
3. Double Bottom Pattern

What it looks like: The double bottom forms a "W" shape on the chart. Price falls to a support level, bounces to create a peak (the neckline), then drops back to approximately the same low. The two troughs should be within 1-3% of each other. The neckline is drawn horizontally through the high point between the two troughs, creating the resistance level that must be broken for confirmation. Ideally, the two lows form over a period of several weeks to months, though the pattern appears on all timeframes.
What it signals: The double bottom demonstrates that buyers are willing to defend a specific price level aggressively. On the first trough, strong buying interest absorbs the selling pressure and pushes price higher. When price returns to the same level, buyers step in again, preventing further decline. This repeated defense shows institutional accumulation, where large players are building positions at what they consider fair value. Volume on the second trough is often lighter than the first, indicating that selling pressure is fading, while the rally off the second trough should show increasing volume as new buyers commit.
How to trade it: Enter a long position when price closes above the neckline with conviction. The measured move target equals the pattern height (neckline to troughs) projected above the neckline breakout point. Place your stop loss below the second trough. An alternative approach is to enter long on the second bounce from support with a stop below both troughs, which gives you a larger position size and better entry price but requires more pattern recognition skill. Double bottoms at round numbers or prior major support levels carry higher conviction.
4. Double Bottom Breakout

What it looks like: The double bottom breakout occurs when price surges above the neckline resistance level that was established by the peak between the two troughs. The breakout candle is typically a strong bullish bar with above-average volume, sometimes accompanied by a gap up in equity markets. After the breakout, the former neckline resistance should now act as support on any pullback, providing a clear level for managing risk.
What it signals: The neckline breakout confirms that the accumulation phase is complete and the balance of power has shifted decisively from sellers to buyers. Short sellers who entered positions during the downtrend are now trapped above the neckline, and their covering adds buying pressure to the initial breakout move. The breakout also triggers momentum-based algorithmic systems and attracts new trend-following buyers, creating a positive feedback loop that drives price toward the measured move target. The transition from a downtrend to an uptrend is confirmed once the former resistance becomes proven support.
How to trade it: The strongest double bottom breakouts occur on high volume with little hesitation at the neckline. If you are already long from the second trough, the neckline break is your signal to add to the position. If entering fresh, buy on the close above the neckline and set your stop below the neckline or the most recent swing low. The measured move target provides a minimum expectation, but in strong trends, price often exceeds this target significantly. Consider scaling out at the measured move and trailing the remainder. This pattern is especially effective in growth stocks emerging from prolonged bases.
Head and Shoulders Patterns
The head and shoulders pattern is considered by many professional traders to be the single most reliable reversal pattern in technical analysis. Its three-peak structure reveals a gradual shift in market dynamics from bullish to bearish (or vice versa for the inverse version), providing ample time for traders to identify the setup and plan their entries.
5. Head and Shoulders Pattern

What it looks like: The head and shoulders consists of three peaks: the left shoulder (first peak), the head (highest peak), and the right shoulder (third peak, roughly equal to the left shoulder). The neckline is drawn connecting the two troughs between these peaks. In textbook examples, the neckline is horizontal, but sloping necklines are common and still valid. The right shoulder typically forms at a lower volume than the head, and the entire pattern can take weeks to months to develop, depending on the timeframe.
What it signals: The head and shoulders tells a story of deteriorating momentum. The left shoulder represents the uptrend still in force with strong buying. The head makes a higher high, but the rally to the head may show volume divergence, hinting at weakening demand. The right shoulder is the critical piece: price fails to reach the head's level, demonstrating that buyers cannot sustain the uptrend. Each pullback to the neckline shows sellers becoming more aggressive, and the final break below the neckline confirms that the trend has reversed. This pattern is the hallmark of major market tops across equities, forex, and crypto.
How to trade it: Enter short on a close below the neckline with volume confirmation. The measured move target equals the vertical distance from the head to the neckline, projected downward from the neckline break point. Place your stop loss above the right shoulder. Some traders enter early on the right shoulder formation when they recognize the pattern developing, using a tighter stop above the head. This aggressive entry improves the risk-to-reward ratio but requires more pattern recognition experience. Head and shoulders patterns on the daily and weekly timeframes carry the most significance and tend to produce the most reliable measured move completions.
6. Inverse Head and Shoulders Pattern

What it looks like: The inverse head and shoulders is the bullish counterpart to the standard head and shoulders. It forms three troughs: the left shoulder, the head (deepest trough), and the right shoulder (roughly equal depth to the left shoulder). The neckline connects the two peaks between these troughs and serves as the resistance level that must be broken for confirmation. The symmetry between the shoulders is ideal but not required, as real-world patterns rarely achieve textbook perfection.
What it signals: The inverse head and shoulders represents a bottom-building process where sellers progressively lose control. The left shoulder shows the initial capitulation selling. The head makes a lower low, shaking out weak hands and triggering panic selling. Crucially, the right shoulder fails to reach the head's depth, showing that sellers can no longer push price to new lows. Buying interest is growing at higher levels, and the volume pattern should confirm this: lighter volume on the right shoulder compared to the head, and expanding volume on the neckline breakout. This pattern frequently appears at the base of multi-month downtrends in equities and after extended bear markets in crypto.
How to trade it: Go long when price closes above the neckline on increased volume. The measured move target is the distance from the head to the neckline, projected upward from the breakout point. Set your stop loss below the right shoulder. For a higher-probability entry, wait for a pullback to the broken neckline (now support) before entering. Inverse head and shoulders patterns at major support zones or after prolonged declines tend to produce the most explosive breakouts because the short squeeze component adds significant upward force. In forex, these patterns are particularly clean on the 4-hour and daily charts for major pairs.
Neckline Retests: The Second-Chance Entry
Not every trader catches the initial neckline break. The neckline retest is a well-documented phenomenon where price returns to the broken neckline before continuing in the breakout direction. Understanding this behavior is essential for both managing existing positions and finding second-chance entries.
7. Head and Shoulders Neckline Retest

What it looks like: After the head and shoulders pattern completes and price breaks below the neckline, a retest occurs when price rallies back up to the broken neckline level. The rally stalls at the neckline, sellers step in, and price resumes its decline. The retest creates a lower high below the neckline, confirming that the former support has been converted to resistance. The retest typically occurs within a few days to a couple of weeks after the initial breakdown.
What it signals: The neckline retest is a polarity principle in action: support, once broken, becomes resistance. Traders who missed the initial short entry get a second opportunity. The retest also traps bottom-pickers who interpret the bounce as a reversal, and their stops above the neckline are never triggered. When the retest fails and price rolls over, these trapped longs add selling pressure, compounding the move lower. A successful retest (one that holds as resistance) confirms the validity of the head and shoulders breakdown and increases confidence in the measured move target being reached.
How to trade it: The retest entry is favored by patient, risk-conscious traders because it offers a clearly defined stop loss just above the neckline, resulting in a superior risk-to-reward ratio compared to chasing the initial breakdown. Enter short when the retest candle shows rejection at the neckline, such as a bearish engulfing, shooting star, or evening star candlestick. Your stop goes above the neckline (and ideally above the right shoulder for extra safety). The target remains the measured move projected from the neckline.
8. Inverse Head and Shoulders Neckline Retest

What it looks like: After the inverse head and shoulders pattern completes with a breakout above the neckline, price pulls back to retest the neckline from above. The pullback finds support at the neckline level, buyers step in, and price resumes its upward trajectory. This creates a higher low above the neckline, confirming the bullish reversal structure and validating that resistance has been converted to support.
What it signals: The bullish neckline retest confirms that demand is real and that the breakout was not a false move. Institutional buyers who accumulated during the pattern formation now defend the neckline, treating any dip to that level as a buying opportunity. Sellers who shorted the retest get trapped when the bounce resumes, and their covering adds upside momentum. The retest also validates the pattern for swing traders who require confirmation before committing capital, and it provides a precise support reference for position sizing and stop placement.
How to trade it: Go long when price shows bullish rejection at the neckline during the retest. Look for bullish candlestick confirmation such as a hammer, bullish engulfing, or morning star forming at the neckline level. Place your stop loss below the neckline, and target the full measured move from the original pattern. This entry strategy is particularly effective in trending markets where the inverse head and shoulders serves as a continuation-reversal hybrid. In forex, GBP/USD and EUR/USD frequently produce textbook inverse head and shoulders neckline retests on the 4-hour timeframe.
Triple Top and Triple Bottom Patterns
Triple top and triple bottom patterns are rarer than their double counterparts but carry even greater significance when they appear. The third test of a support or resistance level adds conviction because it demonstrates that the level has withstood repeated attempts. When the level finally breaks, the resulting move is often powerful and decisive.
9. Triple Top Pattern

What it looks like: The triple top forms three peaks at approximately the same resistance level, separated by two troughs. The neckline is drawn through the lowest point of the troughs (or an average line connecting them). The three peaks should be roughly equal in height, though slight variations are normal. The pattern typically develops over an extended period, making it more visible on daily and weekly charts. Each peak may test resistance slightly differently, with the third peak often showing the least conviction.
What it signals: The triple top demonstrates extreme exhaustion of buying pressure at a resistance level. If a double top shows sellers winning twice, a triple top shows sellers winning three times at the same price. Each failed breakout attempt depletes the pool of willing buyers at that level. By the third peak, most bullish traders have either given up or been stopped out, and the smart money has completed distribution. Volume analysis is particularly telling: volume should progressively decline from the first peak to the third, showing that buying interest is systematically draining away. This pattern is sometimes confused with a rectangle or range, but the progressively declining volume distinguishes it.
How to trade it: Enter short when price breaks below the neckline support level on increased volume. The measured move target is calculated the same way as a double top: measure the height from the peaks to the neckline and project that distance downward from the break point. Set your stop loss above the third peak. Because triple tops take longer to form and represent stronger resistance, the resulting breakdowns tend to be more violent and reach their measured targets more reliably than double top breakdowns. These patterns appear frequently in commodity markets and indices approaching all-time highs.
10. Triple Bottom Pattern

What it looks like: The triple bottom forms three troughs at approximately the same support level, separated by two intermediate peaks. The neckline connects the two peak points between the troughs. Like the triple top, the three lows should be roughly equal, and the pattern benefits from appearing on higher timeframes where the levels carry more institutional significance. The pattern has a wide, flat appearance that distinguishes it from the narrower inverse head and shoulders.
What it signals: Three bounces from the same support level demonstrate exceptional demand at that price. Institutional buyers are systematically accumulating at this level, absorbing every wave of selling without allowing price to break lower. Selling volume should decrease on each successive trough, while the rallies between troughs may show increasing volume, confirming that buying conviction is growing. The triple bottom often appears after extended bear markets or significant corrections, marking the transition point where long-term investors consider valuations attractive enough to build positions.
How to trade it: Go long when price breaks above the neckline resistance on strong volume. The measured move target is the pattern height projected upward from the neckline. Stop loss goes below the third trough. For aggressive traders, the third bounce from support offers an early entry with a stop below all three troughs. Triple bottom breakouts in Bitcoin and Ethereum have historically led to major trend reversals, as the extended base-building period allows significant accumulation before the markup phase begins.
Cup and Handle Pattern
The cup and handle is a unique bullish continuation-reversal pattern first popularized by William O'Neil in his CANSLIM methodology. Unlike the other patterns in this guide that are strictly reversal formations, the cup and handle often appears as a continuation pattern within a larger uptrend. It combines the base-building characteristics of a rounded bottom with a final consolidation (the handle) before a breakout.
11. Cup and Handle Pattern

What it looks like: The cup forms as a rounded, U-shaped bottom where price gradually declines, bases, and then recovers back to the prior high. The handle is a short consolidation or slight pullback that forms near the right rim of the cup, typically drifting downward or sideways in a tight range. The handle should not retrace more than one-third to one-half of the cup's depth. The entire pattern resembles a teacup when viewed from the side. The cup portion usually forms over 7 to 65 weeks in stocks, though it can appear on shorter timeframes in forex and crypto.
What it signals: The cup and handle tells a powerful story of accumulation and conviction. The cup's decline shakes out weak holders, while the gradual recovery attracts new institutional buyers who recognize value. By the time price reaches the prior high (the cup's rim), most sellers from the original decline have been absorbed. The handle represents a final shakeout where impatient longs exit and short sellers attempt to fade the resistance level. Volume should dry up during the handle, creating ideal conditions for a low-risk breakout. When the handle resolves upward, the combination of short covering, breakout buying, and resumed institutional demand creates a powerful rally.
How to trade it: Enter long when price breaks above the handle's resistance level (or the cup's rim if the handle is minimal) on volume that is at least 40-50% above average. The measured move target is the depth of the cup projected upward from the breakout point. Place your stop loss below the handle's low. The ideal cup and handle forms after a prior uptrend of at least 30%, has a cup depth of 12-33%, and a handle that lasts 1-4 weeks. This pattern has produced some of the most explosive moves in stock market history, including major breakouts in tech growth stocks and leading crypto assets.
Measuring Price Targets with Classic Patterns
Every pattern in this guide uses the measured move technique to project price targets, and understanding this concept is fundamental to trading classic chart patterns effectively. The measured move is based on the principle that the energy stored during a pattern's formation is released upon the breakout, and the magnitude of the resulting move tends to equal the size of the pattern itself.
Measure the Pattern Height
Calculate the vertical distance from the neckline to the highest peak (bearish patterns) or the lowest trough (bullish patterns). This is the pattern height "H".
Identify the Breakout Point
Mark the exact point where price breaks through the neckline. This is the origin from which you project the target.
Project the Target
For bearish patterns, subtract "H" from the neckline breakout point to get the downside target. For bullish patterns, add "H" to the breakout point to get the upside target.
The measured move is a minimum target. In strong trends, price frequently exceeds the measured move by 50-100% or more. This is why many experienced traders use the measured move as a level to take partial profits while trailing the remaining position with a moving average or structure-based stop.
Pro tip: The measured move is most reliable when volume confirms the breakout. Patterns that break out on volume 50% or more above the 20-day average reach their measured move target approximately 70-80% of the time, compared to only 50-55% for low-volume breakouts.
Volume Divergence: The Key Confirmation Signal
Volume analysis is what separates high-probability classic pattern setups from patterns that fail. Here is what to look for across all the patterns covered in this guide:
- Double Top / Triple Top: Volume should decrease on each successive peak. If the second or third peak shows higher volume than the first and still fails to break resistance, it is an even more powerful bearish signal.
- Double Bottom / Triple Bottom: Volume should decrease on each successive trough (less panic selling), and the rally off the final low should show expanding volume (fresh buying interest).
- Head and Shoulders: Volume typically follows the pattern: high on the left shoulder rally, highest on the head rally (but with divergence at the peak), and noticeably lower on the right shoulder rally. The neckline break should be accompanied by a volume spike.
- Cup and Handle: Volume should be highest during the left side of the cup's decline, dry up at the cup's bottom, gradually increase during the right side recovery, dry up again in the handle, and surge on the breakout.
When volume does not conform to these expected patterns, exercise extra caution. A head and shoulders with increasing volume on the right shoulder, for example, may indicate that buyers still have conviction and the pattern may not complete.
Combining Classic Patterns with Candlestick Analysis
Classic reversal chart patterns provide the structural framework, while bullish reversal candlestick patterns and bearish reversal candlestick patterns provide the timing signal. For example, seeing a bearish engulfing candle at the right shoulder of a head and shoulders pattern dramatically increases the probability that the pattern will complete. Similarly, a hammer or morning star at the second trough of a double bottom adds confidence to a long entry before the neckline break.
Once a reversal pattern completes and a new trend begins, look for breakout continuation patterns like flags, pennants, and wedges to add to your position during pullbacks within the emerging trend. This layered approach, using reversal patterns for entries and continuation patterns for adds, is how professional traders build their most profitable positions.
Frequently Asked Questions
What is the difference between a double top and a head and shoulders pattern?
A double top forms two peaks at roughly the same price level, while a head and shoulders forms three peaks where the middle peak (head) is higher than the two outer peaks (shoulders). Head and shoulders patterns are generally considered more reliable because the three-peak structure shows a more definitive shift in momentum from buyers to sellers. The right shoulder's failure to reach the head's level is a clear sign of weakening demand that the double top's equal peaks do not provide.
How do you calculate the price target for a double top or double bottom?
Measure the vertical distance from the neckline to the highest peak (double top) or lowest trough (double bottom). Then project that same distance from the neckline breakout point in the direction of the break. For a double top, subtract the distance below the neckline. For a double bottom, add the distance above the neckline. This measured move technique works for all classic reversal patterns and provides a reliable minimum price target.
What is the most reliable reversal chart pattern?
The head and shoulders pattern is widely regarded as one of the most reliable reversal patterns in technical analysis. Studies show it has a completion rate of approximately 70-75% when volume confirms the pattern. The inverse head and shoulders at market bottoms tends to be slightly more reliable than the standard bearish version because panic selling at bottoms creates sharper, more defined structures that institutional buyers defend aggressively.
Should I wait for a neckline retest before entering a trade?
Waiting for a neckline retest provides a better risk-to-reward ratio and confirms that former support has become resistance (or vice versa). However, not all patterns produce a retest, so you may miss some trades. A balanced approach is to enter a partial position on the neckline break and add on the retest, using the retest level as your stop loss reference. This way you participate in the initial move while improving your average entry if the retest occurs.
How does volume confirm a double top or head and shoulders pattern?
In a valid double top, volume should be lower on the second peak compared to the first, showing declining buying pressure. For head and shoulders, volume typically decreases from the left shoulder to the head to the right shoulder. The neckline break should occur on expanding volume. If volume does not confirm the pattern, it is less reliable and more prone to failure. Always cross-reference volume with the price structure before committing capital.
The Only Rule That Matters
Neckline breaks on volume. That's it. Everything else is just noise until that happens. A double top isn't a double top until the neckline gives way, and a head and shoulders is just a squiggly line until sellers actually push through. Be patient, measure your target, and manage your risk.
Spot these patterns faster
ChartSnipe analyzes your charts in seconds