
Record Highs, Hawkish Fed: Does the Rally Hold?
US indices are printing record highs on revived AI optimism while the Fed leans hawkish and the dollar sits above 100. A liquidity-and-narrative rally running straight into restrictive policy is an unusual, uncomfortable combination. Here is what is powering it, the concentration risk underneath, and how to trade it.

A year that opened with a growth scare and a gold blow-off has, by early July, handed US equities their strongest quarter since 2020. The S&P 500 is trading at or near record highs around 7,500. The Nasdaq Composite is up near 26,000. The Dow sits above 53,000. If you had been told nothing else about the macro backdrop, you would assume the Fed was cutting, the dollar was soft, and the coast was clear.
None of that is true. The Fed is holding at 3.50–3.75% and openly leaning toward hikes, markets price roughly 76% odds of zero cuts for all of 2026, and the dollar index is back above 100 for the first time in over a year. That is the discomfort at the centre of this market: a rally powered by a narrative and by flows, running straight into the most restrictive policy stance in a decade. Both things are true at once, and that is exactly what makes it hard to trade.
This piece lays out where the indices actually are, what is doing the lifting, where the tension and the concentration risk live, what history says about record highs into tight policy, and — the part that pays — how to trade US500 and USTEC without either fighting the tape or blindly chasing it. The tool referenced throughout is ChartSnipe, used as a research co-pilot for the macro read and the chart, not a signal service.
Key Takeaways
- →Indices are at genuine record highs — S&P near 7,500, Nasdaq near 26,000, Dow above 53,000 — on the strongest quarter since 2020.
- →The engine is AI optimism, not easy money. The Fed is holding and leaning hawkish, with ~76% odds of no cuts in 2026 and the dollar above 100.
- →Breadth is narrow. A few mega-cap AI names are carrying the index, so the tape is more fragile than the headline number looks.
- →History says record highs into tight policy can run — markets do not need cuts to rise — but the risk of a sharp drawdown is elevated, not lowered.
- →Trade with the trend, but demand a level and a stop. Buy pullbacks that hold, not chases at fresh highs; size down into the July 28–29 FOMC.
1. Where the indices actually are
Start with the tape, because the tape is not ambiguous. The S&P 500 is pressing record highs near 7,500. The Nasdaq Composite, the tech-heavy read, is around 26,000 and leading. The Dow, the least tech-weighted of the three, is above 53,000 and lagging the other two — a spread that itself tells you where the leadership sits. Put together, US equities have just closed their best quarter since the post-COVID snapback of 2020.
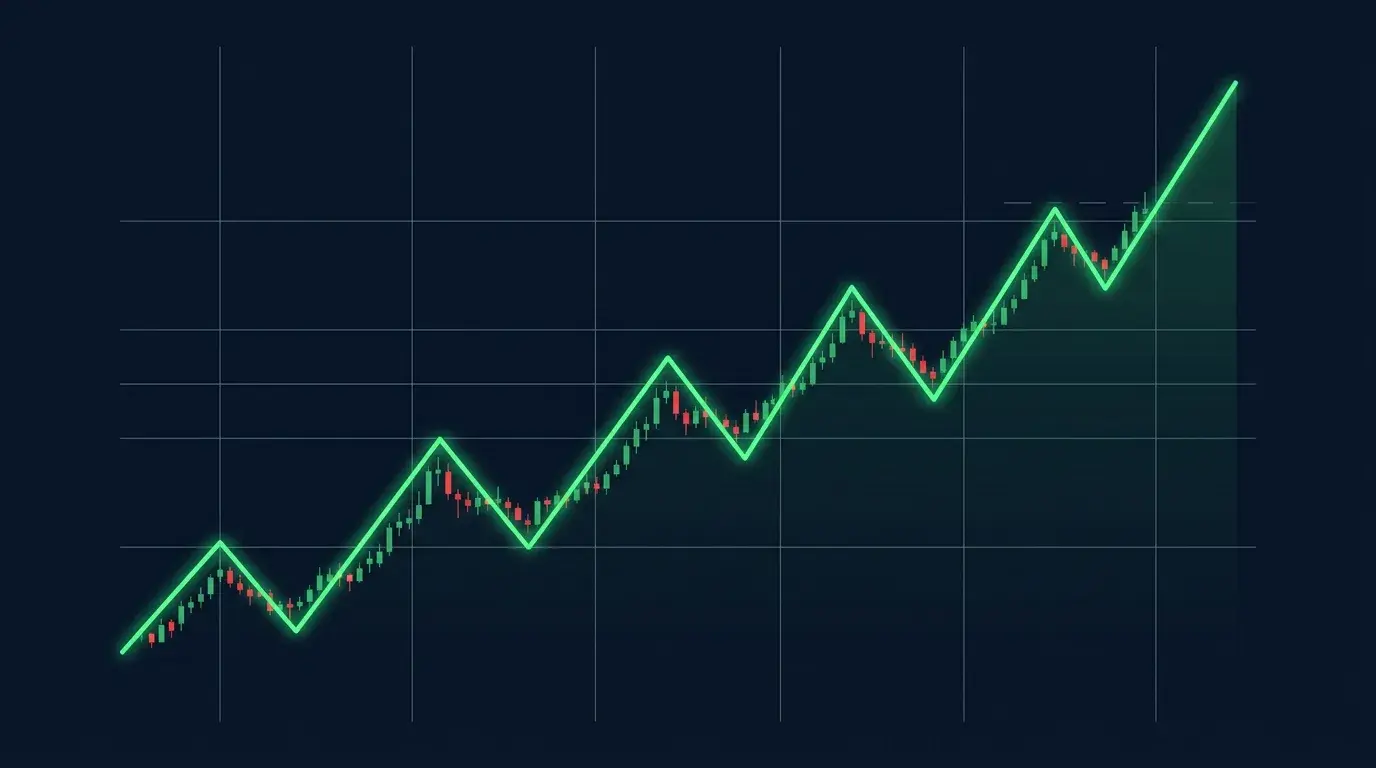
What matters technically is the character of the advance, not just the level. This has been a series of higher highs and higher lows, with shallow pullbacks that keep getting bought — the signature of a market with demand underneath it. That structure is why sceptics who called a top in the spring got run over. A trend that keeps making higher lows is not a trend you fade on valuation alone. It is a trend you respect, size into carefully, and watch for the first lower high.
On ChartSnipe these trade as index CFDs: US500 for the S&P 500 and USTEC for the Nasdaq 100. The Nasdaq is the higher-beta expression of the same theme — it goes up more on good AI days and down more on bad ones. If you want the cleanest exposure to the narrative, USTEC is it; if you want the same direction with less whip, US500 is the calmer vehicle.
2. The AI-optimism engine driving it
The fuel is a second wind for the AI trade. After a wobble earlier in the year when the market questioned whether capex was outrunning revenue, a run of strong results and raised guidance from the biggest names reset the story: the spending is being backed by real demand, margins are holding, and the productivity case is being taken seriously again. That is the difference between this leg and a pure momentum bubble — there are earnings underneath it, at least at the top of the index.
The mechanism matters for how you trade it. This is a narrative-and-earnings rally, which means it responds to two things above all: guidance from the mega-caps and any headline that changes the perceived trajectory of AI spending. It is far less sensitive to the incremental macro print than a rate-cut-driven rally would be. A soft retail sales number that would have mattered in a policy-easing tape barely registers here, because that is not what the market is trading. Know what the market is actually pricing before you decide a data point is a catalyst.
The uncomfortable flip side: a rally that lives on a narrative can lose altitude fast when the narrative is questioned, even without a change in rates. That is not a reason to be short — fighting a trend because it looks stretched is how sceptics lose money — but it is a reason to keep stops honest and not to confuse a strong trend with a safe one.
3. The hawkish-Fed, strong-dollar tension
Here is the part that should keep you honest. The Fed held at 3.50–3.75% in June and, with inflation having pushed back up toward the mid-3s on an oil shock, the committee is leaning toward hikes rather than cuts. Markets now price roughly 76% odds of no cuts at all in 2026. The dollar index has climbed back above 100, the strongest it has been since mid-2025. None of that is a friendly backdrop for risk assets. Textbook says record highs and a hawkish central bank with a strong dollar do not belong in the same sentence.
Yet here they are together, and the resolution is not magic. The AI earnings flow has simply been strong enough to overpower the policy drag — for now. A strong dollar is a genuine headwind: roughly 40% of S&P 500 revenue is earned overseas, and a dollar above 100 shrinks the value of those foreign sales when translated home while tightening global financial conditions. The reason it has not bitten is that the index leadership sits in companies whose growth story is currently loud enough to drown it out. That is a balance, not a guarantee.
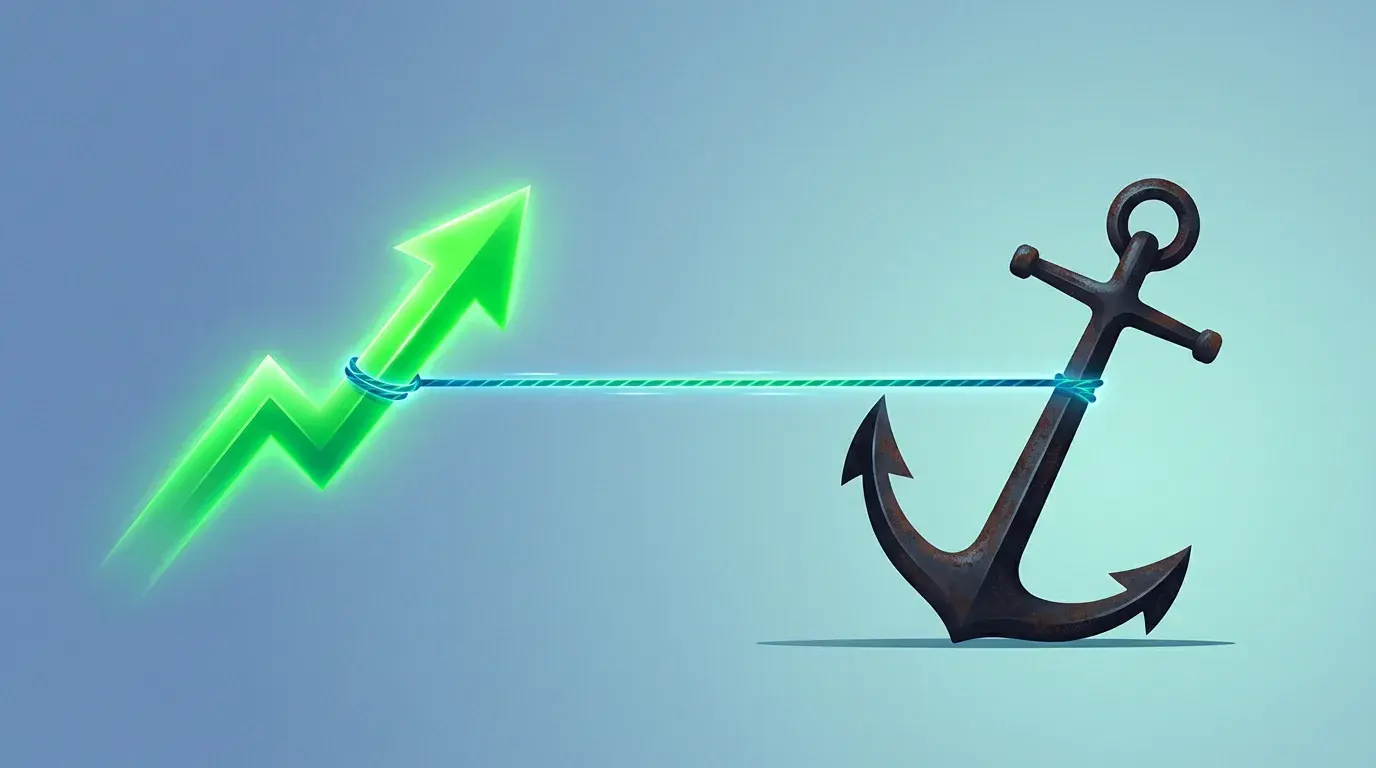
Think of it as a tug-of-war. On one rope, the liquidity-and-narrative pull dragging indices higher. On the other, the restrictive-policy-and-strong-dollar anchor. Right now the narrative side is winning. The trade is not to predict when the rope snaps — nobody rings a bell — but to stay on the winning side with a stop, and to respect that the anchor is heavy and real. If you want the full case for why the dollar is this strong, our DXY breakdown covers it.
4. Breadth and concentration risk
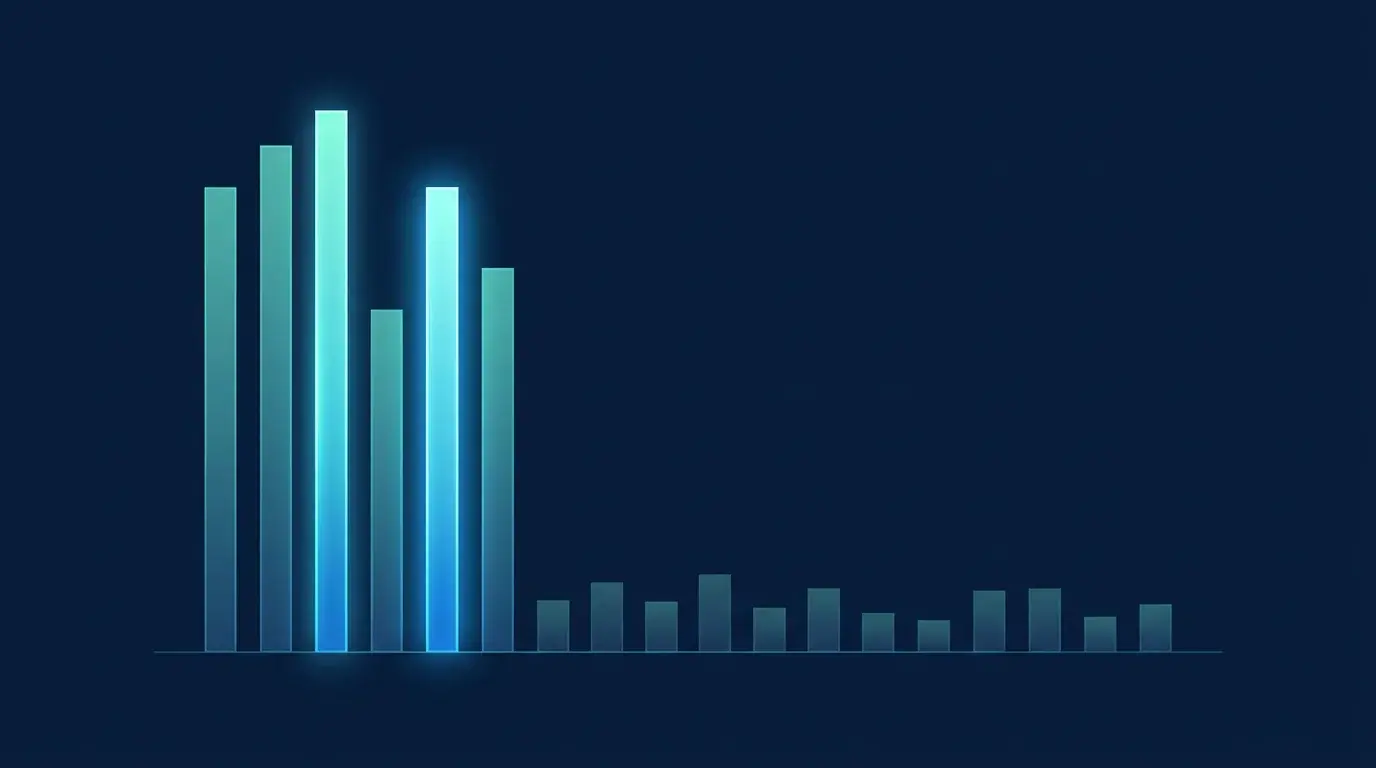
This is the risk that actually matters, and it hides behind the headline number. The index is at a record, but a small cluster of mega-cap AI names is doing a wildly disproportionate share of the lifting. When you own the S&P 500 at these weights you are, functionally, making a concentrated bet on a handful of companies dressed up as a diversified index. Narrow breadth is not itself a sell signal — markets can trend on thin leadership for a long time — but it changes the shape of the downside.
The practical consequence: because so much index weight sits in so few names, a disappointment from one or two of them — a guidance cut, a capex re-rating, a regulatory headline — can drag the whole index down faster and further than the health of the broad market would justify. The average stock can be fine while the index falls, because the index is not the average stock. That asymmetry is why a narrow rally is a more fragile rally, even when it is a strong one.
For a trader this argues for two habits. First, watch the leaders, not just the index — when the generals stop making new highs while the index still does, that divergence is worth more than any oscillator. Second, keep position sizes calibrated to a market that can gap on a single earnings line, not to the smooth grind the chart has shown lately. The tape has been kind; the structure underneath it is not built for a soft landing on bad news.
5. What history says about highs into tight policy
The instinct that record highs plus a hawkish Fed must end badly is half right. Markets do not need rate cuts to make new highs — the late-1990s and several stretches since saw indices grind higher through tightening or on-hold policy, because equities trade on earnings and financial conditions, and conditions can stay loose even when the policy rate does not fall. A record high is not, by itself, a top signal. Most record highs are followed by more record highs. That is what an uptrend is.
The honest version of the history, though, is that highs reached on narrow leadership into restrictive policy tend to come with fatter tails. The upside can extend further and longer than sceptics expect, and the eventual drawdown, when it comes, tends to be sharper because positioning is crowded and leadership is thin. Both halves are true. The rally can persist; the correction, when it arrives, is likely to be quick rather than gentle. Trading that means participating in the trend while keeping the exit pre-planned, not choosing between all-in and all-out.
The single most useful thing a discretionary trader can do here is separate the timing question from the direction question. Direction is up until structure says otherwise. Timing the crack is a mug's game — so do not try. Define what would tell you the trend has changed (a decisive lower high and lower low on the timeframe you trade), and let price, not your valuation opinion, deliver the message. Our guide to the signs a market is about to reverse is a good checklist for that.
6. How to trade indices in this regime
The regime dictates the playbook: strong uptrend, narrow breadth, hawkish overhang. That combination rewards with-trend entries with defined risk and punishes both stubborn shorts and reckless chases. Here is the concrete version.
Buy pullbacks that hold, not highs
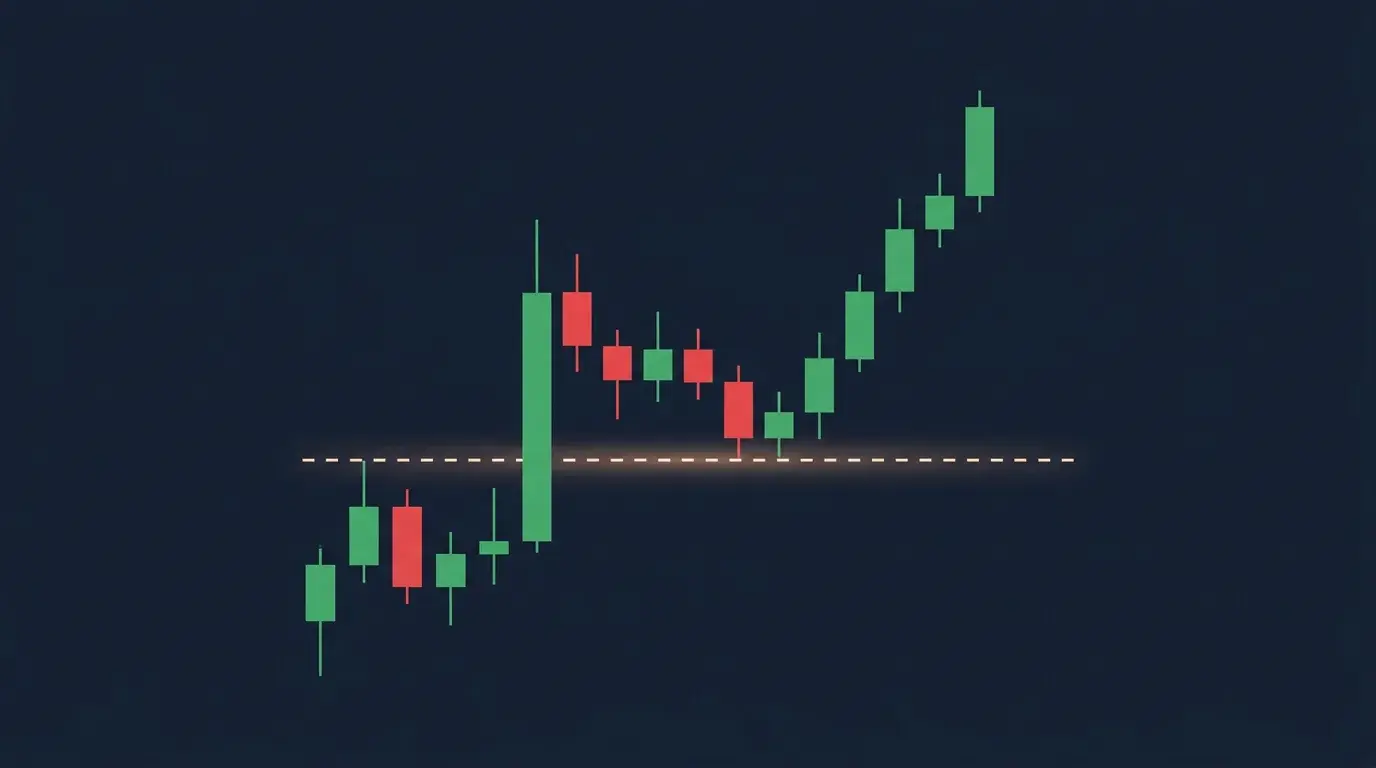
The lowest-quality entry in a trend is the green-candle chase at a fresh high, because your stop has nowhere logical to sit. The higher-quality entry is a pullback into a prior breakout level or a fast moving average that then holds — resistance turned support, buyers stepping back in. You get a defined invalidation (below the level) and a trend tailwind. The diagram below shows the shape: break to a new high, pull back to the level, hold, continue.
Size to the stop, and size down into events
Put the stop where the trend structure breaks — below the higher low you are buying — then size the position so that distance equals your fixed risk. In a concentrated market that can gap on one earnings line, that discipline is not optional. And going into the July 28–29 FOMC, or a major mega-cap earnings print, cut size or stand aside. You are not paid to hold full risk through a scheduled coin-flip.
Read the day's driver before the chart
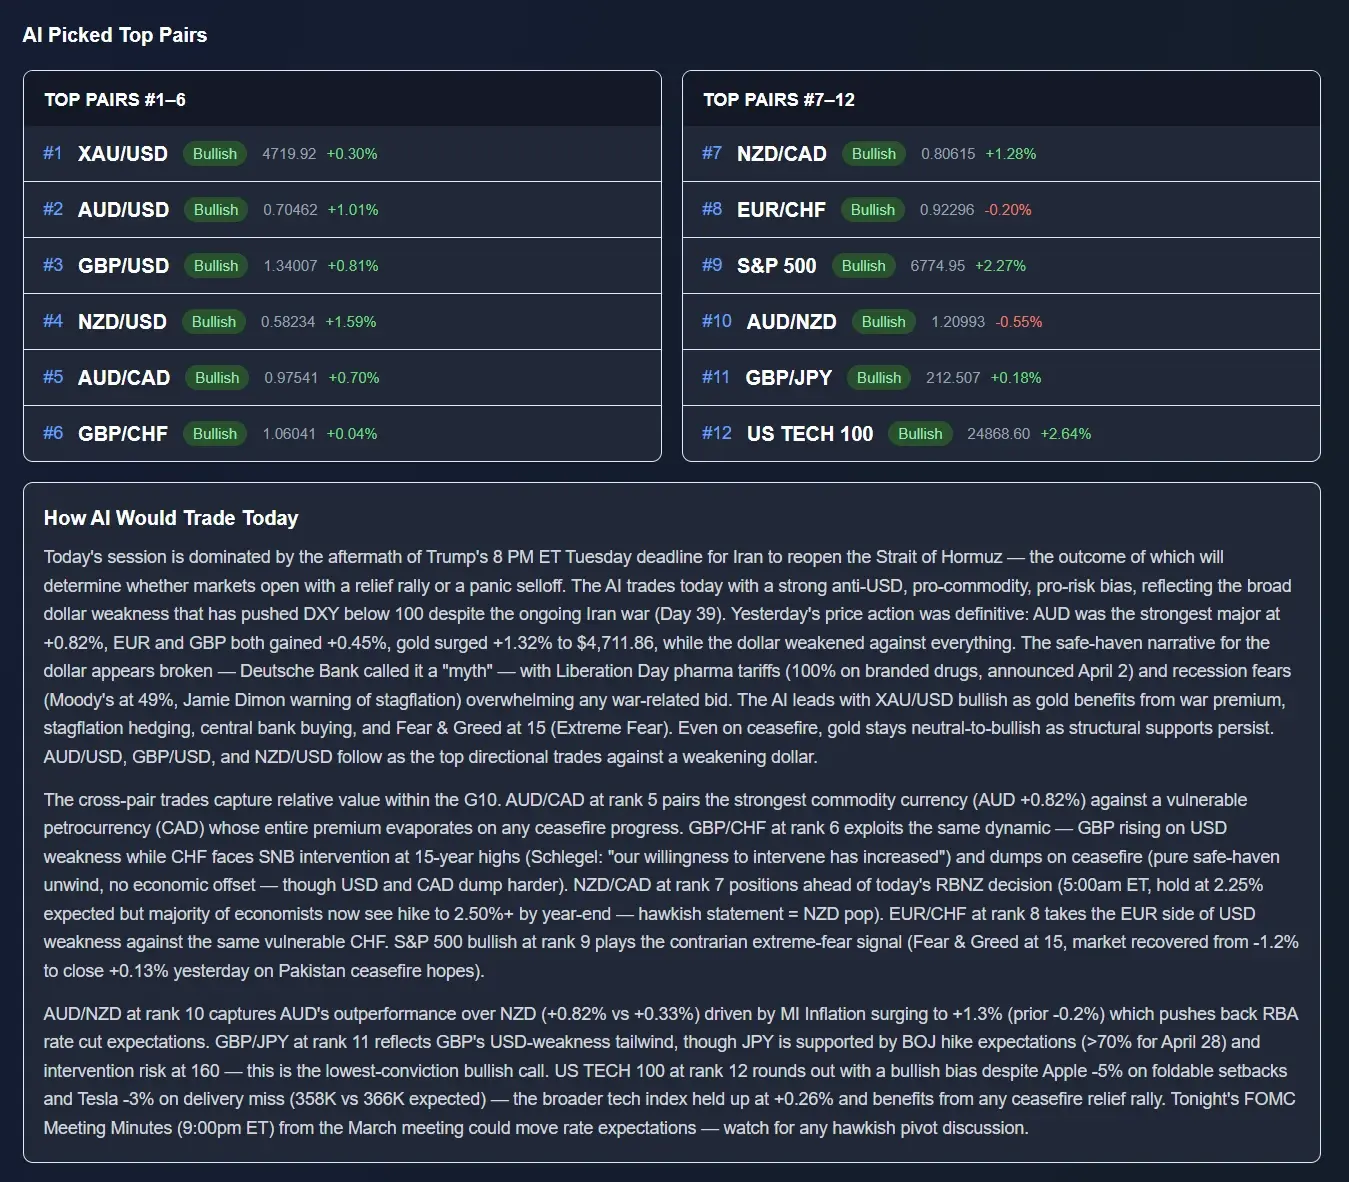
Indices are macro instruments. Before you take a US500 or USTEC trade, know what is actually moving the tape that session — is it a risk-on AI headline, a hawkish Fed speaker, a dollar surge? The Daily AI News Impact ranks instruments each morning with a conviction score and the drivers behind the call, so you know whether your chart idea is trading with the day's flow or against it. The high-impact events guide covers which releases move risk hardest.
Do
- Trade with the trend — buy pullbacks that hold a level.
- Put the stop below the higher low, then size to it.
- Watch the mega-cap leaders for the first divergence.
- Cut size into the FOMC and major earnings.
Don't
- Short a strong uptrend because it “looks expensive.”
- Chase green candles at fresh highs with no stop level.
- Assume narrow breadth means an easy, gentle top.
- Hold full size through a hawkish Fed surprise.
7. The catalysts that could crack it
A trend this strong rarely breaks on nothing. It breaks on a catalyst that forces repositioning. Four are worth watching, in rough order of how quickly they could bite.
A hawkish Fed surprise. The July 28–29 meeting is the near-term flashpoint. The market prices no cuts; it does not fully price a hike. An actual hike, or a materially more hawkish dot path, would hit the longer-duration mega-caps hardest — which, given concentration, means the index. This is the cleanest scheduled risk on the calendar.
An AI-narrative wobble. A single high-profile guidance cut or a credible question over capex returns could puncture the story that is doing the lifting. The rally lives on the narrative, so the narrative is where it is most exposed.
A dollar and yield spike. A sharply stronger dollar alongside higher real yields tightens conditions and directly pressures the foreign-earnings and valuation case at once. Watch DXY and the long end together, not in isolation.
An exogenous shock. The same oil and geopolitical risk that pushed inflation back up is a live tail. A fresh escalation that spikes crude would feed straight back into the hawkish-Fed story and hit risk on two fronts. This is the same macro plumbing that drives crypto around Fed meetings — the Bitcoin FOMC playbook walks through how these events transmit across risk assets.
None of these is a prediction that the rally ends next week. The point is to know the trip-wires so that when one trips you react to the tape, not to surprise. A trader who has already decided what would change their mind does not freeze when it happens.
Frequently asked questions
Is the S&P 500 at a record high in 2026?
Yes. As of early July 2026 the S&P 500 is trading at or near record highs around 7,500, the Nasdaq Composite is near 26,000, and the Dow is above 53,000. US equities just posted their strongest quarter since 2020 on a fresh wave of AI optimism.
Why are stocks rising if the Fed is hawkish?
The rally is driven by the AI earnings-and-capex narrative and by flows, not by easier policy. That flow has been strong enough to override the drag from a Fed holding at 3.50–3.75% and leaning toward hikes. It is a narrative-driven rally running into restrictive policy — which is why it works and feels uncomfortable at the same time.
What is the biggest risk to the 2026 stock rally?
Concentration. A handful of mega-cap AI names carry an outsized share of the gains, so breadth is narrow. A disappointment from one or two of them, or a re-rating of AI capex expectations, can pull the index down faster than the broad market would suggest. A hawkish Fed surprise at the July 28–29 meeting is the other clear catalyst.
Can indices keep rising with rate cuts off the table?
They can, and often do for a while. Markets do not need cuts to rise — they need the earnings story to hold and conditions to stay loose enough. With ~76% odds priced for zero cuts in 2026, the rally is not leaning on easing at all. The real risk is an actual hike or a growth scare that undercuts the earnings justifying current multiples.
How do I trade US500 and USTEC without chasing?
Trade with the trend but demand a level. Buy pullbacks to prior breakout levels or a fast moving average that hold, not chases at fresh highs. Define risk below the structure that would break the trend, size to that stop, take partials into strength, and stand aside or size down into the FOMC and major earnings.
Does a strong dollar hurt US stocks?
A dollar above 100 is a headwind for the roughly 40% of S&P 500 revenue earned abroad and it tightens global conditions. The AI earnings story has absorbed it so far, but a sharply stronger dollar alongside a hawkish Fed is exactly the combination that has capped previous rallies. It is a slow drag, not an on-off switch.
Sources & further reading
Get the read before you trade the record high
Live US500 and USTEC pricing, a daily AI news-impact score that tells you what the tape is actually trading, screenshot chart analysis, and a position-size calculator for a market that can gap. Two free snipes to test it on your own chart.