
Using ChatGPT for Forex Fundamentals
It reads a central bank statement better than most traders do, and it has no idea what the market already did with it. Here are the four things that break it on fundamentals, the prompt shape that fixes all four, and five prompts written out in full.
Almost everything written about ChatGPT and trading is about charts. Upload a screenshot, ask for support and resistance, watch it invent a level that is not on the image. That conversation is well covered, including on this blog, and the verdict is not flattering.
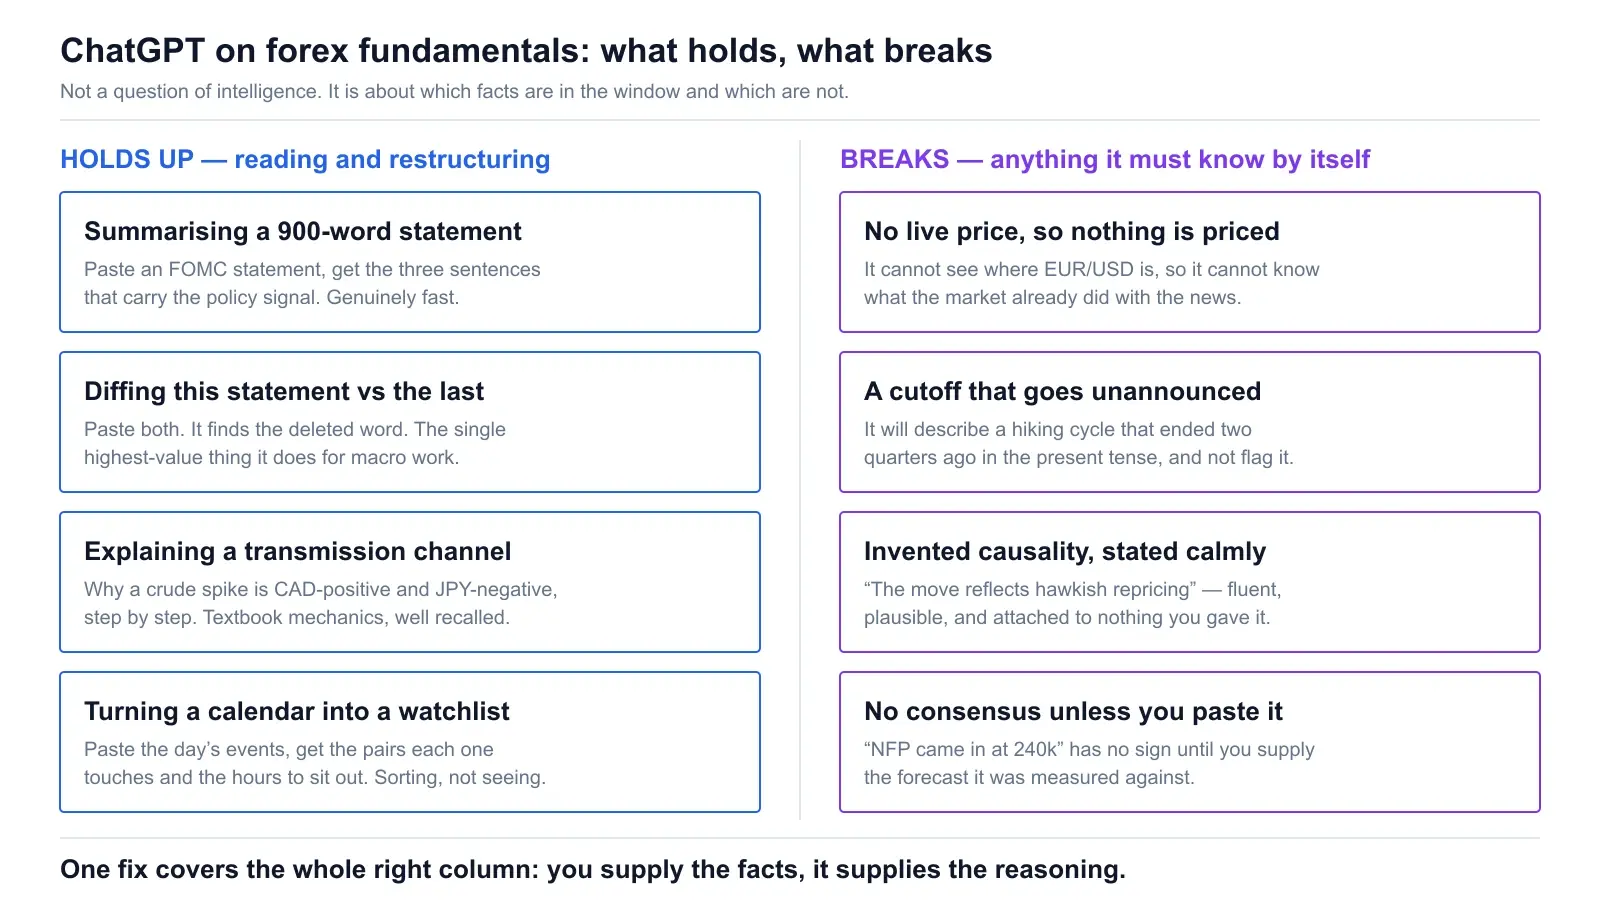
Fundamentals are a different question, and the honest answer is much better. Reading a 900-word policy statement and telling you which three sentences carry the signal is exactly the shape of problem a language model is built for. It is text in, text out, with no pixel-reading in the middle. On that task ChatGPT is quietly excellent, and most traders never use it that way because they are too busy asking it to draw trend lines.
But there are four specific failure modes on fundamentals, and every one of them is quiet. The model does not warn you. It produces the same fluent, well-organised paragraph whether it is reading a statement you pasted or reconstructing one from memory that stopped being true nine months ago. This piece is about telling those two outputs apart, and about the prompt shape that makes the second one much less likely.
Key Takeaways
- →ChatGPT is genuinely better at fundamentals than at charts, for a structural reason: text is verifiable by you, pixels are not.
- →Its best single trick is diffing this central bank statement against the previous one. Paste both. It finds the deleted word.
- →It cannot know what is already priced, because it cannot see price. That is the limit most people never notice.
- →A number without its consensus has no sign. “NFP 240k” is not information until you paste the forecast next to it.
- →Ask for the transmission chain, not the direction. A chain has links you can disagree with; a direction is a coin flip in prose.
- →Always demand a falsifier. One extra sentence in the prompt kills most of the confident nonsense.
- →Done properly this is a 30 to 50 minute morning routine. That is the real cost, and it is why people quietly stop doing it.
1. Why fundamentals go better than charts
There is one asymmetry underneath this whole article, and it is worth being explicit about because it explains every practical rule that follows.
When you hand a model a chart screenshot, you are asking it to convert pixel positions into prices against an axis it has to locate first. That is a hard perception problem, and vision models are still shaky at it. Worse, you cannot check what it saw. If it tells you resistance sits at 1.0940 and there is nothing at 1.0940, you have to go and verify against the chart yourself — at which point you have done the work anyway. Our accuracy review of whether ChatGPT works for trading charts goes through where that breaks in practice, and the chart analysis how-to covers the prompts that partially compensate.
Text is different. When you paste an FOMC statement into the window, both of you are looking at exactly the same object. If the model claims the committee dropped the word “elevated”, you can search the text you pasted in two seconds and see whether that is true. The verification loop is instant and free, which changes what the tool is good for.
So the reframe is simple: ChatGPT is not an analyst, it is a very fast reader with a good memory for economics textbooks. Give it something to read and a well-posed question, and it earns its keep. Ask it to know something, and you are rolling dice. For the broader map of that argument across all of trading, the full breakdown of what ChatGPT can and cannot do in trading is the head article; this one stays on news, statements and the calendar.
2. The four things it genuinely does well
These are not “use cases” from a marketing page. They are the four jobs where a chat window has beaten opening four browser tabs, in real morning routines, repeatedly.
Summarising a policy statement without losing the hedges
An FOMC statement runs around 400 to 500 words and a press conference transcript runs to several thousand. Most of it is boilerplate that has not changed since 2015. The signal lives in a handful of clauses, and it is deliberately buried, because central banks do not want a single sentence lifted out of context. A model reads the whole thing in one pass and surfaces the conditional language accurately — the difference between “the Committee expects” and “the Committee will” is exactly the kind of distinction it handles well, because that distinction lives in grammar and grammar is its home turf.
Diffing this statement against the last one
This is the best thing it does, full stop. Central banks communicate by editing. They keep the previous statement open and change a word, delete a clause, promote a risk from the second paragraph to the first. Traders who read only the current statement see a wall of familiar text; traders who compare the two see the entire message. Paste both statements and ask for a clause-by-clause diff with a policy reading attached, and you get in twenty seconds what a desk economist would spend twenty minutes on. The Fed publishes every statement and every set of minutes in full and free, which makes this trivially easy to set up.
Why the diff is the killer app. Everything else on this list, a determined trader can do alone with enough coffee. Nobody does a careful clause-level diff of two statements by hand at 19:05 UTC on a decision day, because there is no time. The model does it while the press conference is still running. That is not a marginal speedup, it is the difference between doing the work and not doing it.
Explaining a transmission channel
Why is a crude oil spike CAD-positive and JPY-negative? Canada exports energy and Japan imports essentially all of it, so the terms of trade move in opposite directions, which shows up in the current account, which shows up in currency demand — with a second-order effect through inflation and therefore rate expectations. That chain is textbook, well documented, and the model reproduces it cleanly and in order. If you are still assembling the mental model of how a data point reaches a currency, this is genuinely the fastest tutor available, and it will answer follow-ups at whatever level of detail you want.
Turning a calendar into a watchlist
Paste the day’s scheduled events with times and consensus figures and ask which pairs each one touches, and you get a usable sort. Not a forecast — a sort. Which of today’s eleven releases can actually reprice a rate path, which are noise, which hours you should be flat, which pairs are exposed to two events on the same day. That is clerical work, it is the part everyone skips, and it maps neatly onto what a model is good at. If the calendar itself is new to you, start with how to read an economic calendar for forex before automating anything about it.
The ECB Governing Council press conference of 30 April 2026, published in full by the European Central Bank. This is the raw material — the statement plus the Q&A transcript is exactly what you paste into the window. Note how much of the useful signal sits in answers to journalists rather than in the prepared text.
3. The four things that break it
Each of these fails silently. That is the important property. There is no error message, no hedge, no change in tone — you get the same confident, well-structured paragraph either way.
1. No live price, so it cannot know what is priced
Market reaction to news is a function of the gap between the print and expectations, and of what price already did in the hours before. A model with no price feed has neither. It will still write the sentence “much of this appears to be priced in”, because that sentence appears constantly in the financial text it was trained on. The vocabulary is right and the observation behind it is missing, which is a worse failure than simply not knowing, because it reads like knowledge.
Practical consequence: never accept a claim about positioning or pricing unless you supplied the price data yourself. If you paste in where EUR/USD sat an hour before the release and where it sits now, the model has something real to reason from. Without that, treat any pricing language as filler.
2. A knowledge cutoff that does not announce itself
This one has cost people real money. A model trained through a given month absorbed thousands of articles describing whatever the policy stance was at that time, all written in the present tense: “the Bank is expected to hold”, “the committee remains in restrictive territory”. Ask about that central bank today and it can reproduce that framing in the present tense, with no flag, because internally there is no marker saying this expired.
Browsing helps and does not solve it. When browsing fires, you get a live source; when it does not, or when it retrieves a secondary summary of a summary, you are back to memory with a citation stapled on. The defence is procedural: open the conversation by stating today’s date and the current policy rate for both currencies, and ask it to explicitly mark anything it is asserting from training rather than from what you pasted. It will comply, and the marked claims are the ones to check.
3. Confident invented causality
Ask why the dollar rallied yesterday and you will get an answer. You will always get an answer, and it will be plausible, well-written and structurally identical whether the model knows or not. “The move reflects hawkish repricing following firmer inflation expectations” is a sentence that fits almost any dollar rally in history, which is exactly why it is worthless. Financial commentary is full of this kind of retrofitted explanation, so the model learned it as the correct register for the question.
The tell is unfalsifiability. If the explanation would have worked equally well for the opposite move, it is narration. This is the failure mode the falsifier requirement in section 4 is built to catch, and it is the single most valuable line you can add to any macro prompt.
4. It has no consensus figures
Consensus forecasts are compiled from bank economist surveys and published a few days before a release. They are not stable historical facts, they are not in the training data in any reliable form, and the model has no access to them. So “non-farm payrolls printed 240k” is not information yet. If consensus was 180k, that is a hawkish shock. If consensus was 275k, the same number is a miss and the dollar sells. Same print, opposite session.
You have to supply both figures every single time. Trading Economics carries consensus alongside the historical series, and the primary releases themselves come from the Bureau of Labor Statistics for US inflation and employment. If a model ever volunteers a consensus number without you giving it one, that number is invented. There is no exception to this.
The pattern across all four. Every failure is the model asserting something it was not given. Every fix is you giving it. That is why the workflow below is mostly about what you paste in, and only secondarily about how you phrase the question. Our wider assessment of whether AI can do fundamental analysis in forex at all scores this component by component.
4. The prompt shape that fixes all four
Four moves. They are not clever and they are not prompt-engineering tricks. They are just the discipline of not letting the model fill a gap you could have filled.
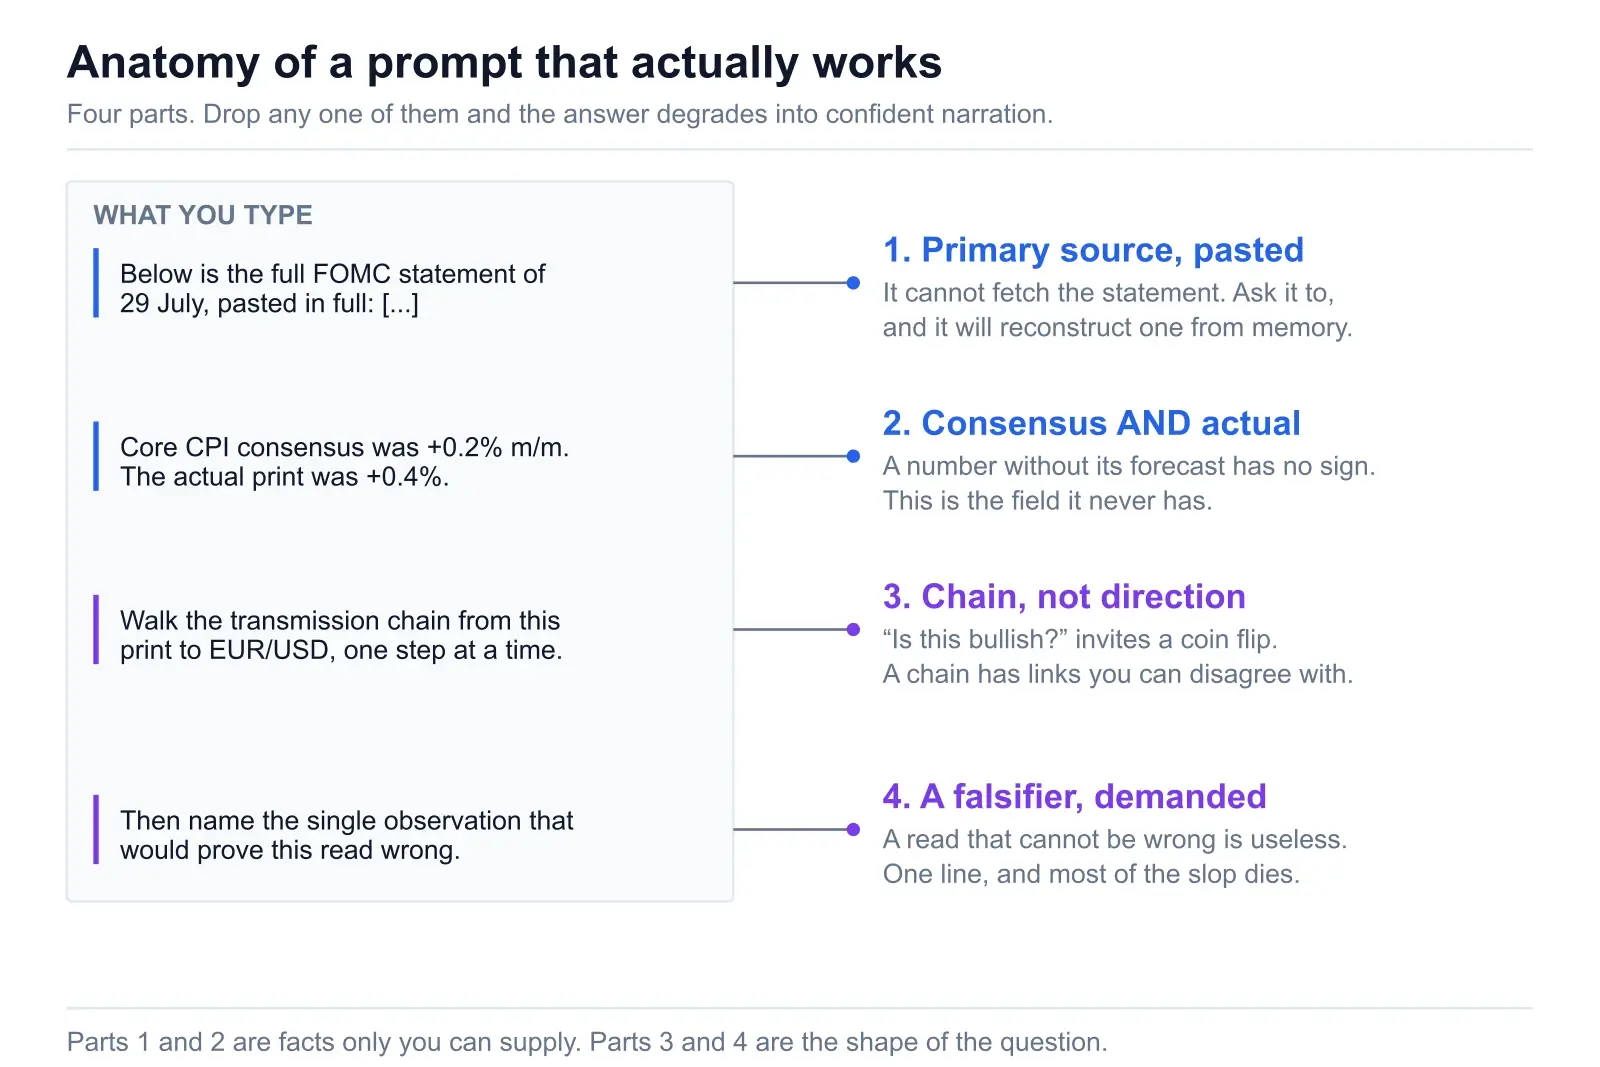
Move 1 — Paste the primary source yourself
Do not write “look up what the ECB said this week”. Go to the ECB’s monetary policy statement page, copy the text, paste it. This takes forty seconds and removes an entire class of error. It also means every claim the model makes about the statement is checkable by you against the same block of text, which is the whole reason fundamentals work better than charts here.
Move 2 — Supply consensus and actual together
Two numbers, one line, every time. Add the previous reading if you have it, because the sequence matters — a third consecutive upside surprise means something a one-off does not. This single habit is what separates a useful news read from a horoscope, and it is not optional.
Move 3 — Ask for the chain, not the direction
“Is this bullish for EUR/USD?” forces a binary answer out of a system with no price data, and you will get one. “Walk the transmission chain from this print to EUR/USD, one step at a time, and mark which links are strong and which are speculative” produces something structurally different: an argument with visible joints. You can then attack a specific joint. That is what makes the output useful even when the conclusion is wrong — and it usually is, because the conclusion is the part that needs the price data it does not have.
Move 4 — Demand a falsifier
“State the single observation that would prove this read wrong.” One sentence. It does two useful things. It makes the model commit to something specific instead of hedging in both directions, and it hands you a monitoring condition you can actually check during the session. If it cannot produce a clean falsifier, the read had no content, and you have found that out in ten seconds rather than after a stop-out.
5. Five prompts, written out in full
Copy these. Square brackets mark where you paste or type your own material. Each one comes with a note on why it is shaped the way it is, because the shape is the part worth stealing.
Prompt 1 — The statement diff
The highest-value prompt on this page. Run it within minutes of any rate decision, with both statements pasted in full.
Below are two central bank statements from the same committee.
STATEMENT A is the previous meeting. STATEMENT B is today's.

Do a clause-level comparison. Output exactly three sections:

1. CHANGED - every phrase that was added, removed or reworded,
   quoted verbatim from both versions, side by side. Include
   small edits. Do not paraphrase; quote.
2. POLICY READING - for each change, one sentence on whether it
   is hawkish, dovish or neutral, and why. If a change is purely
   editorial, say so and move on.
3. NET - one paragraph: has the expected rate path shifted, and
   in which direction? Then rate your confidence 1-5 and say
   what a 5 would have required.

Rules:
- Use only the two texts below. Do not use anything you know
  about this central bank from training.
- If a section of B is identical to A, do not mention it.
- Do not tell me what to trade.

STATEMENT A:
[paste the previous statement in full]

STATEMENT B:
[paste today's statement in full]
Why it is shaped this way. “Quote, do not paraphrase” is the load-bearing instruction — paraphrase is where invented nuance sneaks in, and quoted text is instantly checkable against what you pasted. Banning training knowledge stops it importing a stale stance into the reading. Asking what a confidence of 5 would have required is a small trick that reliably surfaces what the model thinks is missing. And “do not tell me what to trade” keeps it on the job it can actually do.
Prompt 2 — The release reaction
For CPI, payrolls, GDP, PMIs — any scheduled number. This is the one diagrammed above, and the one you will use most.
Today is [DATE]. Here is a data release and the numbers around it.

Release: [e.g. US core CPI, month-on-month]
Consensus: [e.g. +0.2%]
Actual: [e.g. +0.4%]
Previous: [e.g. +0.2%]
Prior two readings: [e.g. +0.3%, +0.1%]
Current policy rate: [e.g. Fed funds 4.00-4.25%]
Pair I care about: [e.g. EUR/USD]

Walk the transmission chain from this print to that pair, one
step at a time. For each step, state the link and then mark it
STRONG (mechanical, holds most of the time) or WEAK (depends on
conditions you cannot see from here).

Then answer three questions in order:
A. What does this print do to the expected rate path over the
   next two meetings, and why?
B. What is the other side of the argument - the strongest case
   that this print does NOT move the path?
C. State the single observation in the next 48 hours that would
   prove your read in A wrong. Be specific: a number, a level,
   a statement, or a named event.

Constraints:
- You cannot see price. Do not tell me what is priced in, and do
  not tell me what the market "will" do.
- If you use any figure I did not give you, flag it as [FROM
  MEMORY] on the same line.
Why it is shaped this way. STRONG/WEAK tagging is the useful part: it forces the model to admit which links in its own argument are shaky, and those are exactly where a read goes wrong. Question B is a built-in red team, so you get the counter-argument without having to ask for it separately and without the model knowing which side you are on. The [FROM MEMORY] tag is the cheapest cutoff defence there is, and it works — the model will genuinely mark its own recalled figures when you ask it to.
Prompt 3 — Calendar to watchlist
Run this once before the session with the day’s events pasted in. It is sorting work, not forecasting work, which is why it lands.
Today is [DATE]. Below are today's scheduled economic events,
copied from my calendar with times in UTC, consensus and previous.

Produce a table with one row per event and these columns:
- Time (UTC)
- Event
- Pairs directly exposed (max 3)
- Transmission channel, in one clause
- Path relevance: HIGH if it can move rate expectations for the
  next two meetings, LOW if it is growth colour only

Then, below the table, three short lists:
1. HOURS TO SIT OUT - windows where two or more HIGH events
   overlap, or where one HIGH event lands.
2. DOUBLE EXPOSURE - any pair touched by two events today, and
   which one lands first.
3. WIDE CONSENSUS - any event where the forecast range looks
   unusually uncertain based on how the estimate is worded.

Rules:
- Rank by path relevance, not by the calendar's impact stars.
- Do not predict any of the numbers. If you catch yourself
  estimating a print, stop and write "no forecast" instead.

EVENTS:
[paste today's calendar rows]
Why it is shaped this way. Impact stars on a retail calendar are a crude proxy that treats every red event as equal; ranking by whether something can shift the next two meetings is the distinction that actually matters. The “no forecast” instruction is there because models will cheerfully estimate a CPI print if you leave the door open, and that estimate is pure invention. The double-exposure list catches the trap where you take a EUR trade at 09:00 having only noticed the 13:30 US event.
Prompt 4 — The cutoff guard
Run this once at the top of any macro conversation, before anything else. Thirty seconds, and it prevents the most expensive silent failure on the list.
Today is [DATE]. Before we start, calibrate yourself.

1. State your training cutoff, and how many months ago that is
   relative to today's date above.
2. For [CURRENCY A] and [CURRENCY B], write down what you believe
   the current policy rate and policy direction are, and label
   each one [FROM TRAINING].
3. Then stop and wait. I will correct anything that is out of
   date before we go further.

For the rest of this conversation:
- Treat anything I paste as authoritative and current.
- Treat your own recall of rates, meetings, guidance or data as
  provisional, and tag it [FROM TRAINING] every time you use it.
- If you are unsure whether something has changed since your
  cutoff, say "may be stale" rather than asserting it.
Why it is shaped this way. Step 2 is the point. Having the model write its stale belief down explicitly, before you have asked it anything, turns an invisible assumption into a visible one you can correct in a single line. Making it stop and wait matters too — if it barrels on into analysis, the stale premise is already baked into everything that follows. The persistent tagging rule then carries the discipline through the rest of the session.
Prompt 5 — The red team
Run this on your own macro thesis, not on the model’s. It is the only prompt here where you are the one being tested.
Here is my fundamental view. Your job is to attack it, not to
help me feel better about it.

MY VIEW: [one paragraph - the pair, the direction, and the
fundamental reason, in your own words]
EVIDENCE I AM USING: [the statements, prints and figures you
actually looked at - paste them]

Do four things:

1. Restate my argument as a numbered chain of claims, so I can
   see the steps I skipped over.
2. Identify the weakest link in that chain and say precisely why
   it is weak.
3. Build the strongest opposing case using ONLY the evidence I
   pasted. No new facts.
4. List what is missing - the specific data, statement or figure
   that would settle the disagreement between 2 and 3, and tell
   me where it is published.

Do not conclude. Do not tell me who is right. If my argument is
mostly sound, say which single piece of evidence is carrying it.
Why it is shaped this way. Models are agreeable by default, and an agreeable macro conversation is worse than no conversation because it launders your existing bias back to you with better grammar. Explicitly assigning the adversarial role fixes most of that. Restricting the opposing case to your own pasted evidence stops it inventing a counter-argument out of nothing. And step 4 is the most useful output on this page: it tells you what to go and read next, which is a question the model can answer well precisely because it is about where information lives rather than what the information says.
One thing none of these prompts do. None of them ask for an entry, a stop or a position size. That is deliberate. The moment you ask a model with no price data for a level, it produces a plausible number, and a plausible number is worse than no number because you will anchor on it. Keep the fundamental conversation entirely in the language of direction of pressure and mechanism. Levels come from the chart, and they come later.
6. Reading the answer without being sold to
The output will be well-organised and confident regardless of quality. So you need a few reflexes for grading it, and they take seconds.
- Search the pasted text for every quote. If it claims the committee added “risks are broadly balanced”, Ctrl+F it. Thirty seconds, and it catches paraphrase drift, which is where most subtle errors live.
- Check whether the explanation is reversible. Would the same paragraph have worked for the opposite outcome? If yes, it is narration and you can bin it.
- Hunt for unsourced numbers. Any figure you did not paste is suspect, including ones that look innocuous like a previous month’s reading. Verify against the calendar or the primary agency, not against the model.
- Reject the pricing language. If it says something is priced in, delete that sentence unless you supplied the price data it would need.
- Keep the falsifier, discard the conclusion. The falsifier is a monitoring condition you can check during the session. The conclusion is a guess dressed as an inference.
Then go and look at a chart
A fundamental read tells you which direction has pressure behind it. It says nothing about whether there is a trade today. That still comes from structure, and the two need to agree before you touch anything. If you want a second opinion on the chart half that has not been told what your fundamental view is, the Chart Snipe tool takes a screenshot and returns pattern, trend, a probability read and entry and risk guidance — useful here specifically because it cannot be talked into agreeing with the macro story you just built.
7. The honest cost of doing this yourself
Everything above works. The problem is not that it fails, the problem is that it takes real time and the time recurs every single morning.
Add it up honestly. Finding and opening the sources: about five minutes. Copying statements across, both of them if you want the diff: four. Typing in consensus, actual and previous by hand, because the model has none of them: six. Prompting, reading, pushing back, re-prompting because the first answer narrated instead of reasoning: twelve, and that is a good day. That is roughly half an hour for one currency, before you have looked at a single chart. Two or three currencies and you are into an hour.
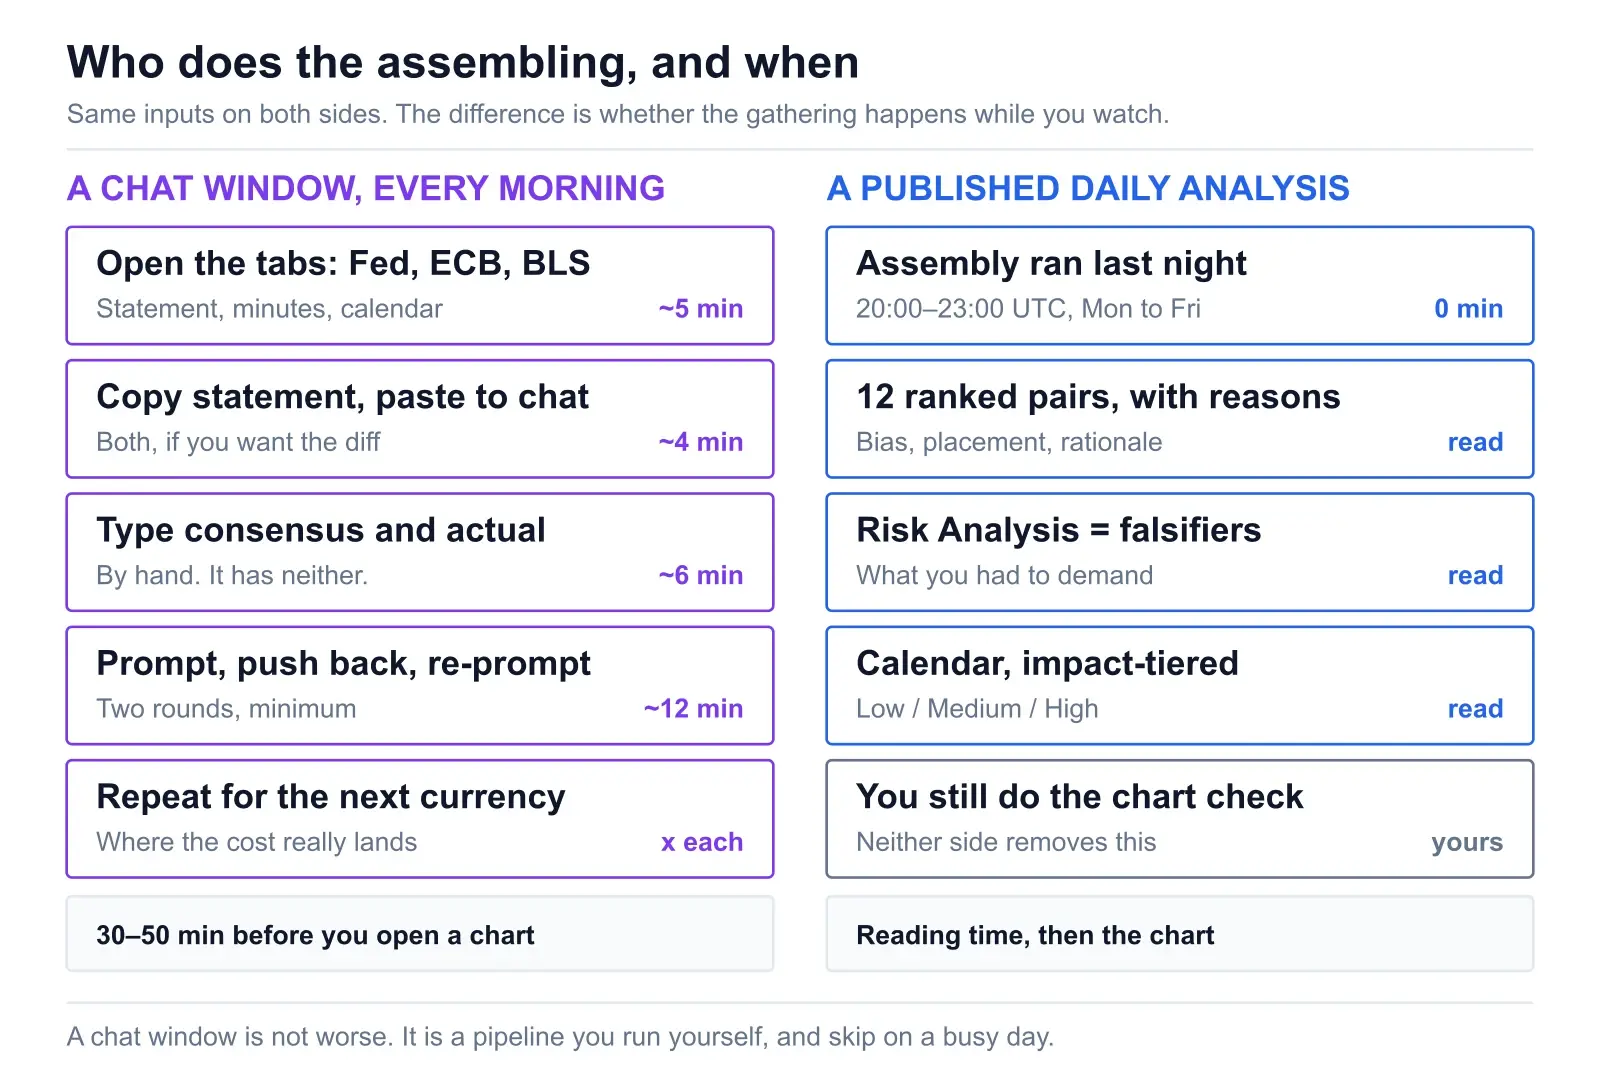
This is not an argument that the chat window is worse. It is an argument about what a pipeline is. A chat window is a manual pipeline: you are the retrieval step, the input formatter and the scheduler. It works exactly as long as you keep running it, and the honest failure mode is not a bad answer, it is a Thursday where you skip the whole thing and trade off yesterday’s impression.
What a pre-assembled version looks like
The alternative is that the assembling already happened before you sat down. That is what the News Impact analysis is: the same reading and cross-referencing, run overnight across 12 ranked instruments, published Monday to Friday between 20:00 and 23:00 UTC for the upcoming session. It is an in-app page, not an emailed newsletter, and there is no weekend edition because there is no weekend session.
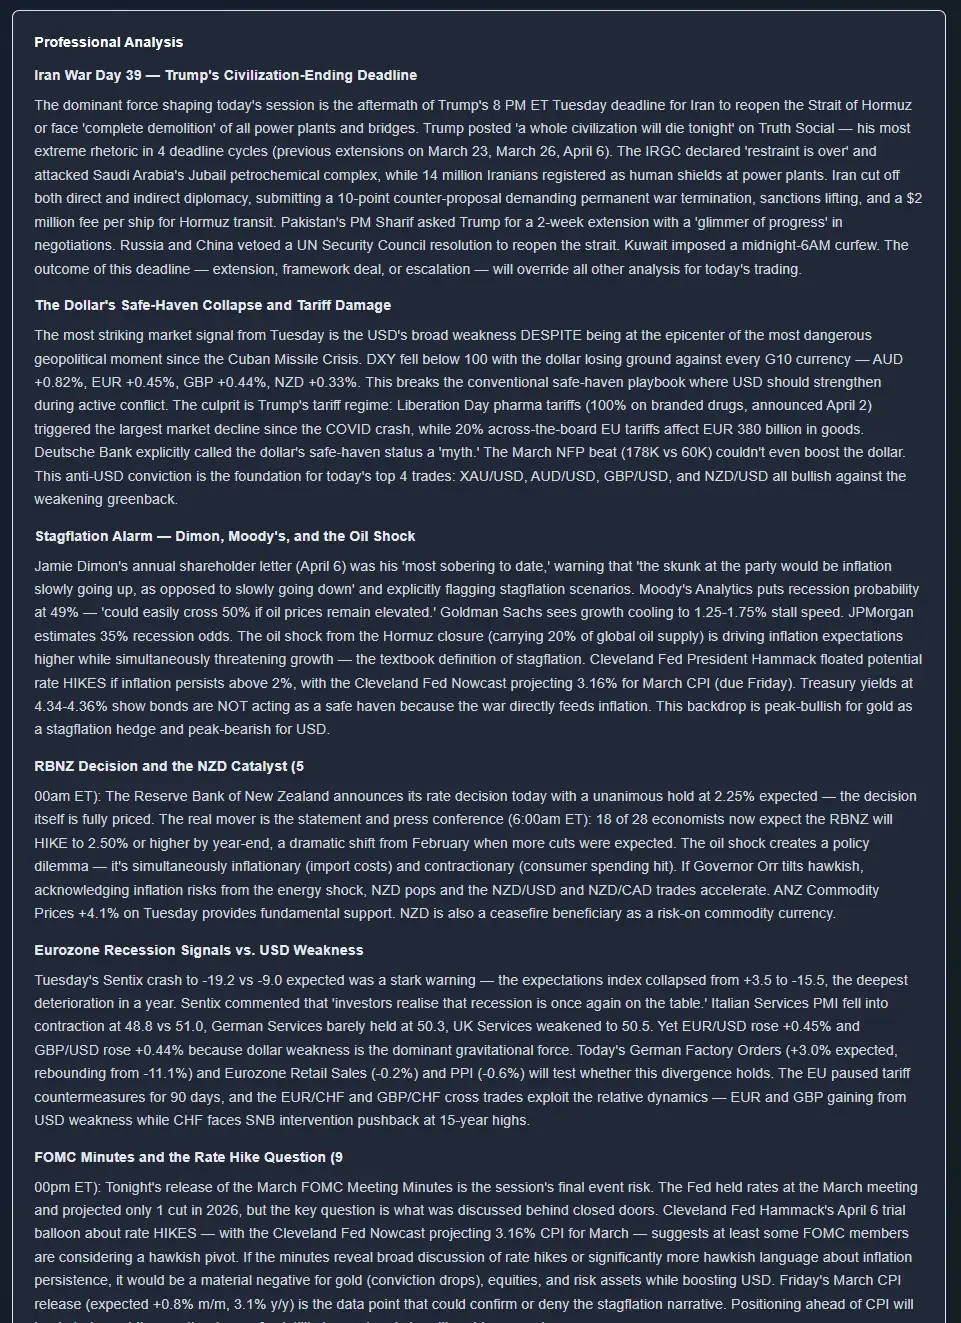
The part that maps most directly onto this article is the Risk Analysis block, because it is the falsifier requirement from move 4 done in advance and across the whole book rather than one pair at a time.
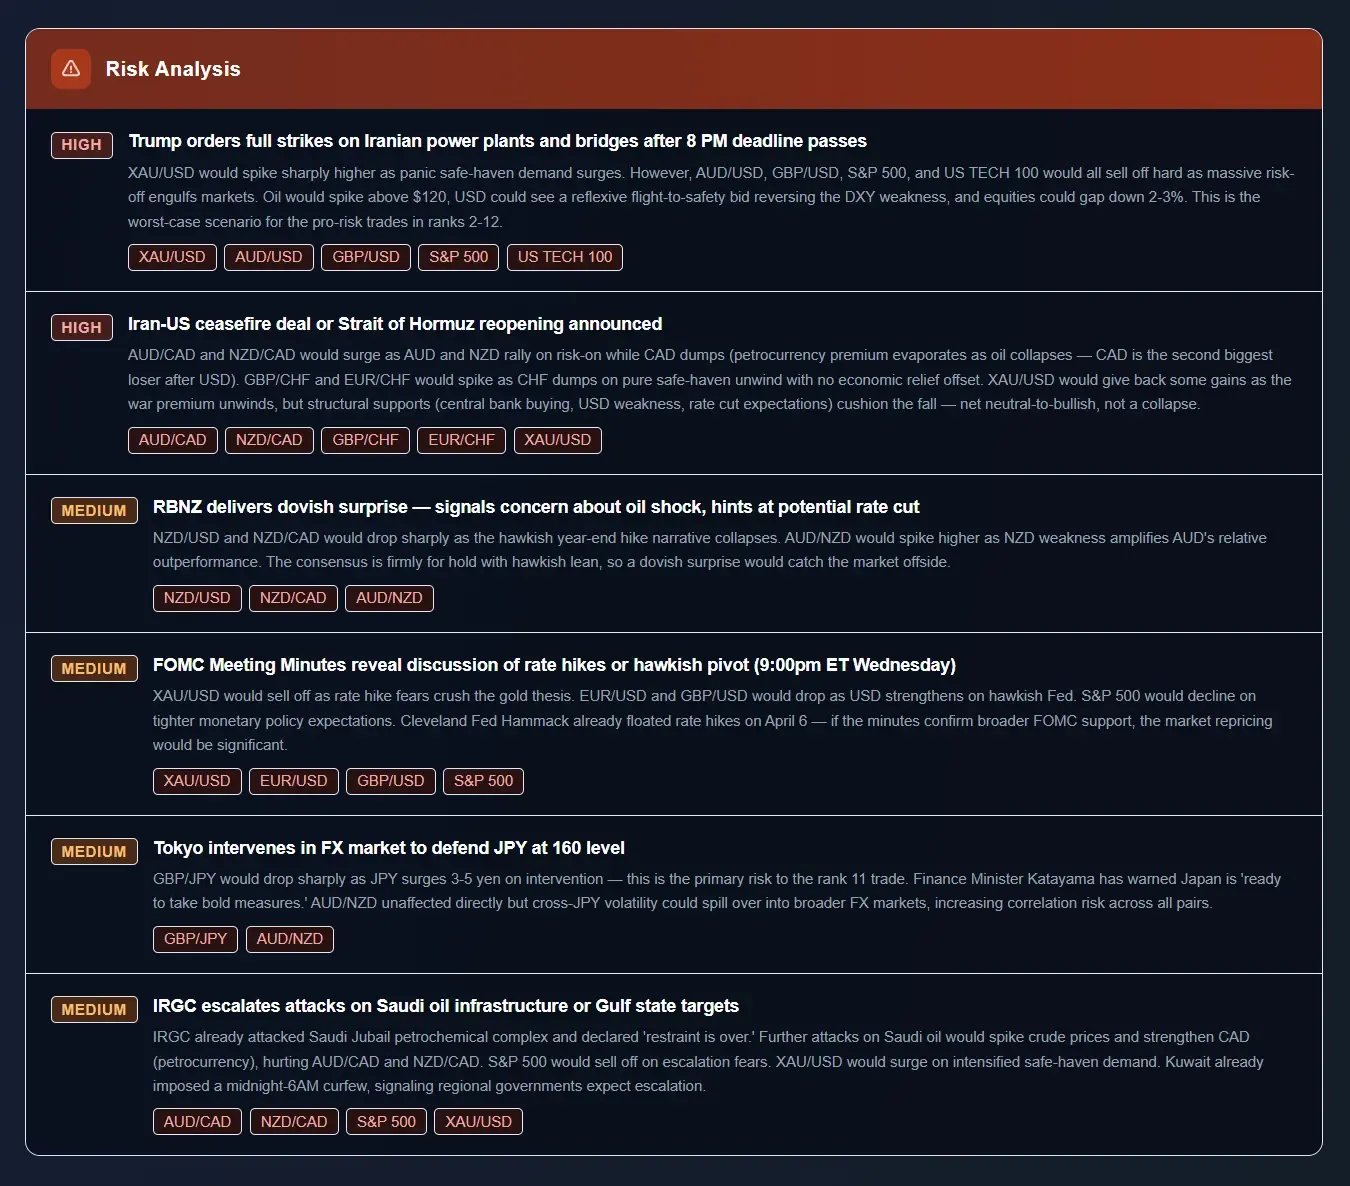
Alongside those sit 12 currency and instrument cards carrying a bias, a ranking placement and written reasoning, plus an economic calendar widget with Low, Medium and High impact levels and live prices across 32 instruments. The full analysis is on the Pro and Premium plans; free accounts see an admin-featured past-day preview, which is enough to judge the format before paying for it.
The honest version of this comparison. A published analysis does not read the statement better than you and ChatGPT would. It reads it at the same standard, on a schedule, whether or not you were busy — and it removes the two steps that are pure clerical cost, which are finding the sources and typing in the consensus numbers. If you enjoy the process and you reliably do it every morning, keep doing it in the chat window. Most people do not, and that is the actual argument.
8. When not to bother
A short list, because knowing when a tool is the wrong tool is most of using it well.
- In the first ten minutes after a release. The window where the reaction is decided is measured in seconds and you are typing. Read the number, know your plan, and do the analysis afterwards. A statement diff is worth running at 19:05; it is not worth running at 19:00:03.
- For anything requiring a live number. Current price, current implied rate pricing, current positioning, this morning’s spread. It has none of it and it will not say so.
- To pick between two setups. That is a risk decision about your account, and the model does not know your account, your open correlated positions or whether you can sit at a screen at 13:30 UTC.
- When you have not read the source yourself. If your only contact with the statement is the model’s summary, you have outsourced the one part that was actually free. Read it, then use the model to find what you missed.
- For breaking geopolitical news. Unscheduled events are the definition of what is not in the training data, and the moves happen before any text exists to paste.
What is left after those exclusions is still a lot: statement diffs, release post-mortems, calendar sorting, transmission-chain tutoring and adversarial review of your own thesis. That is a real and useful slice of the work, and it is the slice this article is about.
Frequently asked questions
Can ChatGPT analyze forex news?
It can analyse news you give it. It cannot reliably find the news itself. Paste the text of an FOMC statement, an ECB press conference transcript or a BLS release and it will summarise accurately, pull out what changed, and explain the mechanism connecting a data point to a currency. Ask what the Fed said last week without pasting anything and you are gambling on whether browsing fired, whether the source was primary, and whether training data is quietly answering instead. You supply the facts, it supplies the reasoning.
How do I use ChatGPT for forex fundamental analysis?
Four moves in order. Paste the primary source yourself rather than asking it to look something up. Give it both the consensus and the actual, because a number has no sign without the number it was measured against. Ask for the transmission chain rather than a direction — “walk the mechanism from this print to EUR/USD” gives you an argument with joints you can attack, while “is this bullish” gives you a coin flip in prose. Then make it state what would falsify the read.
Why does ChatGPT get central bank policy wrong?
The knowledge cutoff, and the fact that it does not flag the cutoff on its own. A model trained through a given month absorbed thousands of documents describing whatever stance was current then, all written in the present tense. Ask about that bank today and it will describe a stance that expired quarters ago, in the same confident register it uses for things that are still true. It is not lying — it has no internal sense that time has passed. State today’s date and both current policy rates at the top of every macro conversation, and ask it to tag anything it is asserting from memory.
Can ChatGPT tell me what is already priced in?
No, and this is the biggest limit for fundamentals work. Knowing what is priced requires seeing where a pair trades now and where it traded before the news. It has neither unless you paste them. It will still use the phrase fluently, which is what makes it dangerous — correct vocabulary, missing observation. If you want it to reason about pricing, give it the levels: where the pair was an hour before the release, where it is now, and what consensus was.
What is the best ChatGPT prompt for an economic calendar?
Paste the day’s events with times, currencies, consensus and previous values, then ask for a table of which pairs each event touches, the transmission channel in one clause, and the specific hours to stay flat. Ask it to rank by how much each event can move the rate path rather than by the calendar’s own impact stars, and to flag any pair exposed to two events on the same day. Do not ask it to predict the numbers — it has no macro forecasting ability and anything it produces there is invented. Prompt 3 above is the full version.
Is ChatGPT better for fundamentals or for charts?
Fundamentals, comfortably, and for a structural reason. Fundamental work is reading, comparing and restructuring text, which is what a language model is built to do. Chart work requires reading pixel positions against a price axis, which vision models are still unreliable at — hence the invented levels. On text you can verify the input because you pasted it. On a chart image you cannot verify what the model saw. That asymmetry is the whole argument.
Should I trust a trade idea ChatGPT gives me from the news?
Treat the reasoning as useful and the conclusion as unowned. The mechanism — hotter core CPI pushes the expected first cut further out, which lifts front-end yields, which supports the dollar — is usually textbook correct and worth writing down. The direction attached to it is not, because the model has not seen the price reaction, does not know positioning, and does not know your account. Build the argument with it, then decide the trade yourself against your chart and your risk rules.
What are the limits of using a chat window for daily macro?
Time and consistency, not capability. Done properly it means opening the source pages, copying statements, typing in consensus and actual figures, prompting, pushing back and repeating per currency — realistically 30 to 50 minutes before you open a chart, and it is the routine that gets skipped on a busy day. The alternative is a pre-assembled analysis where the gathering already happened. ChartSnipe’s News Impact analysis publishes Monday to Friday between 20:00 and 23:00 UTC for the upcoming session, with 12 ranked pairs, per-currency bias cards, a Risk Analysis scenario list and an impact-tiered calendar. Full analysis is on the Pro and Premium plans.
Sources & further reading
- → Federal Reserve — FOMC calendars, statements and minutes — every statement in full, free, in a form you can copy straight into a chat window. This is the source for prompt 1.
- → European Central Bank — monetary policy statements — the euro-leg equivalent, including the press conference Q&A where the guidance usually actually shifts.
- → Bureau of Labor Statistics — news release schedule — exact dates and times for CPI and the employment situation report, published a year ahead. Primary source, not a summary of one.
- → Trading Economics — economic calendar — consensus forecasts alongside the historical series. This is where the numbers for prompts 2 and 3 come from, and the model has none of them.
Or skip the assembling
The prompts above work. They also cost you half an hour of copying and typing before you open a chart. News Impact runs the same reading overnight across 12 instruments and publishes Monday to Friday between 20:00 and 23:00 UTC for the upcoming session — ranked pairs with written reasoning, per-currency bias cards, a Risk Analysis list of what would break the day, and an impact-tiered calendar. Then you still do the chart check yourself, exactly as you would have.