
How to Trade a Rounding Top Pattern
A rounding top is a bearish reversal that builds slowly, as buyers fade rather than flee. Here is how it forms, how it differs from a double top and a head and shoulders, and how to trade the neckline break with the maths worked out.
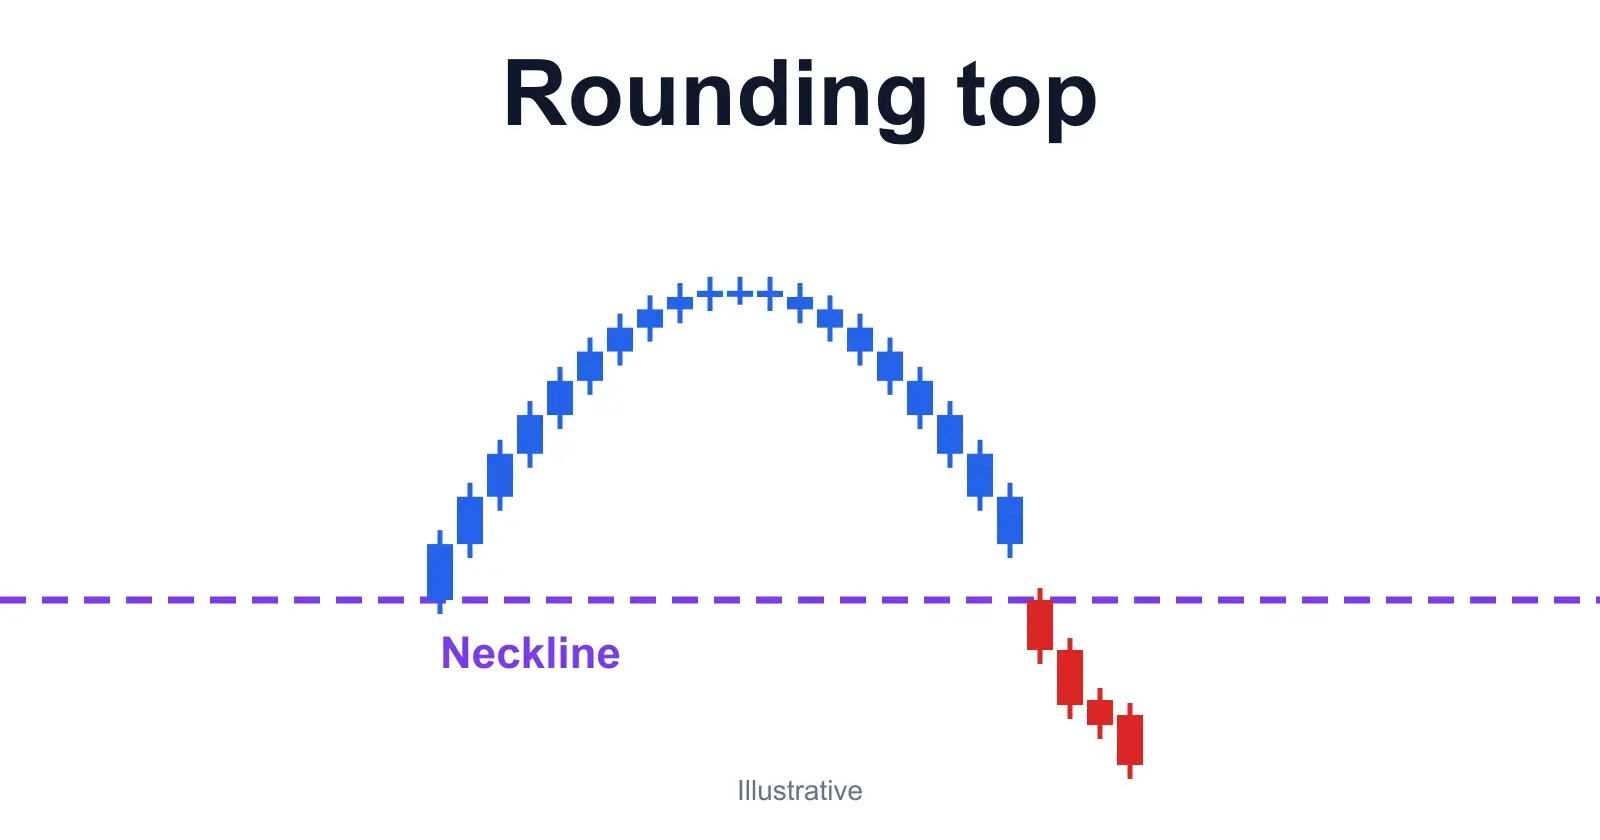
A rounding top (also called a rounded top or an inverted saucer) is a bearish reversal pattern. Price climbs in a smooth arc, flattens at a rounded peak, then slides back down at roughly the speed it went up. The signal is not the dome itself but a candle closing below the flat level the advance started from, the neckline. Until that close, you have a hunch with a nice shape.
So is it bullish or bearish? Bearish in its textbook form, and a weak one in practice. It is slow, it is easiest to spot after it has finished, and the data is less kind than the pictures. Bulkowski’s own statistics show that only 14% of downward breakouts reached the price target. This guide covers what the pattern is, why it forms, how it differs from a double top or head and shoulders, and a full trade with entry, stop, target and position size.
Key Takeaways
- →A rounding top is a smooth arc after an uptrend. It is confirmed only by a close below the neckline, the flat base level the advance launched from.
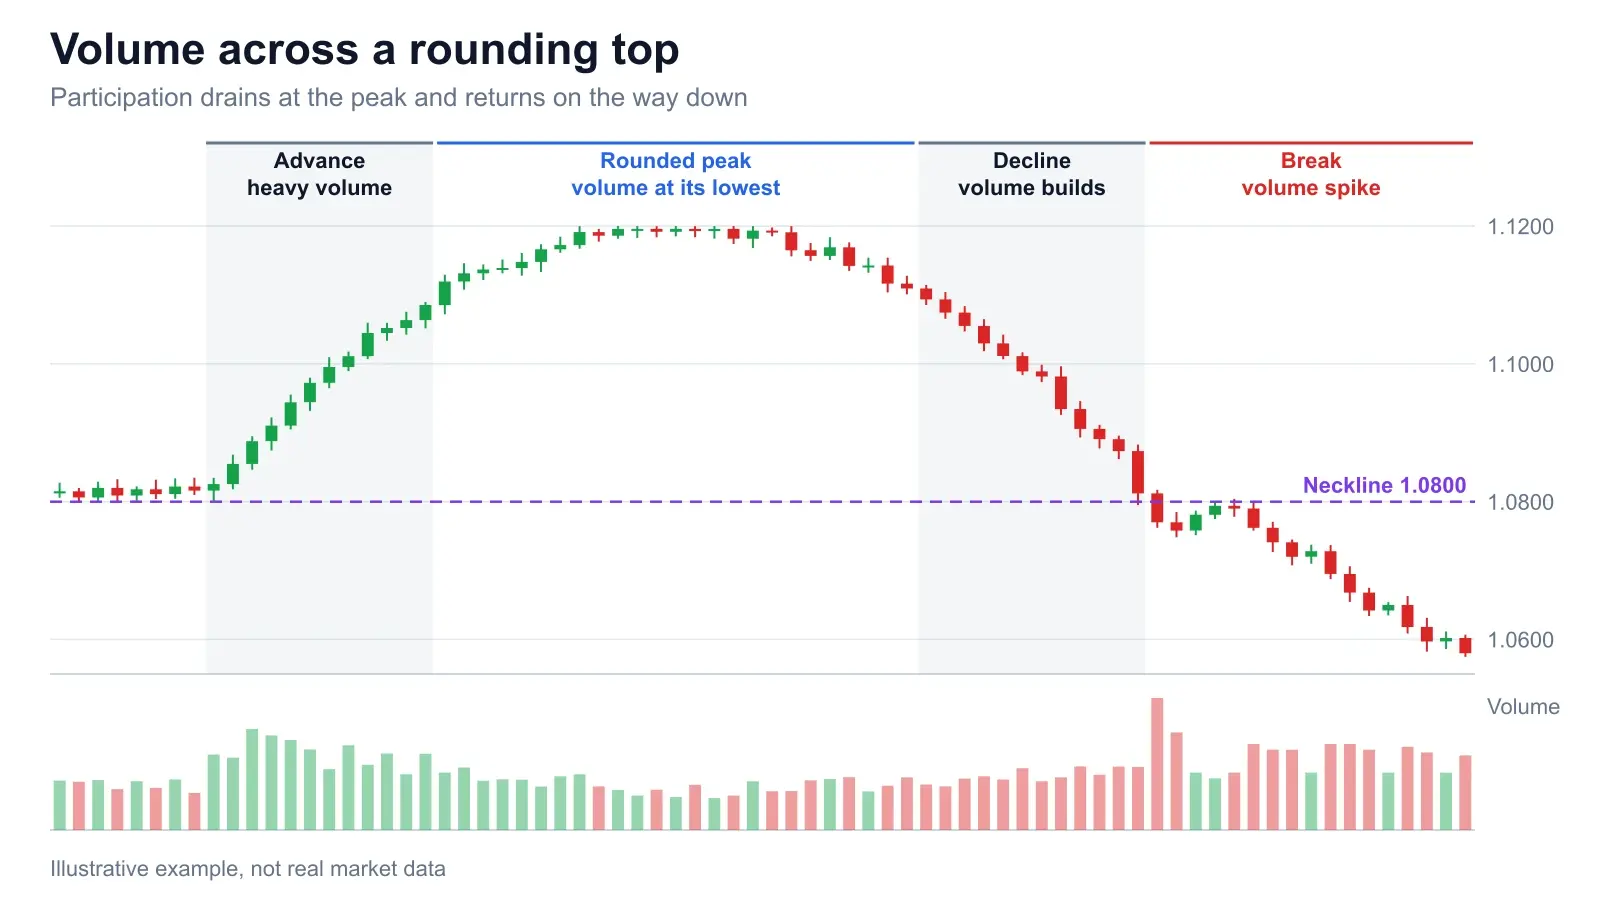
- →It forms from gradual distribution: buyers thin out over weeks, not in one shock. Volume tends to be lightest at the peak and rise on the way down.
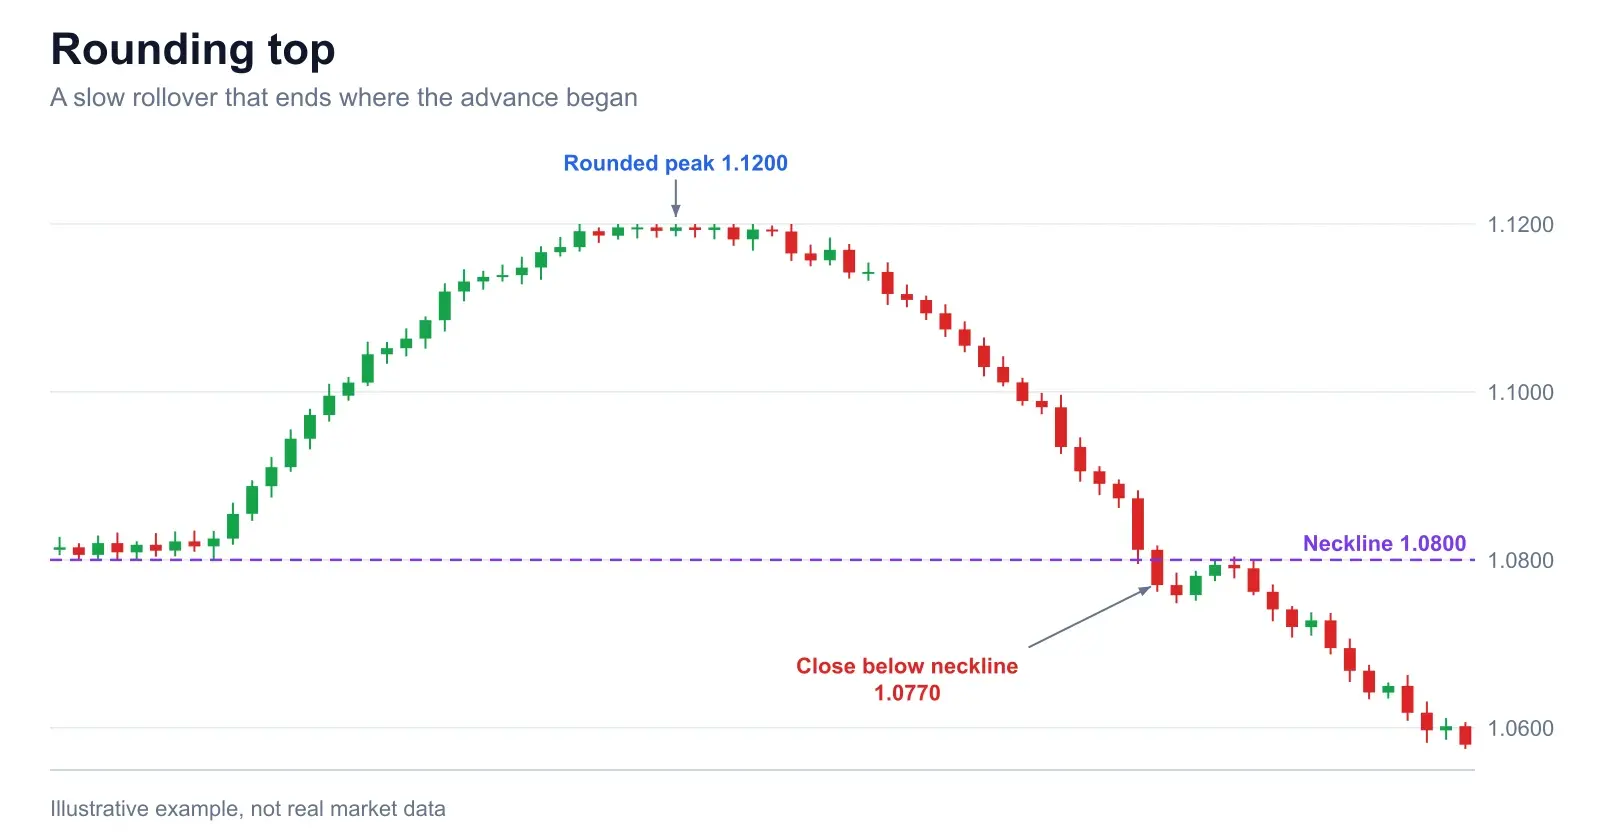
- →Worked example (illustrative EUR/USD-style prices): neckline 1.0800, peak 1.1200, so the height is 400 pips. A retest short at 1.0790 with a 1.0850 stop risks 60 pips for a 390 pip target, 6.5R.
- →Treat the target as a ceiling. On Bulkowski’s Pattern Site (bull-market results) only 14% of downward breakouts met it, and the average decline was 17%.
- →The weaknesses are real: slow, subjective, obvious in hindsight, and no clean level until the break. Skip it when the arc is ragged or has no base.
1. What is a rounding top pattern?
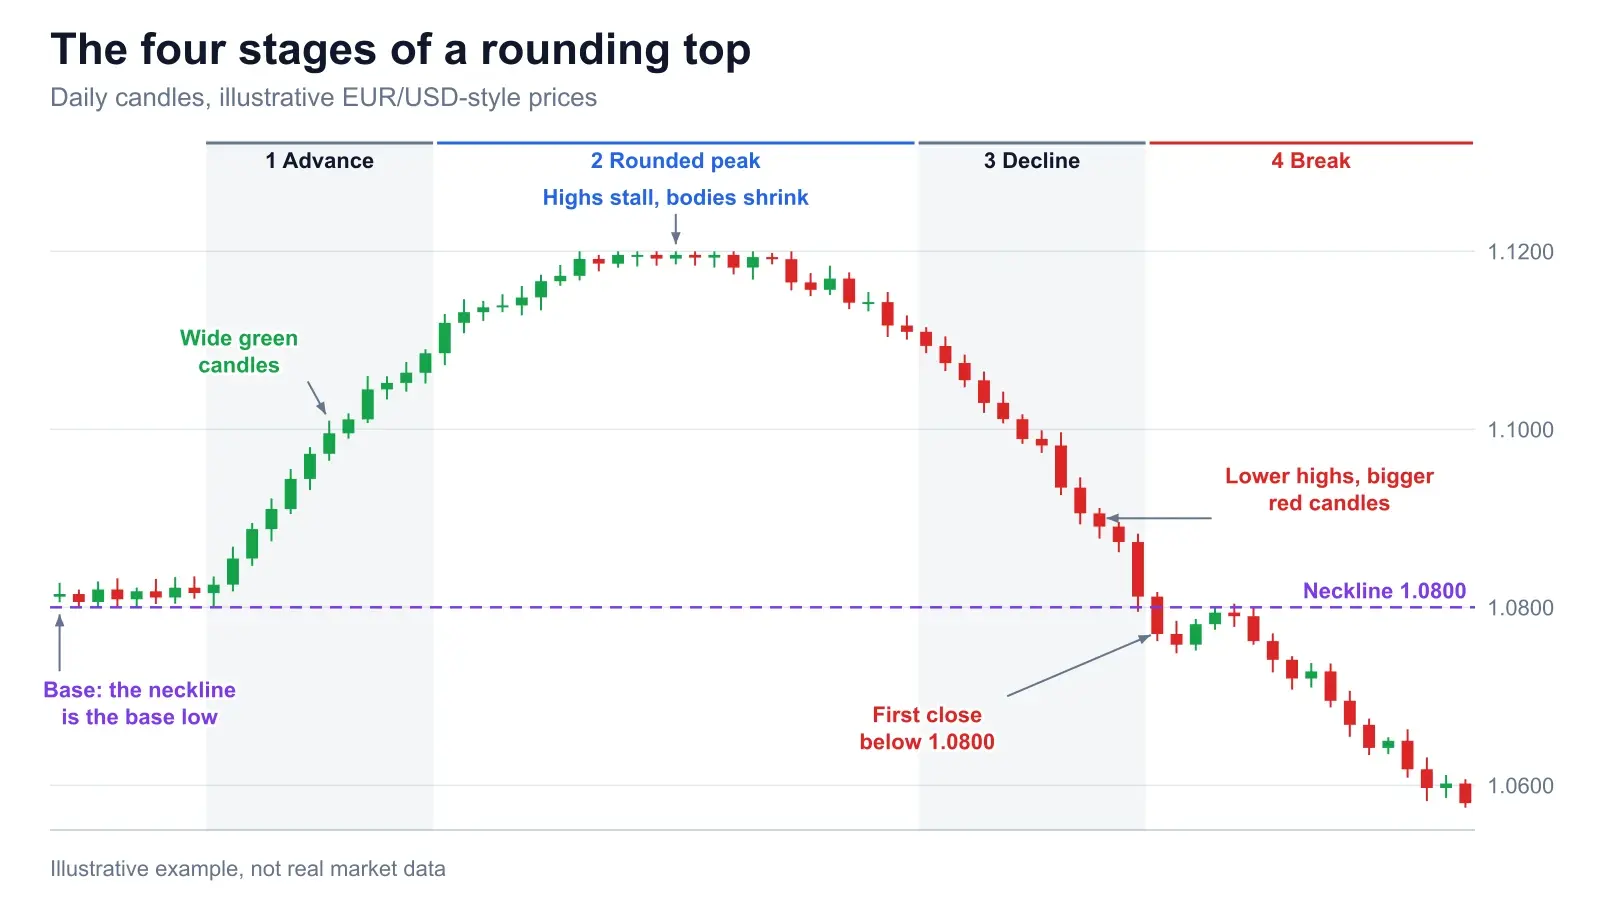
Picture four stages. First, an advance: a normal uptrend with wide green candles and rising highs. Second, a rounded peak: each push higher gains less than the last, candle bodies shrink, and price drifts sideways near the high. Third, a decline: lower highs, bigger red candles, falling back toward where the move began. Fourth, the break: a close below the neckline.
The neckline is a flat line at the base of the arc. In the example below, price spent eight candles in a tight range with lows at 1.0800 before launching. That level was tested as support before the advance, which is why it is a level a trader would actually watch. Bulkowski defines the downward breakout the same way: a close below the lower of the arc’s two ends (the “rims”). The peak, 1.1200, sits 400 pips above it.
2. Why it forms: gradual distribution
A double top is a fight at one price. A rounding top is closer to a slow leak. Early buyers who got in near the base start taking profit into strength, but they do it in small pieces, so price keeps edging up. New buyers show up less often. For a stretch, supply and demand roughly cancel and the highs go flat. Then the sellers outnumber the buyers a little more each day, and the arc rolls over.
That is why there is no single headline or shock behind it, and why it is hard to find while it is happening. Volume tells the story. It is typically heavy early in the advance, thins as price rounds over, and picks up on the decline. A spike on the break supports the signal, and a break on thin volume is a warning that follow-through may be missing, as Capital.com’s rounding top guide puts it. Bulkowski’s page lists heavy breakout volume as a sign of better performance, but it gives no volume profile for the whole pattern, so treat the shape below as common practice, not a measured rule.
3. Is a rounding top bullish or bearish?
It is classed as bearish because it forms after an uptrend and shows buying pressure draining away. But “classed as bearish” is not the same as “usually works”. Capital.com says directly that many arcs that resemble rounding tops resolve as continuations rather than reversals.
Bulkowski’s Pattern Site lists results for both directions, and the gap is large. For upward breakouts, the average rise is 55% and 58% meet the price target. For downward breakouts, the average decline is 17%, only 14% meet the target, and the break-even failure rate is 20%, against 9% for upward breakouts (his bull-market results, updated 2020, based on more than 950 “perfect trades”, a term for patterns picked for clean structure). The page does not say how often each direction occurs, so these numbers do not tell you the odds of a downward break. They tell you the upside break has historically paid better when it happens. That is a reason to wait for the close, and not to short the dome.
4. Rounding top vs head and shoulders
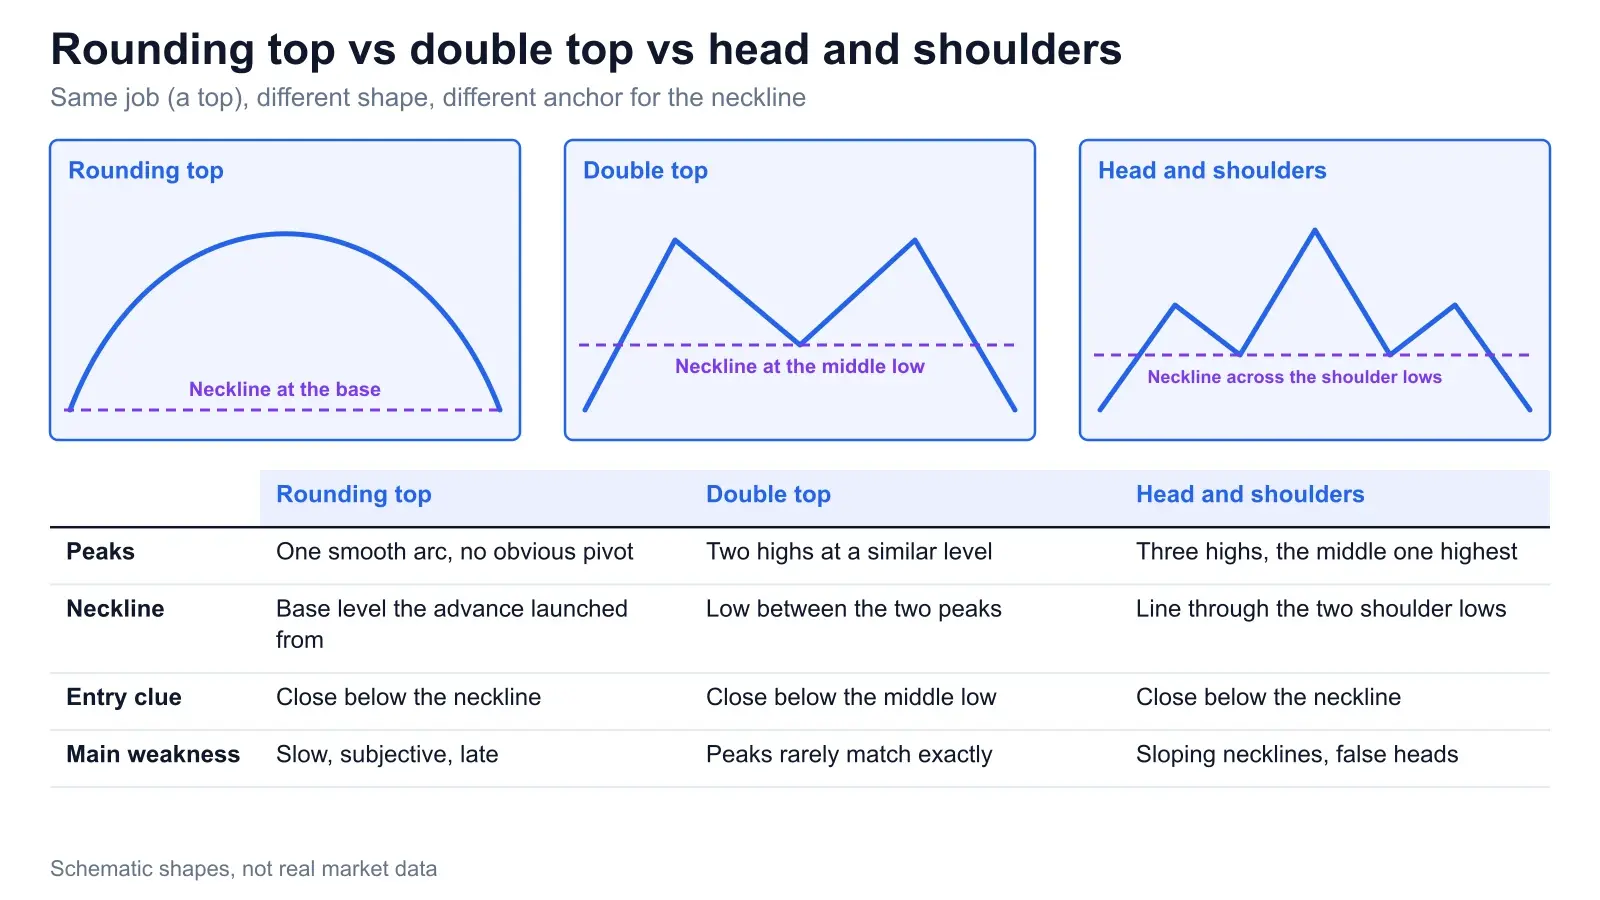
All three of these patterns are tops, and all three trigger on a close below a neckline. The difference is what anchors that line. A head and shoulders has three distinct peaks, with the neckline running through the two shoulder lows, so the level exists on the chart before the break. A double top has two similar highs and a neckline at the low between them. Both are covered in our double top, double bottom and head and shoulders guide.
A rounding top has no obvious pivot highs to measure against, just a curve. The neckline is a base level from before the advance, so it is real only if price actually consolidated there. That makes it the slowest of the three to form, the most subjective to draw and the latest to confirm, because price has to complete the whole round trip before the trigger arrives.
5. How to confirm a rounding top
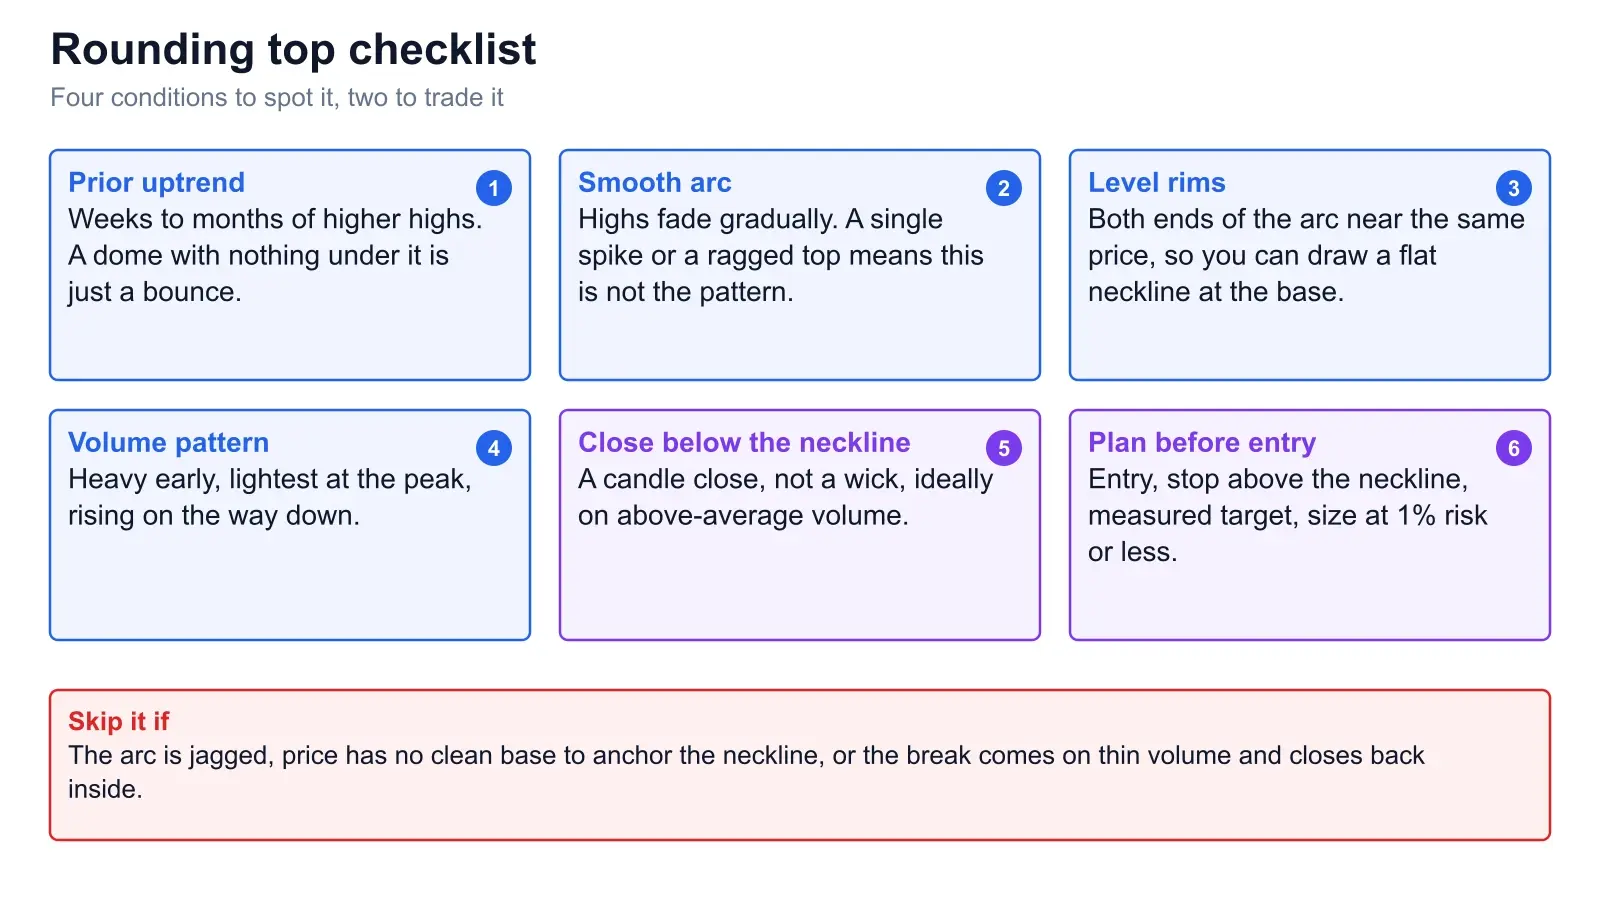
Four conditions to spot it, two to trade it. You need a clear prior uptrend, because an arc on a ranging chart is just noise. The arc should be smooth: highs fading gradually rather than one spike and a collapse. Both ends should sit near the same price, so you can draw a flat neckline. And volume should be lighter at the peak than at the start. Then the trade conditions: a candle close below the neckline, not a wick, and a plan written before you click.
A bearish candle at the break helps. If you want a refresher on what to look for, our bearish reversal candlestick patterns guide covers the signals that often show up at the right side of a dome. Also check the higher timeframe, since a daily rounding top inside a strong weekly uptrend deserves less trust. If you want an independent read of your own chart, you can upload a screenshot to the Chart Snipe tool and compare its read of the structure and levels with yours.
6. How to trade a rounding top
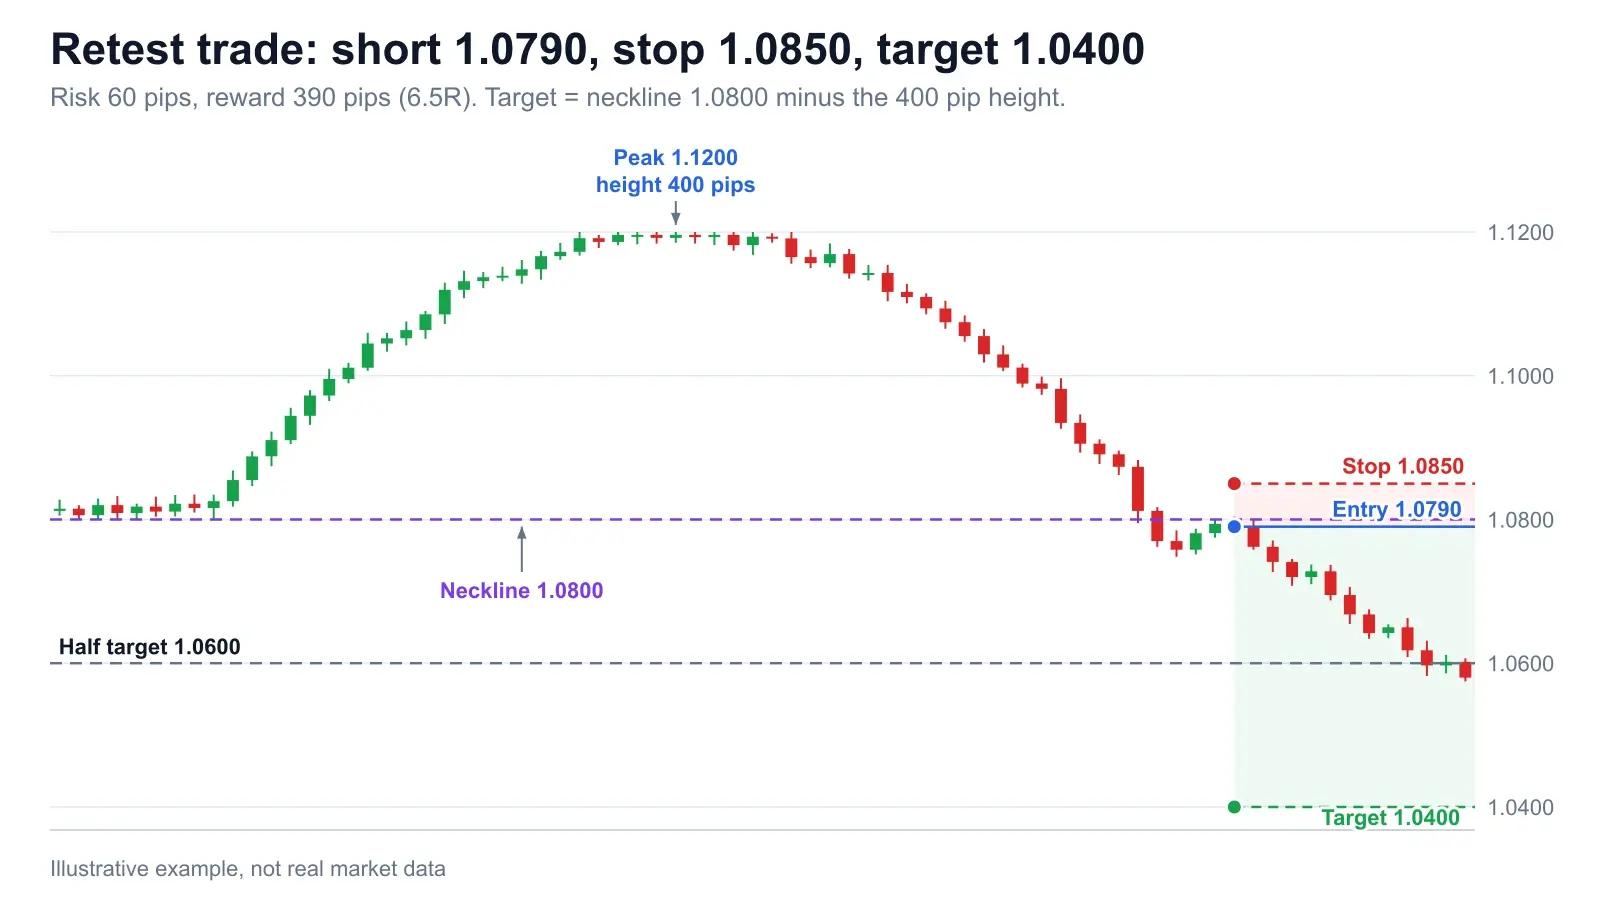
The numbers below are an illustration on EUR/USD-style prices, not a recommendation or a real market. The neckline is 1.0800, the peak is 1.1200, so the height is 0.0400, or 400 pips. The measured-move target is the neckline minus the height: 1.0800 − 0.0400 = 1.0400.
Two ways in. The aggressive entry sells the close of the first candle below the neckline, here 1.0770. It is faster, and you will never miss the move, but you pay for it with a wider stop. The conservative entry waits for price to pull back to the broken level and get rejected. In the example, the rejection candle closes at 1.0790. Bulkowski’s page puts the pullback rate at 58% for downward breakouts, so in roughly four trades out of ten the retest never comes and you watch the move go without you. Choose which regret you can live with.
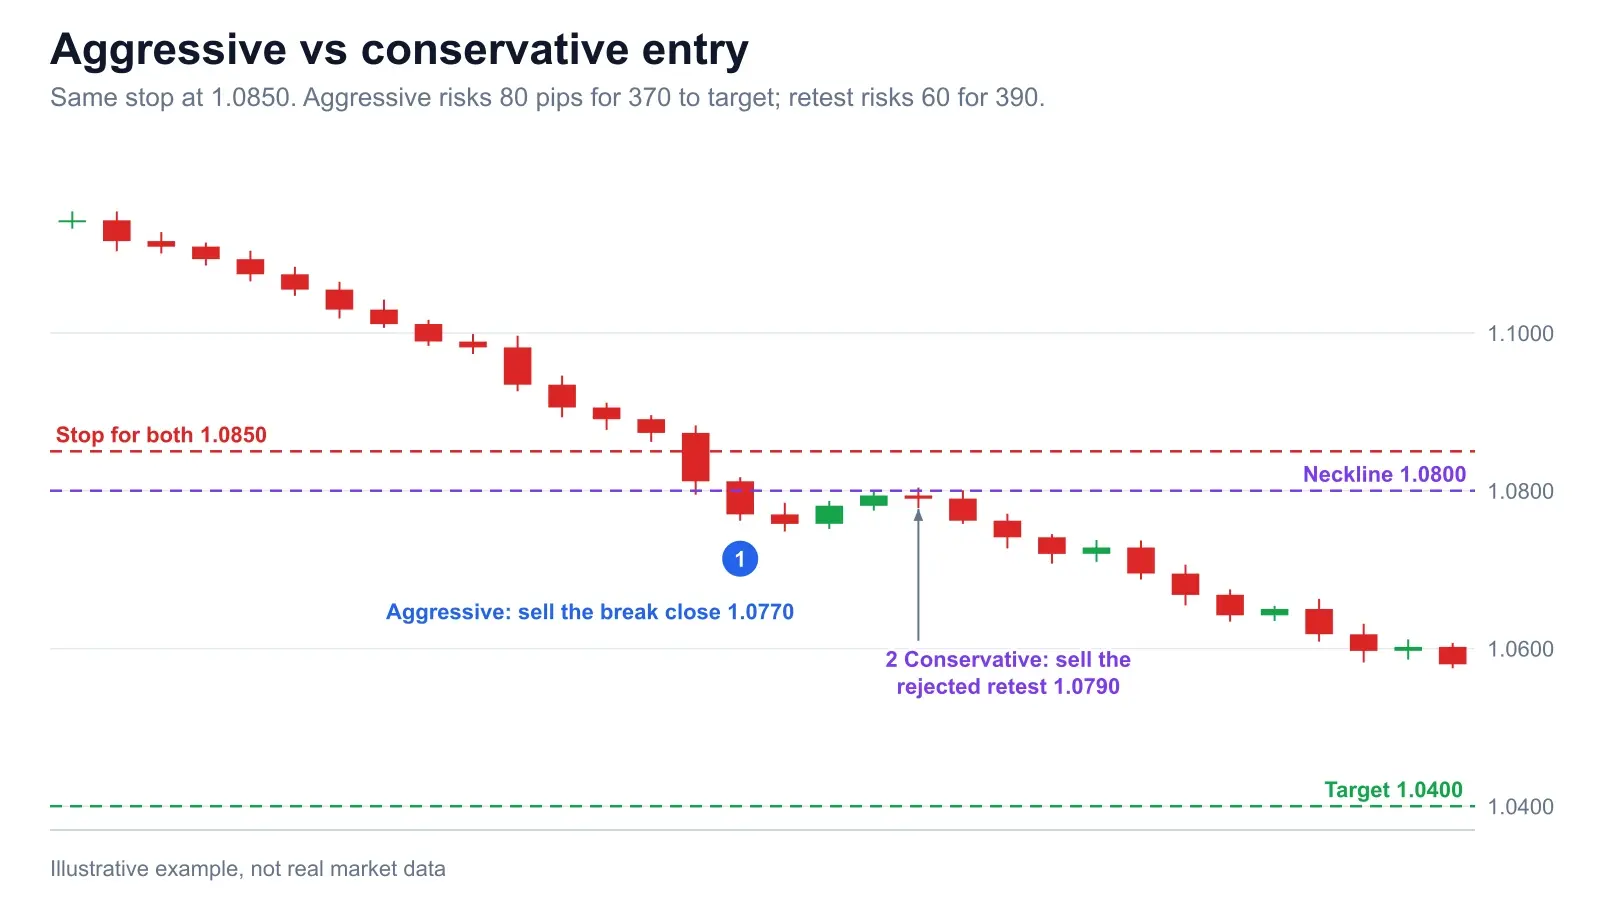
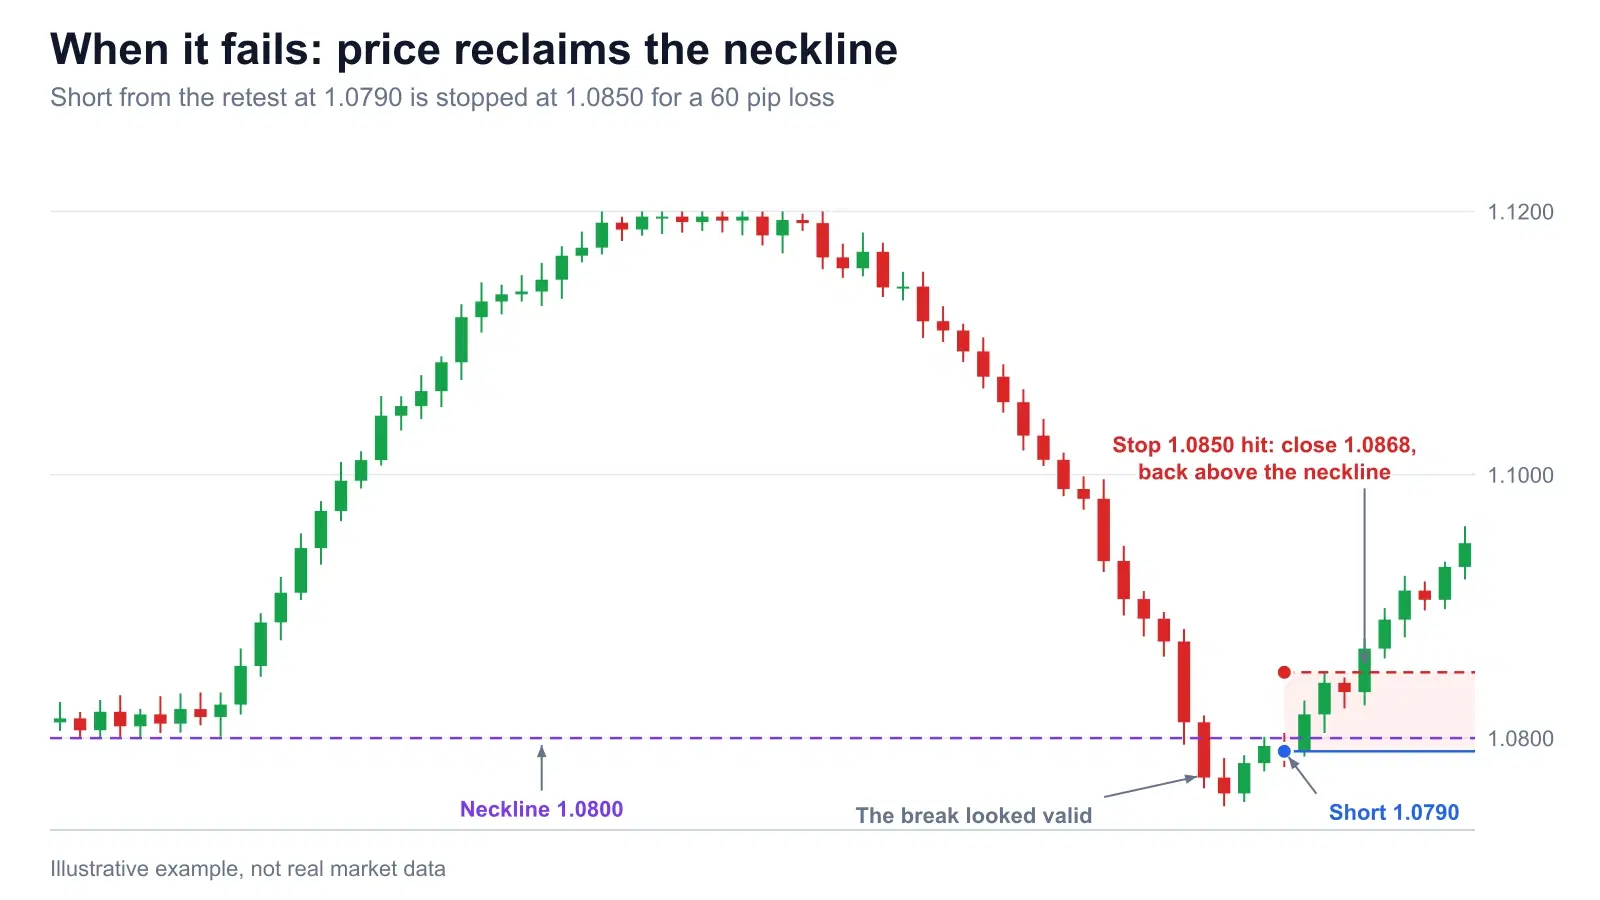
Stop placement. The stop goes above the neckline and above the retest high, because a close back above the base level means the pattern has failed. Here the retest high is 1.0804, and the stop is at 1.0850, 50 pips above the neckline. A stop at 1.0815 would flatter the reward-to-risk, but ordinary noise around the neckline would take it out. A stop that fits the structure, with a smaller position, beats a tight stop with a big one. Our stop-loss placement guide covers the options.
The maths. On a $10,000 account risking 1%, the budget is $100. At a standard lot of EUR/USD, a pip is worth about $10. The retest short risks 60 pips: $100 ÷ (60 × $10) = 0.167 lots, so use 0.16 lots, which risks $96. The full target is 390 pips, 0.16 × 390 × $10 = $624, or 6.5R (390 ÷ 60). The aggressive entry risks 80 pips, so the same $96 gets 0.12 lots, and the 370 pip target pays $444, 4.6R. The half-way level at 1.0600 is 190 pips from the retest entry, 3.2R, worth $304 on 0.16 lots. That is a sensible place to take profit on half, because the full target is optimistic. More on this in our risk-reward examples.
A caution on that target. Bulkowski’s own rule scales the height by a success rate before using it, and his figure for downward rounding top breakouts meeting the price target is just 14%. The average decline in his data was 17%. Plan to be paid for part of the move, not all of it, and treat 6.5R as the best case rather than the forecast. Finally, log the trade in your trading journal with the pattern, the entry type and the result, because after twenty trades you will know whether your version of this pattern pays.
7. Where it fails
Start with the structural problems. It is slow: weeks to months on a daily chart, so capital sits waiting. It is subjective: two traders can look at the same dome and disagree on where it starts, and a smooth arc on one timeframe looks jagged on another. It is easy to see in hindsight: every rounding top looks perfect after the decline, and nobody counts the ones that kept climbing. And it has no clean level until the break. A head and shoulders gives you a neckline mid-pattern, but here the level is only meaningful if the base was real.
Then the failure mode. In the chart below, price breaks, retests 1.0790 and gets rejected, so the short triggers. Four candles later, price closes at 1.0868, back above the neckline and through the 1.0850 stop. The loss is 60 pips, $96 on 0.16 lots, which is exactly the 1% you planned for. That is the stop doing its job. Bulkowski notes that pullbacks hurt post-breakout performance, and a reclaim of the neckline is the extreme version. If price closes back above it after the break, exit and reassess.
8. Rounding top vs rounding bottom
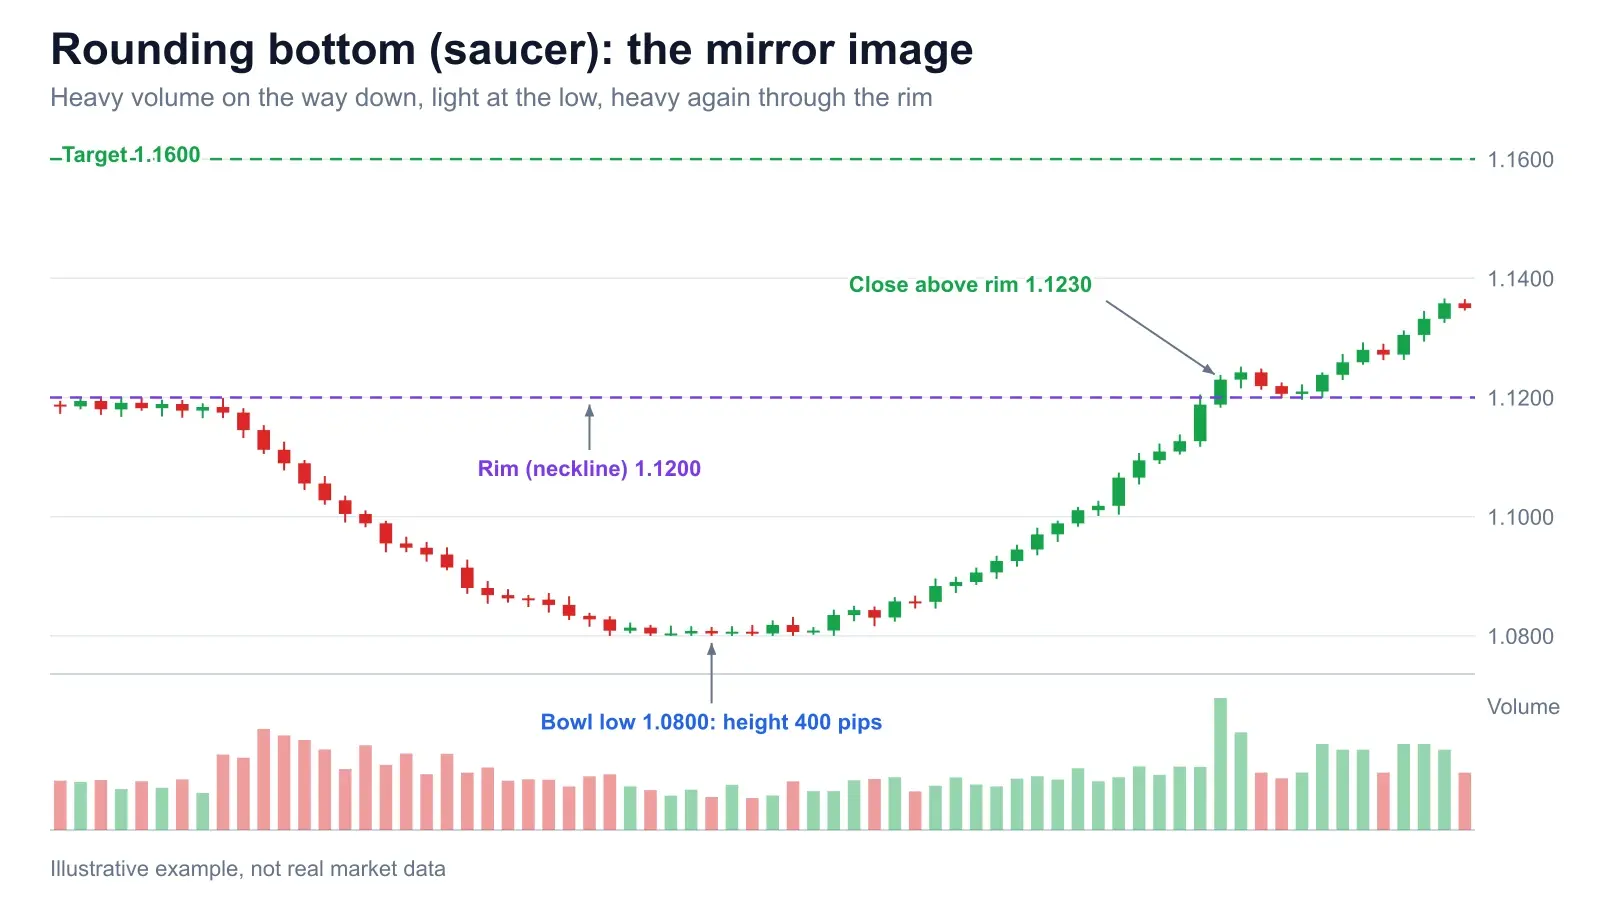
The rounding bottom, or saucer, is the mirror image. It forms after a decline: price slides in a gradual bowl, bottoms out on thin volume, then curls up at about the pace it fell. The trigger is a close above the rim at the start of the bowl. In the chart below, the rim is 1.1200, the low is 1.0800, the height is 400 pips, and the target is 1.1200 + 0.0400 = 1.1600. The mirrored volume pattern is the same: heavy on the way down, light at the low, heavy again through the rim.
Bulkowski’s rounding bottom page is more encouraging than the top. It lists a 4% break-even failure rate, a 48% average rise and 65% of patterns meeting the price target, in bull markets, over 990 perfect trades. It also notes that price trends upward into the pattern 67% of the time, so it usually acts as a continuation pattern, and he confirms the breakout with a close above the left peak. The asymmetry is worth remembering: the bottom is usually the better-behaved shape.
Frequently asked questions
What is a rounding top pattern?
A rounding top, also called an inverted saucer, is a bearish reversal pattern where price rises in a gradual arc, stalls at a rounded peak, then declines at about the pace it rose. It is confirmed by a close below the neckline, a flat level drawn at the base of the arc. On a daily chart it usually takes weeks to months to form.
Is a rounding top bullish or bearish?
It is read as bearish, because it forms after an uptrend and signals buying pressure fading. But it is not reliable on its own: Bulkowski’s statistics list results for both upward and downward breakouts, and Capital.com warns that many arcs that look like rounding tops resolve as continuations. Wait for the neckline close.
How do you trade a rounding top?
Draw a flat neckline at the base of the arc and wait for a candle to close below it. Sell the close (aggressive) or wait for a retest of the broken level that gets rejected (conservative). Put the stop above the neckline and the retest high, and project the height of the arc down from the neckline as the target. Size the trade so the stop costs 1% of the account or less.
How is a rounding top different from a head and shoulders?
A head and shoulders has three distinct peaks and a neckline through the two shoulder lows, so the level exists before the break. A rounding top is one smooth arc with no obvious pivot highs, and its neckline is a base level the advance launched from. That makes it slower to form, more subjective to draw and usually later to confirm.
What is the difference between a rounding top and a rounding bottom?
They are mirror images. A rounding top (inverted saucer) forms after an advance and points down; a rounding bottom (saucer) forms after a decline and points up. The top is confirmed by a close below the base level, the bottom by a close above the rim at the start of the bowl. The volume story mirrors too: light at the turn, heavier on the break.
How reliable is the rounding top pattern?
Less than its clean textbook picture suggests. On Bulkowski’s Pattern Site, only 14% of downward breakouts from rounding tops met the price target, and 20% failed by a break-even measure (bull-market results, updated 2020, over 950 perfect trades). Treat the measured move as a ceiling, size small, and use the stop.
Sources & further reading
- → Bulkowski: Rounding Top (The Pattern Site): identification guidelines, the 14% and 58% figures, 17% average decline, 20% break-even failure rate.
- → Bulkowski: Rounding Bottom (The Pattern Site): the saucer statistics and the close-above-the-left-peak breakout rule.
- → Capital.com: Rounding Top Pattern: neckline, volume, entry and stop conventions, and the warning about continuations.
Bulkowski’s figures were last updated in 2020 and come from his own sample of perfect trades. The worked example in this article is our own illustration on hypothetical prices, not market data or advice. Trading leveraged products carries a risk of loss.
Does your chart really show a rounding top?
Upload a screenshot to the Chart Snipe tool and compare its read of the structure and key levels with the neckline you drew. Then log the trade, so you can see over time whether you are reading this pattern or just seeing it.