
How AI Sets a Daily Forex Bias
A bias is not a signal. It is the answer to one question — which side of this pair has the wind behind it today. Here is the order a macro-aware trader builds it in, how an AI pipeline runs the same steps every night, and the three things it genuinely cannot do.
Most traders who say they “have a bias” on EUR/USD mean they looked at a daily chart, saw it was going up, and decided they preferred longs. That is not a bias. That is trend-following with extra vocabulary, and it will hand you the exact wrong lean on the mornings that matter — the ones where a rate repricing has already started and price has not caught up yet.
A real daily bias is a directional lean built from things that exist outside the chart, then checked against the chart. It answers a narrow, useful question: if a clean long setup and a clean short setup both print on this pair today, which one am I willing to take? Nothing more. It says nothing about entry, nothing about stop placement, and nothing about size.
This piece walks the construction order that macro-aware discretionary traders actually use, in the sequence they use it. Then it shows how an AI pipeline runs the same sequence — faster, and more importantly, the same way every single day. And then the honest part: the three things no AI bias engine can do, no matter how good the model gets.
Key Takeaways
- →A bias is a filter that deletes half your watchlist. It is not permission to market-order.
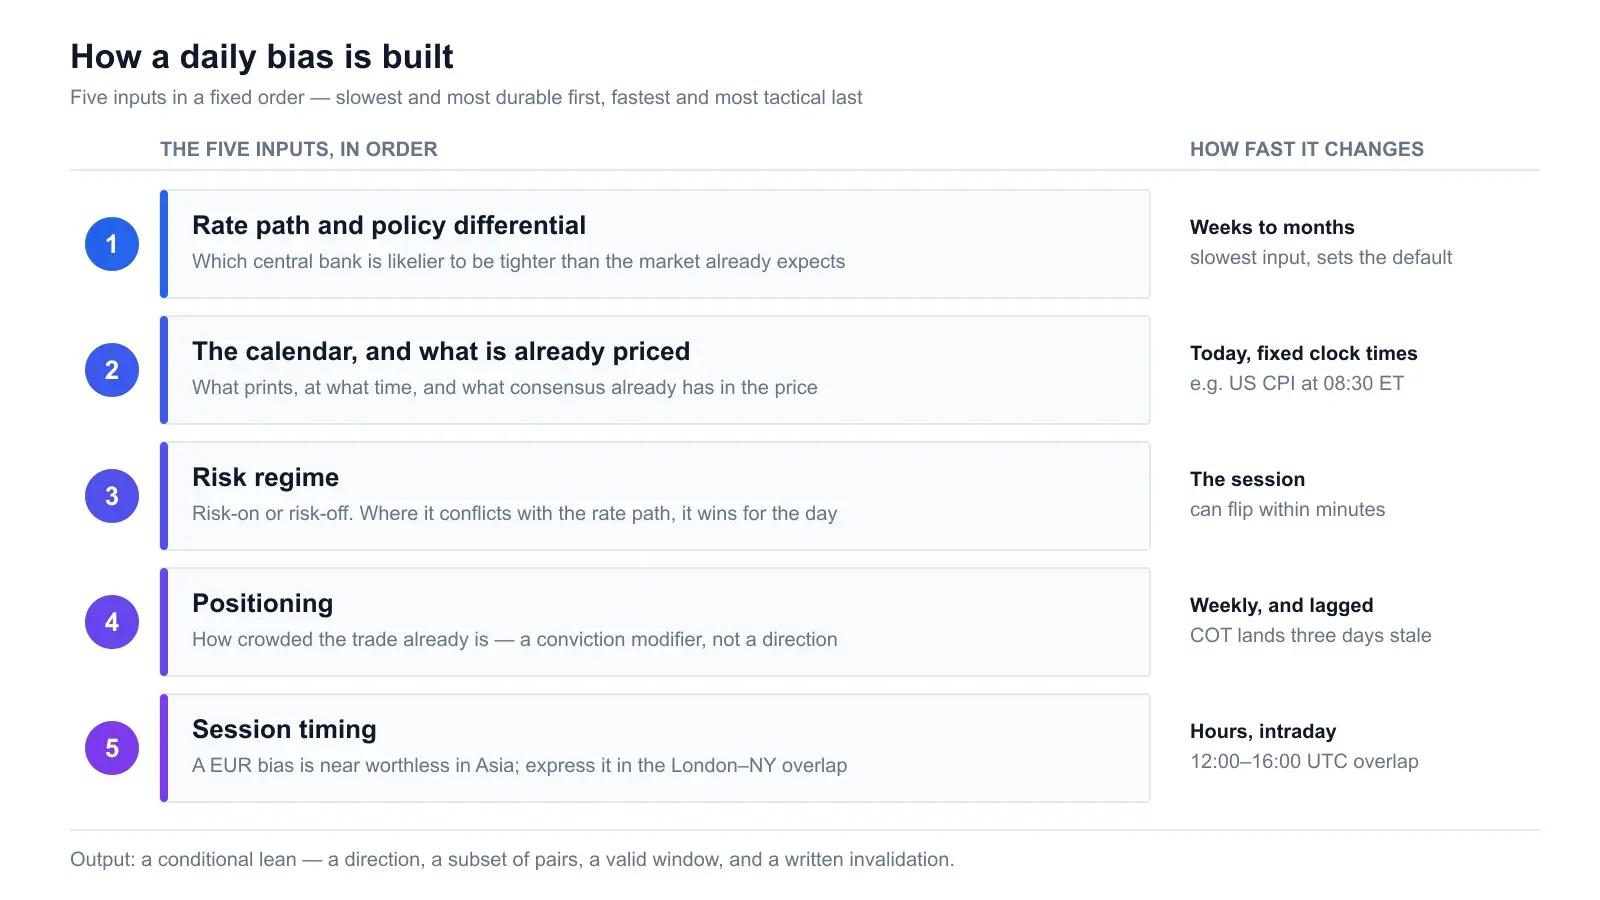
- →Build it in order: rate path, then calendar and what is priced, then risk regime, then positioning, then session timing.
- →Risk regime overrides rate differentials on the day. In a real risk-off flush, correlation goes to one and the best carry story still gets sold.
- →The number that moves price is the gap between the print and consensus, not the print itself.
- →AI’s real edge here is consistency and coverage, not cleverness. It runs the same checklist across every major every night without getting bored.
- →Three hard limits: it cannot see real positioning, it cannot price a surprise before it lands, and it does not know your account.
- →Write the invalidation down before the session. A bias you never let yourself be wrong about is a belief, not an analysis.
1. What a daily bias actually is
A daily bias is a conditional lean. Read as a sentence: “Today I am willing to be short USD against the commodity bloc, if and only if a setup appears that I would have taken anyway.” Every part of that sentence is doing work. It names a direction. It names a subset of pairs. It attaches a condition. And it has an expiry — the end of the session.
Compare that to how most people use the word: “I’m bullish gold.” Bullish over what horizon? Above or below which level? Bullish enough to buy a breakout, or only enough to buy a pullback to support? Bullish even if the Fed minutes come out hawkish at 19:00 UTC? None of that is specified, which means the “bias” is really just a mood, and moods do not survive contact with a red candle.
The test that separates the two: a proper bias can be wrong without you losing money, and it can be right on a day you lose money. If your bias was USD-negative and no clean setup appeared, you did nothing and you were still right. If your bias was USD-negative, a setup appeared, and it stopped out, the bias may still have been correct — the setup was the thing that failed. Traders who cannot separate those two never learn anything from either.
Where a bias comes from
Currencies are relative instruments. You are never trading “the euro”; you are trading the euro against something, which means every bias is a comparison of two economies and two central banks. That is why chart-only bias fails so often — a EUR/USD daily chart shows you the net of two stories and hides which one is actually driving.
The five inputs below are ordered deliberately. Rate path is slowest-moving and most durable, so it goes first and sets the default. Session timing is fastest and most tactical, so it goes last and only adjusts execution. Working in this order stops the most common failure mode, which is letting the loudest headline of the morning drive everything.
2. Step 1 — The rate path and policy differential
This is the anchor, and it is the input most retail traders skip entirely because it is not on a chart.
Capital moves toward yield, adjusted for risk. If one central bank is expected to hold rates while another is expected to cut three times over the next year, money leaves the cutter. But note the word expected. The current rate differential is almost irrelevant — it is already in the price, and has been for months. What moves currencies is a change in the expected path.
This is why a central bank can cut rates and the currency rallies. If the market had priced a 50 basis point cut and the bank delivered 25 with a statement that sounded reluctant, the expected path just got shallower, and the currency reprices upward even though rates went down. The headline says “rate cut”. The market read the second paragraph of the statement.
What to actually read
- The statement, not the headline. Central banks change one or two words between meetings on purpose. “Inflation remains elevated” becoming “inflation has moderated” is a policy signal dressed as grammar. The FOMC calendar and statements are published free and in full.
- The dot plot and projections, where they exist. The Fed’s Summary of Economic Projections is the clearest published statement of where a committee thinks rates go.
- Speeches between meetings. Individual policymakers move markets on quiet days, particularly when one dissents from the consensus line.
- Market-implied pricing. What the rates market thinks is more useful than what any analyst thinks, because it is what people have money on.
Do this for both legs of the pair and you have a default lean that will hold for weeks at a time. It is deliberately slow. If your rate-path view is changing daily, you are not reading policy, you are reading news.
The ECB Governing Council press conference of 23 July 2026, published in full by the European Central Bank. This is the other leg of EUR/USD — and as with the Fed, the Q&A is usually where the path guidance actually shifts, not the prepared statement.
3. Step 2 — The calendar, and what is already priced
The rate path gives you a default. The calendar tells you whether today is a day that can change it.
Three things to note for every release: what it is, what time it lands, and what number is expected. That third one is the one people skip, and it is the whole game. Markets trade expectations. A US CPI print of 0.3% month-on-month is a hawkish shock if consensus was 0.1% and a non-event if consensus was 0.3%. The same number, two completely different sessions.
Consensus figures sit next to every event on the Forex Factory calendar and in more depth on Trading Economics, which also carries the historical series so you can see whether a print is a genuine break or noise inside a range. For US labour and inflation data, the primary source is the Bureau of Labor Statistics, which publishes the release schedule a year ahead. We cover the mechanics in more detail in our guide to reading an economic calendar.
The events that actually reprice a path
| Event | Why it changes a bias | Bias horizon |
|---|---|---|
| Rate decision + statement | Directly resets the path. The statement language matters more than the number. | Weeks |
| CPI / core inflation | The single input that most reliably moves rate expectations. Core matters more than headline. | Days to weeks |
| Employment (NFP, claims) | Second half of a dual mandate. Big misses move the path; in-line prints rarely do. | Days |
| Central bank speeches | Move markets between meetings, especially dissents and unscheduled remarks. | Hours to days |
| PMIs, retail sales | Growth colour. Rarely reprice a path alone, but they build a case over months. | Intraday |
| Geopolitical shocks | Unscheduled, and they override everything above for as long as they last. | Unpredictable |
One practical rule that costs nothing: if a tier-one release for either currency lands during your trading window, your bias is provisional until it prints. Not cancelled — provisional. You can still trade the pre-release drift if that is your thing, but the bias itself is not settled until the number is out and the first ten minutes of noise have passed. Our breakdown of high-impact news events goes through which releases justify that treatment and which do not.
4. Step 3 — The risk regime
Rate differentials tell you where money wants to go over months. Risk regime tells you whether it is willing to move today.
In a risk-on session, capital moves out along the risk curve: equity indices bid, credit spreads tight, commodity currencies (AUD, NZD, CAD) firm, funding and haven currencies (JPY, CHF) soft. In risk-off, it reverses and it reverses hard. The important property is that risk-off is not symmetric with risk-on — it is faster, more correlated, and far less interested in your fundamental view.
The override rule. When risk regime and rate differential point the same way, that is your highest-conviction day and it does not come often. When they conflict, the risk regime wins for the session and the rate story wins over the following weeks. A currency with a genuinely hawkish central bank will still get sold in a real flush, because in those hours everything trades as a proxy for the same fear and correlations converge on one.
How to read the regime in ninety seconds
You do not need a terminal. Four glances:
- An equity index overnight. S&P 500 and US Tech 100 futures tell you what the money that has already been awake thinks.
- Gold. Rising with a soft dollar is one story; rising with a firm dollar is a different and more serious one — that is fear, not just rate expectations.
- AUD/JPY or NZD/JPY. The cleanest single-pair risk thermometer in FX. High-beta commodity currency against the classic funding currency.
- The dollar itself. The dollar has two personalities: it strengthens on hawkish policy, and it also strengthens on panic. Knowing which one is driving changes every cross you take.
That last point catches people constantly. A rising dollar in a calm session and a rising dollar in a scared session imply opposite trades in EUR/JPY, gold and the commodity bloc, and the DXY chart looks identical in both.
5. Step 4 — Positioning
Positioning is the answer to: how many people already own this trade?
It matters because a crowded trade has asymmetric risk. If everyone is already long a currency on a hawkish central bank view, a merely-in-line hawkish statement produces nothing — there is nobody left to buy — while a mildly dovish word triggers a stampede for the exit. This is the mechanism behind “good news, currency falls,” which otherwise looks like the market being irrational.
Be honest about what you can see here. Retail traders cannot observe real positioning. What you can observe are proxies, and every one of them is lagged, partial, or both:
CFTC Commitments of Traders
Weekly, published Friday for the prior Tuesday. Genuinely useful for extremes — a record speculative long is worth knowing about — and useless for anything intraday. It is three days stale on arrival.
Retail sentiment feeds
Broker-published long/short percentages. They cover one broker’s book, not the market, and retail is a rounding error against real FX volume. Occasionally interesting at extremes; never a primary input.
Price behaviour after news
The most honest proxy available. A currency that fails to rally on a genuinely strong number is telling you the trade was already full. This reads positioning from the outcome rather than from a report, which means it is never early — but it is never wrong either.
Treat positioning as a conviction modifier, not a direction. It rarely flips a bias. What it does is tell you to size down and expect a chop when the trade is crowded, and to expect follow-through when it is not.
6. Step 5 — Session timing
A correct bias expressed in the wrong session is a losing trade with a good explanation attached.
A EUR-negative view is close to worthless during the Asia session. Not because it is wrong, but because the participants who would act on it are asleep, liquidity in EUR crosses is thin, and price drifts in ranges that will be erased in the first twenty minutes of the London open. The same bias, expressed at 08:00 UTC, has a market to move it.
Practical mapping, and it is not complicated:
- Asia (roughly 00:00–08:00 UTC). JPY, AUD, NZD and China-sensitive flow. This is where an AUD or JPY bias earns its keep.
- London (07:00–16:00 UTC). The largest FX volume window. EUR, GBP and CHF views belong here, and the first hour routinely sets the day’s range.
- London–New York overlap (12:00–16:00 UTC). The deepest liquidity of the day and where most US data lands. Highest conviction, and also the widest whipsaws.
- New York afternoon (after 19:00 UTC). Liquidity thins, trends often stall, and holding into the close is a different decision from holding through the overlap.
Our full breakdown of session times and when each pair actually moves covers the volatility profiles pair by pair. The short version for bias purposes: decide when your bias is allowed to be expressed at the same time you decide what it is.
7. A worked example, start to finish
Abstract steps are easy to nod along to. Here is the same five-step order run on a hypothetical Wednesday, with the reasoning written out the way it should look in a journal.
Step 1 — Rate path. The Fed has been on hold for two meetings, with the last statement softening its inflation language. Market pricing has pulled the first cut forward. The ECB has publicly acknowledged upside inflation risk. Net: EUR-positive default lean against USD, and it has been for a few weeks.
Step 2 — Calendar. US CPI at 13:30 UTC, core expected +0.2% m/m. FOMC minutes at 19:00 UTC. Two path-relevant events on the same day, which means the bias is provisional until 13:30 and could be re-cut at 19:00. Anything before 13:30 is positioning noise.
Step 3 — Risk regime. Equity futures modestly higher overnight, gold flat, AUD/JPY firm. Mild risk-on. It does not conflict with the EUR-positive lean, so it neither strengthens nor overrides it. A neutral regime is a real reading, not a missing one.
Step 4 — Positioning. EUR longs have been building for three weeks and last week’s COT showed the largest net long in months. Crowded. Conviction modifier: size down, and expect an in-line CPI to produce a fade rather than a continuation, because the buyers are already in.
Step 5 — Session. Express in the London–New York overlap, after the CPI print and after the first ten minutes of noise. Nothing before 13:40 UTC.
Resulting bias: mildly EUR-positive against USD, reduced size because the trade is crowded, valid only after 13:40 UTC, invalidated by a core CPI print at or above +0.4% m/m or by hawkish dissent surfacing in the minutes. That is a bias you can act on and, more importantly, one you can grade afterwards.
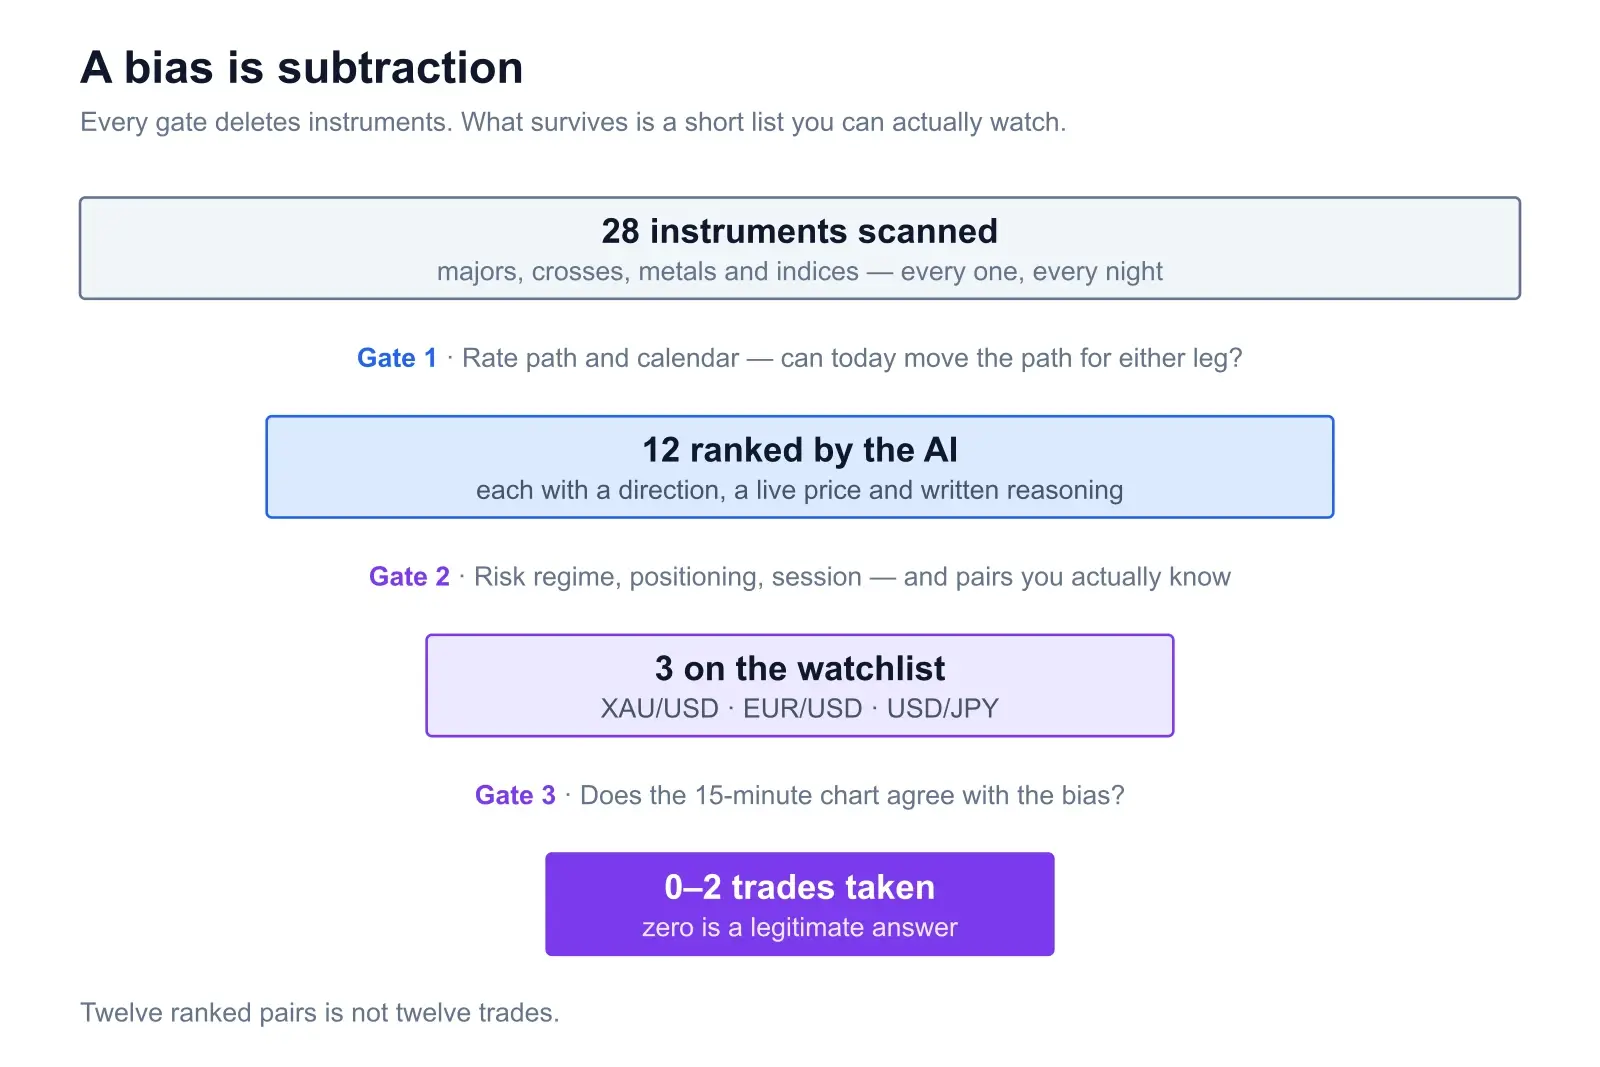
Notice how much of the work is subtraction. Five steps and most of the trading day has been ruled out. That is the point.
8. How an AI pipeline runs the same order
Nothing in section 7 is intellectually difficult. It is just tedious, and it has to be done again tomorrow, and again the day after, for every pair you might trade. That is precisely the shape of problem language models are good at.
ChartSnipe’s published methodology is a single sentence: “Our AI scans and synthesizes global financial news, official statements, central bank speeches, and economic calendar events to identify the highest-impact factors moving markets.” That maps onto steps 1 through 3 almost exactly — statements and speeches are the rate path, calendar events are step 2, and the news flow is where the risk regime shows up.
What the ranked output looks like
The News Impact analysis ends up at 12 ranked pairs, each with a bullish or bearish call, the live price and the daily percentage change. Below that sits the “How AI Would Trade Today” write-up, which is where the reasoning lives.
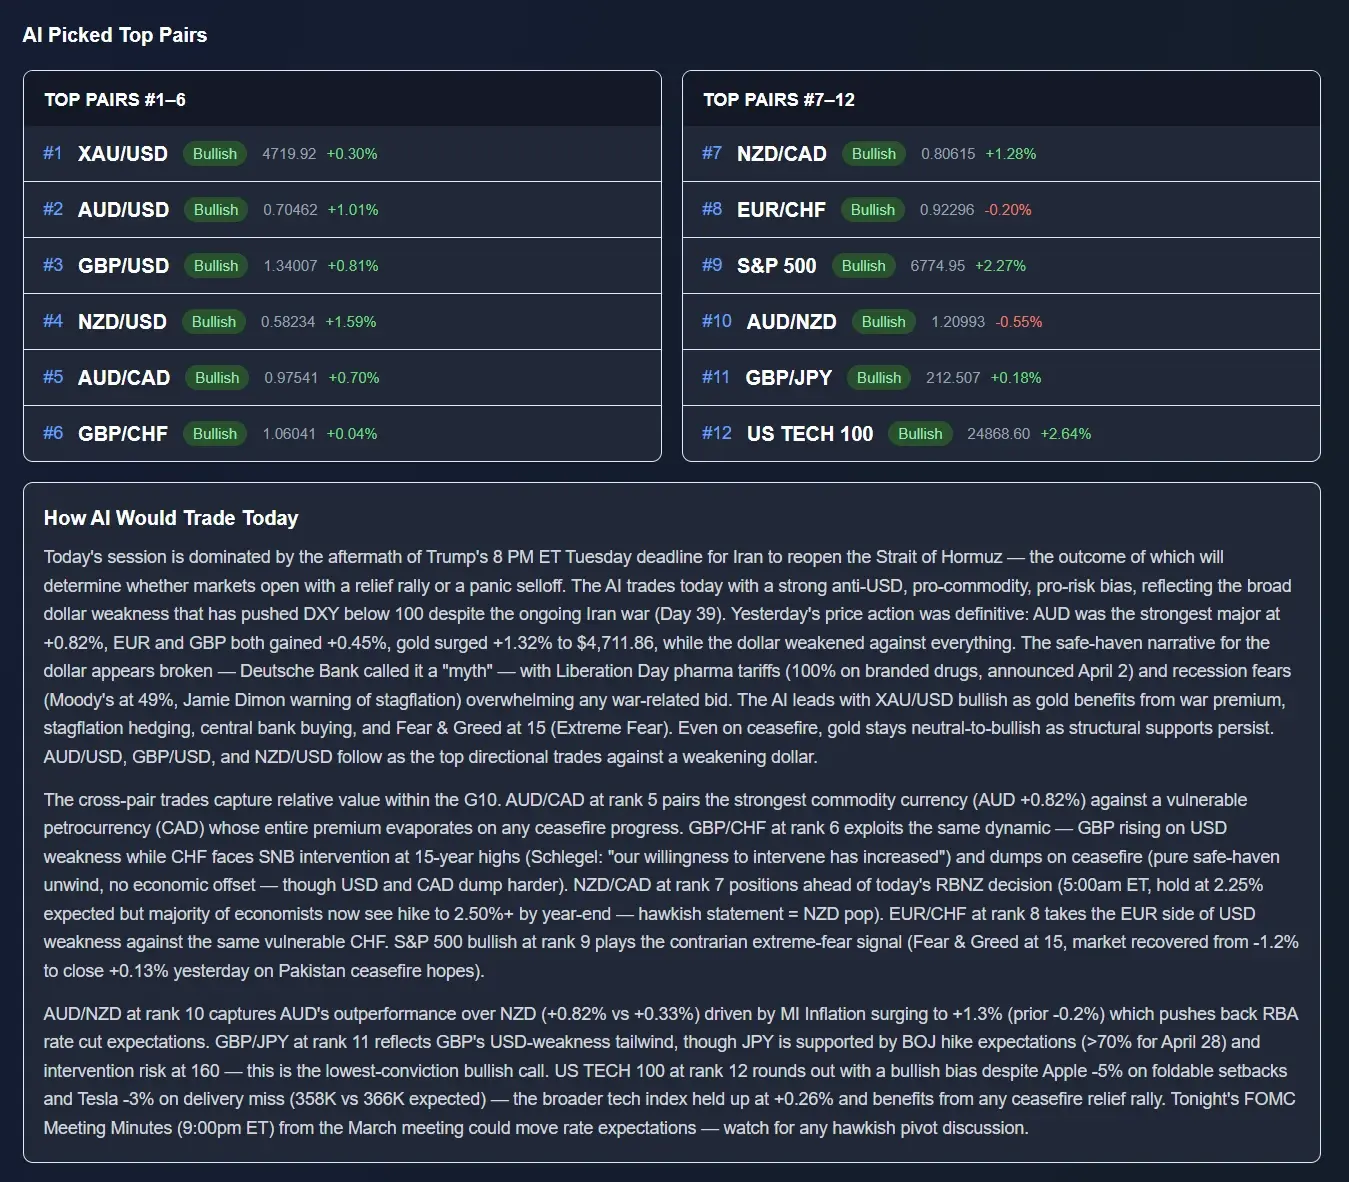
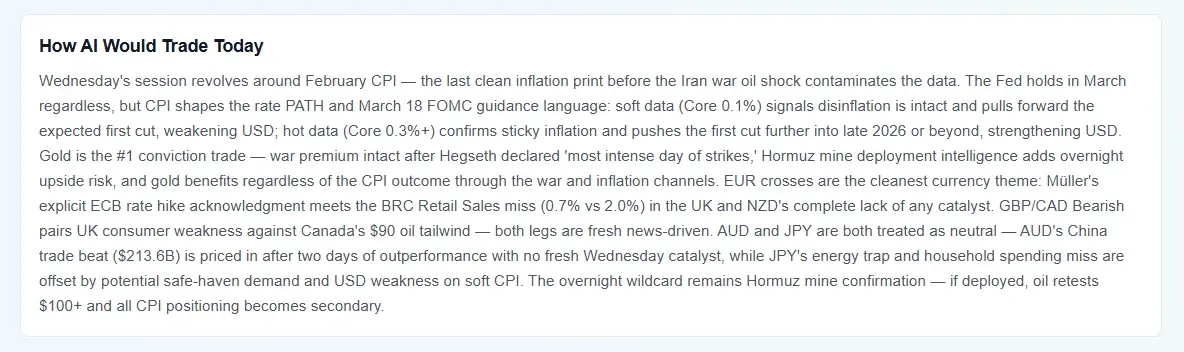
The write-up is the part worth reading, and it is worth being specific about why. A green arrow next to a pair name is unfalsifiable. A paragraph that says which print at what time is expected to do what to the rate path is something you can disagree with — and disagreeing with a stated thesis is how you actually learn a market.
Per-currency cards, and the strength index
Pair rankings hide which leg is driving. That is what the currency and instrument cards are for: 12 cards, each with a bias, a ranking placement and written reasoning. For currencies the card carries the ChartSnipe Strength Index — the average daily change across all seven major pairs that currency trades against, sign-inverted where the currency is the quote — so you can see whether EUR is genuinely bid or merely less unloved than USD. For GOLD, S&P 500, US TECH 100 and BTC the card shows the live price and daily change directly.
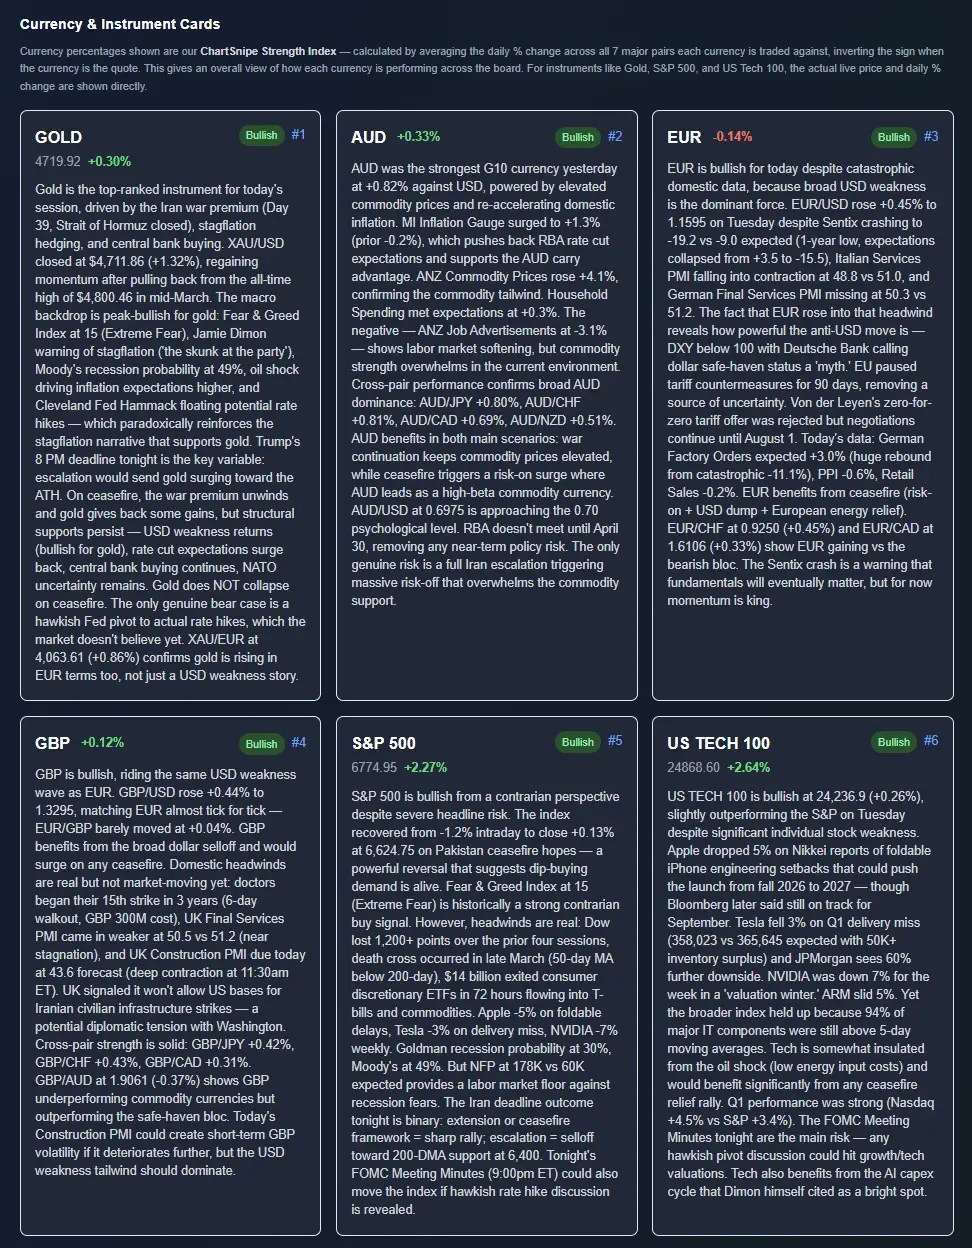
Timing matters as much as content. The analysis publishes Monday to Friday between 20:00 and 23:00 UTC for the upcoming trading day — before the Asia open, not after the fact. There is no weekend edition, because there is no weekend session to have a bias about. It is an in-app page rather than an emailed newsletter, and the full analysis sits on the Pro and Premium plans; free accounts see an admin-featured past-day preview so you can judge the format before paying for it.
9. Three things AI cannot do
Every product page in this category is happy to tell you what its model sees. Here is what none of them can see, ours included.
1. It cannot know real positioning
Nobody publishes where the market’s money actually is. The interbank book is private, options exposure is scattered across venues, and real-money flow is invisible by design. An AI reading COT data is reading the same three-day-old, partial snapshot you are. It can be more diligent about it than you will be, but diligence does not manufacture data that does not exist. When a bias engine is confident and the market does the opposite for no visible reason, unseen positioning is usually the answer, and it will be the answer after the fact rather than before.
2. It cannot price a surprise before it lands
No model knows what a central banker will say in an unscheduled speech, or that a tanker will be seized at 03:00. This is not a shortcoming to be engineered away; it is the definition of a surprise. What a good pipeline can do is enumerate the scenarios and pre-compute the reaction, so that when one fires you are reading a plan rather than improvising.
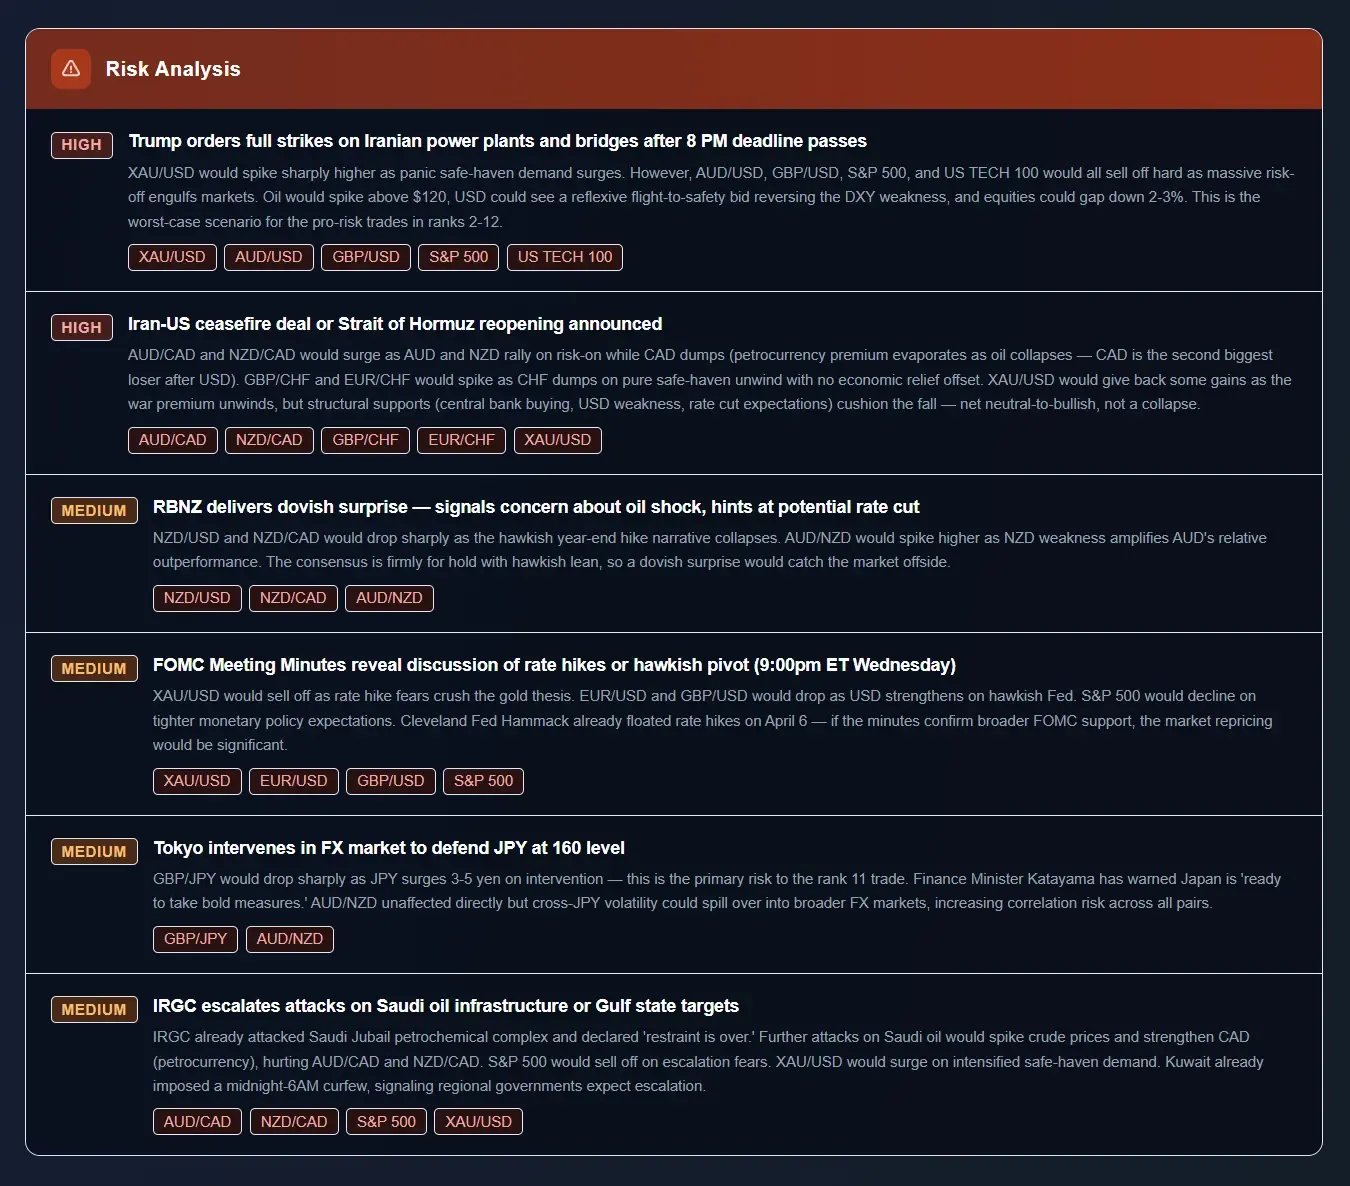
That distinction is worth holding onto. A scenario list is not a forecast. It is the answer to “if this happens, what breaks?” written down while you are calm, which is the only time it can usefully be written down.
3. It does not know your account
A bias engine has no idea whether you are trading a $500 account or a $200,000 one, whether you are inside a prop firm drawdown limit, whether you already hold three correlated dollar-short positions, or whether you can sit at a screen at 13:30 UTC. Those constraints determine which of twelve ranked ideas you can actually take — often the answer is zero, and zero is a legitimate answer. Every one of those calls is yours, and no research output substitutes for it.
What this adds up to. AI’s contribution to bias-setting is coverage and consistency, not insight. It reads more sources than you will, applies the same order every day, and does not get bored on Thursday. That is genuinely valuable, because most bias failures are process failures — the day you skipped the calendar check, the morning you let one headline overwrite three weeks of rate-path reasoning. It is not a shortcut past understanding the market, and any tool that markets itself as one is selling something.
10. How to actually use a bias
Here is where most of the damage happens. Someone reads a bullish bias on GBP/USD, opens the platform, and buys at market. They have taken a filter and used it as an entry, which means the trade has a direction and nothing else — no level, no structure, no stop that means anything, no idea what would prove it wrong.
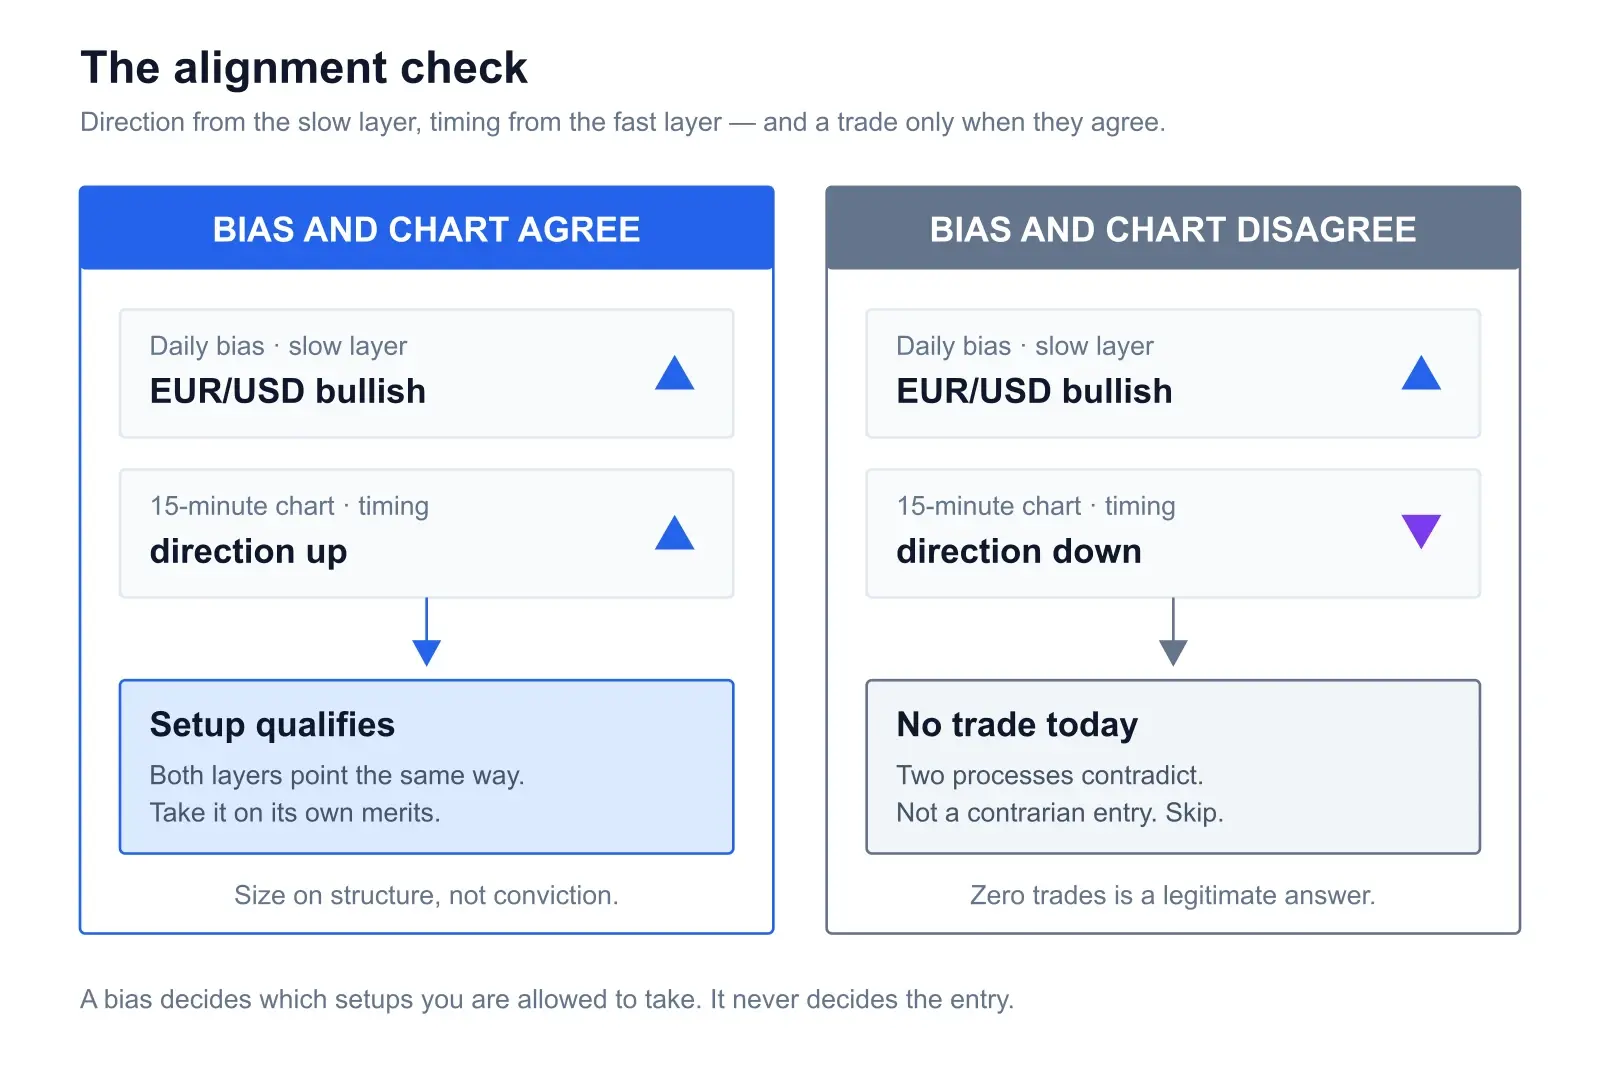
A bias does exactly one job: it decides which setups you are allowed to take. The setup still has to show up on its own.
The alignment check
The practical version we recommend on the News Impact page itself: check your 15-minute chart direction against the analysis bias. When both point the same way, that is the higher-confidence configuration. When they disagree, the honest read is that two independent processes are contradicting each other, and the correct response is to stand down rather than to pick a winner.
This is the same logic as multi-timeframe analysis, with the fundamental bias sitting in the slot the higher timeframe usually occupies. Direction from the slow layer, timing from the fast layer, and a trade only when they agree. If you want a second read on the chart half of that, the Chart Snipe tool takes a screenshot and returns pattern, trend, a probability read and entry and risk guidance — useful specifically because it does not know your bias and therefore cannot be talked into agreeing with it.
A workable sequence
- Read the bias before the session, not during it. Deciding direction while a position is open is not analysis, it is negotiation.
- Cut the watchlist. Twelve ranked pairs is not twelve trades. Take the two or three where the bias is strongest and you know the pair.
- Wait for your own setup. Same criteria you would use with no bias at all. The bias changes nothing about what a valid entry looks like.
- Check alignment. 15-minute direction versus bias direction. Disagreement means skip.
- Size on the trade, not the conviction. A strong bias does not justify a bigger position. Structure and stop distance set size; the bias only decided you were looking.
- Grade the bias separately from the trade. At the end of the week, ask whether the bias was right and whether your execution was right. They are two different scorecards and mixing them teaches you nothing.
11. Writing down the invalidation
The single habit that turns a bias from a mood into an analysis: before the session, write one sentence describing what would make you abandon it.
Good invalidations are specific and external. “Core CPI at or above +0.4% month-on-month.” “A dovish dissent in the minutes.” “S&P futures down more than 1.5% before the London open.” Bad invalidations are vague and internal: “if it looks weak,” “if price breaks structure” — the latter is a trade invalidation, not a bias invalidation, and confusing the two is how people flip their macro view because a 15-minute candle closed badly.
Then hold the line. If none of your written conditions occur, the bias stands even on a day it loses money. A view that survives a losing session is doing its job; a view that changes every time price moves against you is not a view.
If you are still building the fundamental foundation for any of this, BabyPips’ fundamental analysis course is the least painful free introduction to why rate expectations drive currencies, and it costs nothing.
Frequently asked questions
What is a daily bias in forex?
A directional lean for one session — a statement that on balance one side of a pair has more behind it than the other today. It is not a prediction and not an entry. It answers “if a clean long and a clean short both appear on EUR/USD this afternoon, which one do I take seriously?” It is built from the rate path of both currencies, the day’s data and what is already priced into it, the risk regime, positioning, and session timing.
How do I decide my daily bias in forex?
Work in a fixed order. Rate path first: which central bank is more likely to be tighter than expected over the next six months. Then the calendar: what prints today, at what time, and what is already priced. Then the risk regime. Then positioning — how crowded is the trade. Then session timing, because a EUR bias is nearly useless during Asia hours. Finally, check the chart. If daily and 4-hour structure contradict the fundamental lean, size down or skip.
Can AI set a reliable daily forex bias?
It is good at the reading and cross-referencing: pulling statements, speeches, calendar and news flow into one place and applying the same order every day without getting distracted. That consistency is the real benefit, because most bias failures are process failures rather than analysis failures. It cannot know real positioning, cannot price a surprise before it lands, and does not know your account. Treat the output as a research brief, not a verdict.
What is the difference between a daily bias and a trading signal?
A signal says buy here with this stop. A bias says nothing about entry, stop or timing — only which direction you are willing to trade if a setup appears. The practical difference: a bias should never make you market-order. It should make you delete half your watchlist.
What does “already priced in” mean when setting a bias?
Markets trade expectations, not outcomes. If consensus is US CPI at +0.2% m/m and it prints +0.2%, the dollar often does very little — that number was in the price before the release. The move comes from the gap between the print and the expectation, and from how that gap changes the expected rate path. It is why a strong number can be followed by a weaker currency: if the market had positioned for something stronger still, a good print is a relative disappointment.
What is a risk-on versus risk-off day and how does it change a bias?
Risk-on means capital moving toward growth-sensitive assets: indices bid, AUD and NZD firm, JPY and CHF soft. Risk-off is the reverse, and it overrides almost everything else. A currency with the best rate story in the G10 still gets sold in a genuine flush, because correlation goes to one and everything trades as a proxy for the same fear. If the risk regime and your rate-differential lean disagree, the risk regime wins for the day.
What is the best AI tool for a daily forex bias?
Judge them on three things: does it show its reasoning or just a green arrow, does it publish before the session it covers rather than describing yesterday, and does it tell you what would invalidate the call. ChartSnipe’s News Impact analysis is built around those three — 12 ranked pairs, a “How AI Would Trade Today” write-up, per-currency cards with reasoning, and an explicit Risk Analysis scenario list. It publishes Monday to Friday between 20:00 and 23:00 UTC for the upcoming trading day, and the full analysis is on the Pro and Premium plans.
How often should you change your daily bias?
Set it before the session and leave it alone unless something material changes — a policy surprise, a print well outside the expected range, or a geopolitical event. Flipping because price moved 30 pips against you is chasing, not updating. Write the one or two invalidating conditions down in advance; if none of them occur, the bias stands even on a losing day.
Is a daily bias useful for scalpers?
Less than for swing traders, but not useless. On a five-minute chart the fundamental lean will not decide any individual trade. What it does is tell you which direction has cheaper slippage and better follow-through on the day, and which hours to avoid entirely because a tier-one release is landing. Scalpers who ignore the calendar are the ones who get caught in the 13:30 UTC spread blowout.
Sources & further reading
- → Federal Reserve — FOMC meeting calendar, statements and minutes — the primary source for US rate path, published free and in full.
- → Bureau of Labor Statistics — news release schedule — exact release dates and times for CPI and the employment situation report, a year ahead.
- → Trading Economics — economic calendar — consensus forecasts alongside the historical series, which is what tells you whether a print is a real break.
- → Forex Factory — calendar — the retail standard for impact tiering and expected-versus-actual at a glance.
- → BabyPips — fundamental analysis course — the free introduction to why rate expectations move currencies.
Get tomorrow’s bias before the session opens
News Impact runs the same five-step order across 12 instruments every trading day — ranked pairs, a written “How AI Would Trade Today” thesis, per-currency cards with reasoning, and a Risk Analysis list of what would break the day. Published Monday to Friday between 20:00 and 23:00 UTC for the upcoming session. Then align it with your own 15-minute chart before you touch anything.