Bullish Reversal Candlestick Patterns Every Trader Must Know
A complete guide to 12 bullish reversal patterns that signal the end of a downtrend and the start of buying opportunities, with real chart examples and actionable trading strategies.
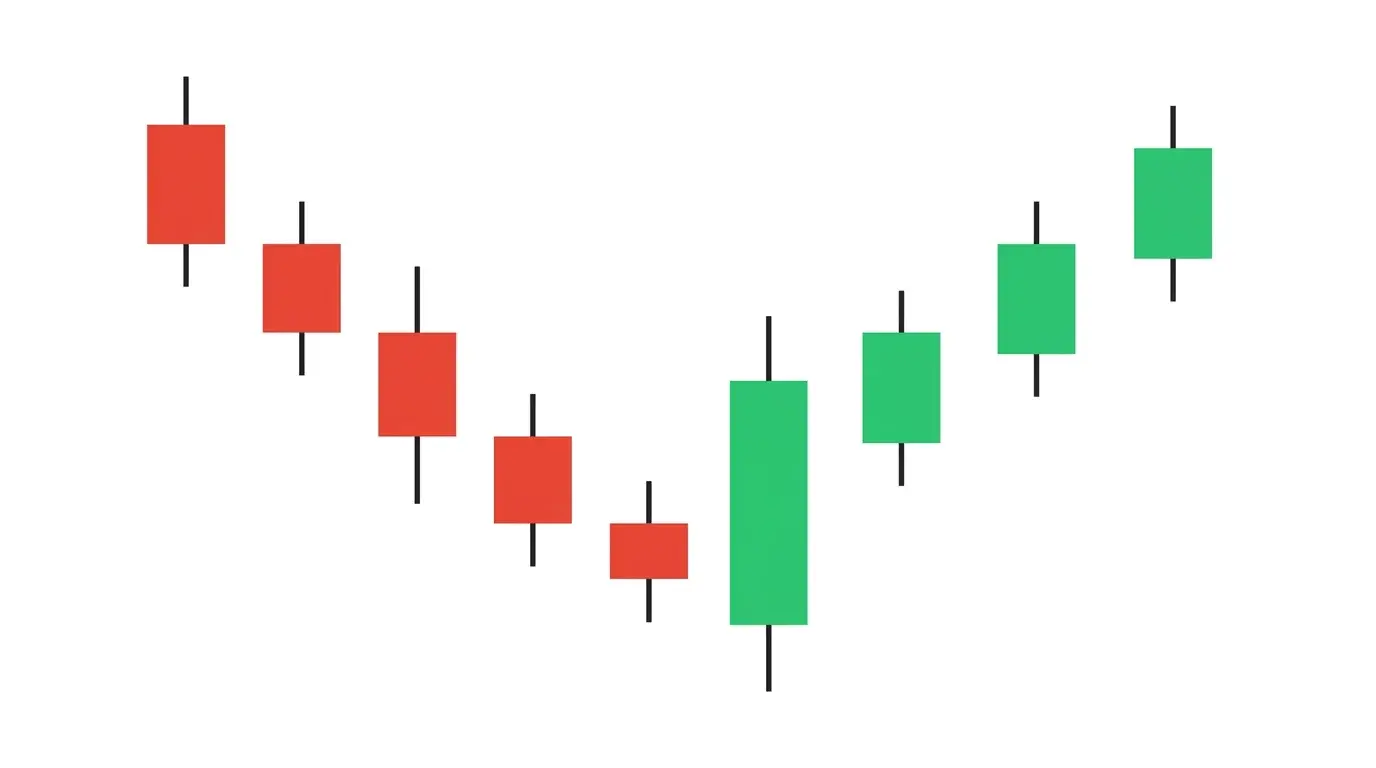
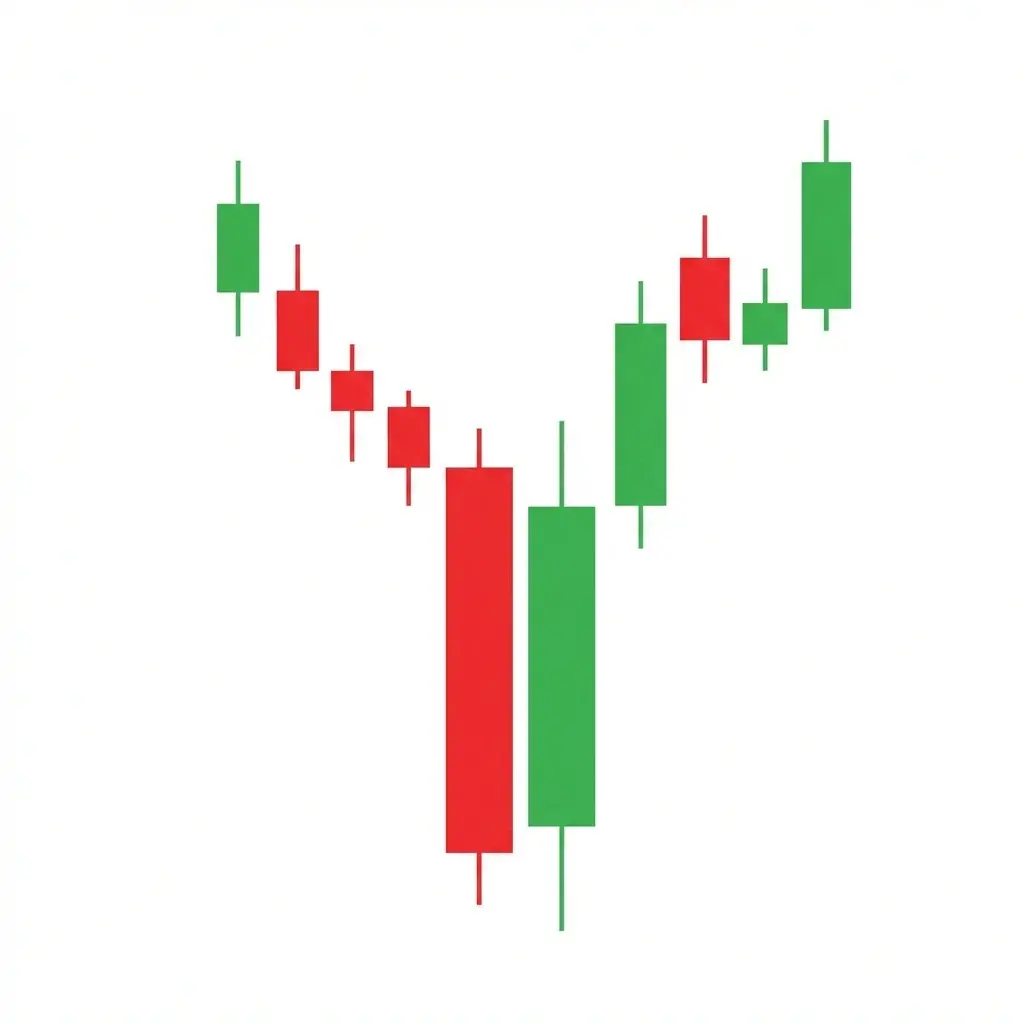
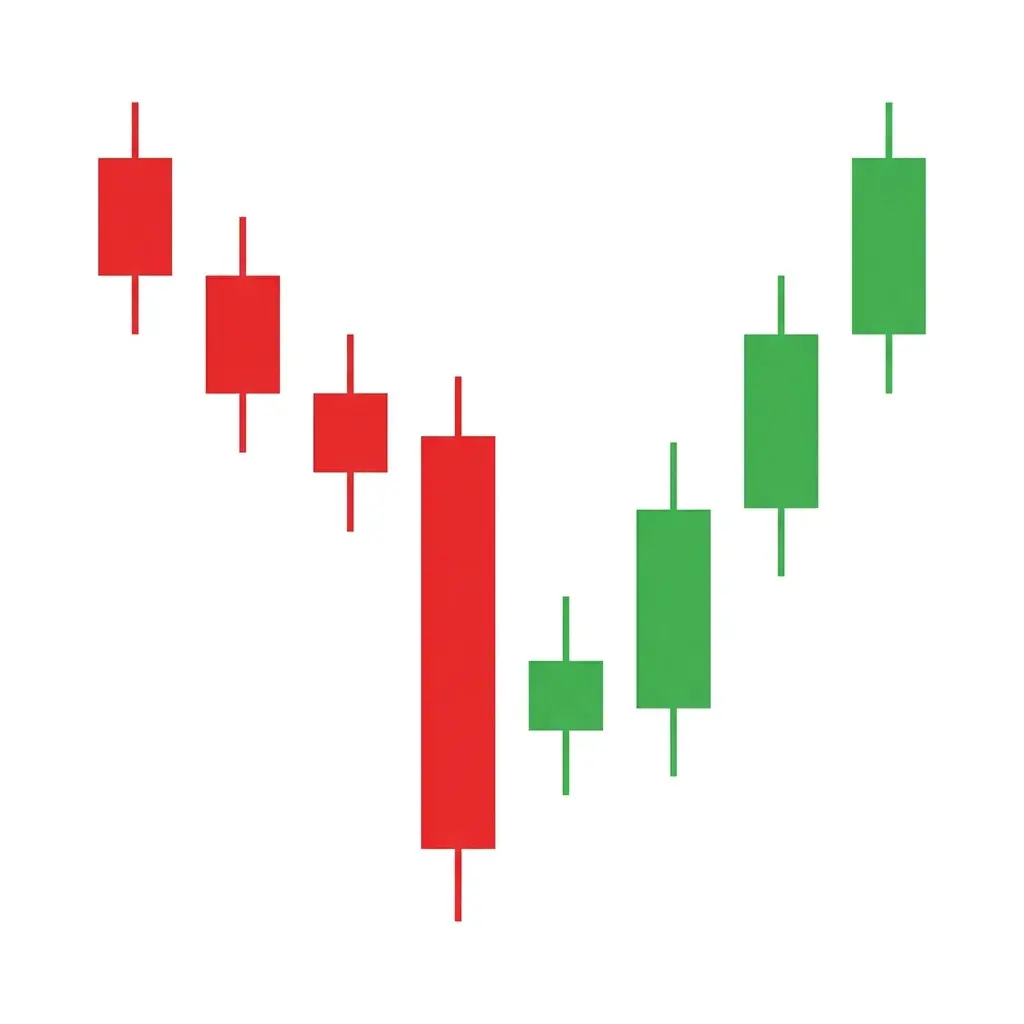
Every downtrend eventually ends, and the traders who spot the reversal first are the ones who catch the biggest moves. Bullish reversal candlestick patterns are the earliest warning signs that selling pressure is exhausting and buyers are stepping in. These patterns have been used by Japanese rice traders since the 1700s and remain some of the most powerful tools in a modern trader's arsenal.
In this guide, we break down 12 bullish reversal patterns with real chart examples. For each pattern, you will learn exactly what it looks like, why it forms from a market psychology perspective, and how to trade it with clear entry, stop loss, and target rules. Whether you trade forex, stocks, or crypto, these patterns work across every market and timeframe.
If you prefer AI-assisted pattern recognition, ChartSnipe can automatically detect these formations on your charts and give you a confidence rating with suggested entries and exits. But understanding the patterns yourself is essential, because context is everything in trading.
What Are Bullish Reversal Candlestick Patterns?
A bullish reversal candlestick pattern is a formation of one or more candles that appears after a downtrend and signals that selling momentum is fading. These patterns tell you that bears are losing control and buyers are preparing to take over. They are not a guarantee that price will reverse, but when they appear at the right location with the right confirmation, they provide some of the highest-probability long entries available.
The key to using these patterns profitably is context. A hammer candle in the middle of a range means nothing. The same hammer forming at a major support level after a 200-pip selloff with rising volume and RSI divergence is a trade worth taking. Throughout this guide, we emphasize where each pattern is most effective and what confirmation to look for before committing capital.
These patterns also form the foundation of bearish reversal patterns, which are their mirror images appearing at the top of uptrends. Understanding both sides of the coin makes you a more complete trader. And if you are studying broader chart formations, our guide to breakout chart patterns including flags, pennants, and wedges covers continuation setups that complement reversal trading.
Pro tip: The strongest bullish reversals happen when the pattern forms at a confluence zone where multiple support factors align. A bullish engulfing at a Fibonacci 61.8% retracement that also coincides with a previous structure high turned support is far more powerful than the pattern alone.
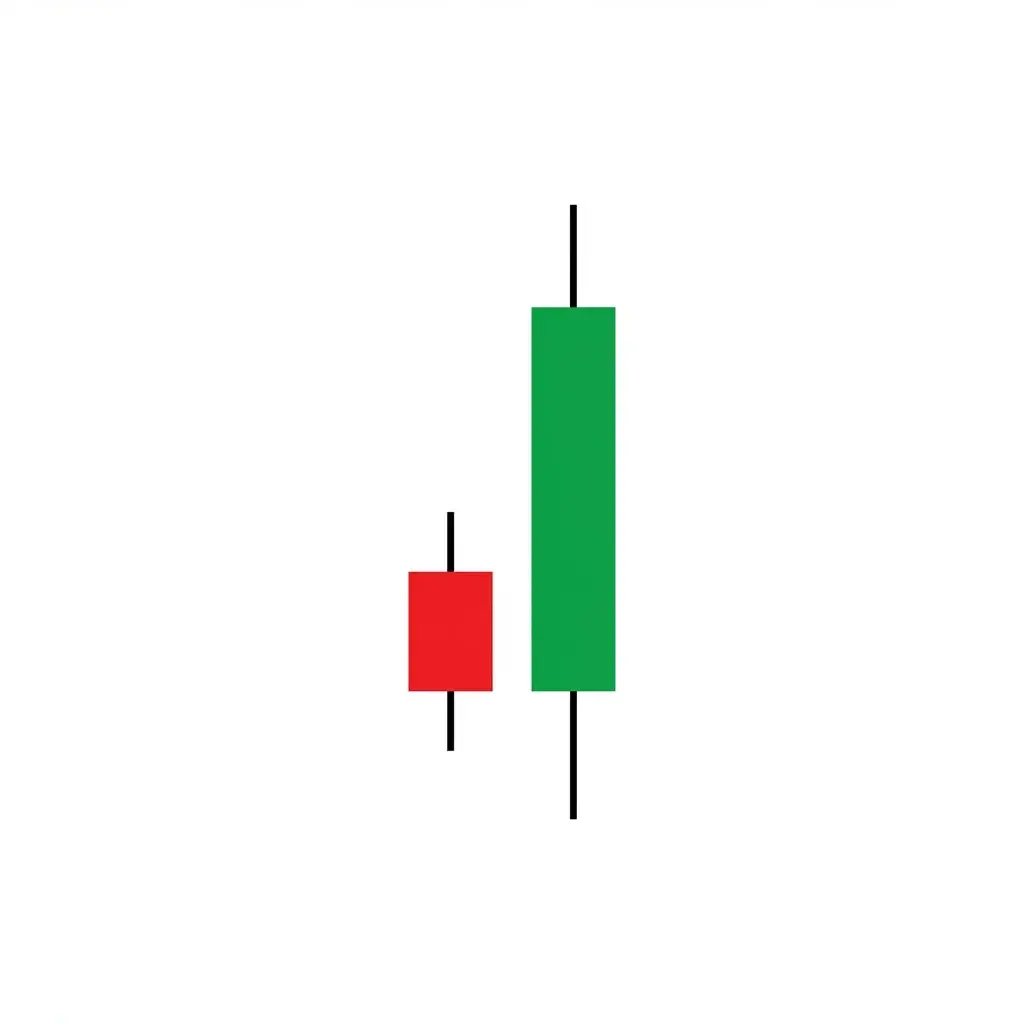
1. Bullish Engulfing Pattern
What It Looks Like
The bullish engulfing is a two-candle pattern. The first candle is a red (bearish) candle that continues the prevailing downtrend. The second candle is a large green (bullish) candle whose real body completely engulfs the real body of the first candle, meaning it opens below the prior close and closes above the prior open. The bigger the engulfing candle relative to the preceding candle, the stronger the signal.
What It Signals
The engulfing pattern represents a dramatic shift in sentiment within a single session. Bears pushed price lower on the first candle, but on the second candle, buyers overwhelmed sellers so completely that they erased all of the previous session's losses and then some. This kind of aggressive buying often marks the point where institutional money starts accumulating positions, and it frequently leads to sustained upward moves.
How to Trade It
Enter long on the close of the engulfing candle or on a break above its high. Place your stop loss below the low of the engulfing candle. Target a minimum 1:2 risk-to-reward ratio, or aim for the next significant resistance level. The pattern is strongest when volume on the engulfing candle is at least 50% higher than the average of the prior five sessions, confirming genuine buying conviction behind the move.
2. Hammer Candlestick Pattern

What It Looks Like
The hammer is a single-candle pattern with a small real body near the top of the candle and a long lower shadow that is at least twice the length of the body. The upper shadow should be very small or nonexistent. The body can be either green or red, though a green body is slightly more bullish. It must appear after a meaningful downtrend to qualify as a reversal signal.
What It Signals
During the session, sellers pushed price significantly lower, creating that long lower shadow. But before the session ended, buyers stepped in aggressively and drove price back up to near the opening level. This rejection of lower prices is a clear sign that demand exists at these levels and that bears could not maintain control even when they had momentum on their side.
How to Trade It
Wait for confirmation by entering on a bullish close above the hammer's high the following session. Place your stop loss below the hammer's lower shadow. The best hammers appear at key support levels with increasing volume. Avoid trading hammers in the middle of a range or during low-volatility consolidation, as they lose their reversal significance without a prior downtrend.
3. Morning Star Pattern
What It Looks Like
The morning star is a three-candle pattern that unfolds over three sessions. The first candle is a large bearish candle that continues the downtrend. The second candle is a small-bodied candle, either bullish or bearish, that ideally gaps down from the first candle's close. The third candle is a strong bullish candle that closes well into the body of the first candle, ideally past its midpoint.
What It Signals
The morning star tells a three-part story. First, bears are in full control with a convincing down day. Then the small-bodied candle shows indecision, with neither side able to gain dominance. Finally, the bulls take charge with a powerful rally that reverses most or all of the initial decline. This transition from bearish dominance through indecision to bullish control is one of the most reliable reversal sequences in candlestick analysis.
How to Trade It
Enter long at the close of the third candle or on a break above its high. Place your stop loss below the low of the middle candle, which is typically the lowest point of the formation. Target the nearest resistance level or use a 1:2 risk-to-reward minimum. The pattern is most reliable when the third candle closes above the midpoint of the first candle and when volume increases on the third candle relative to the first.
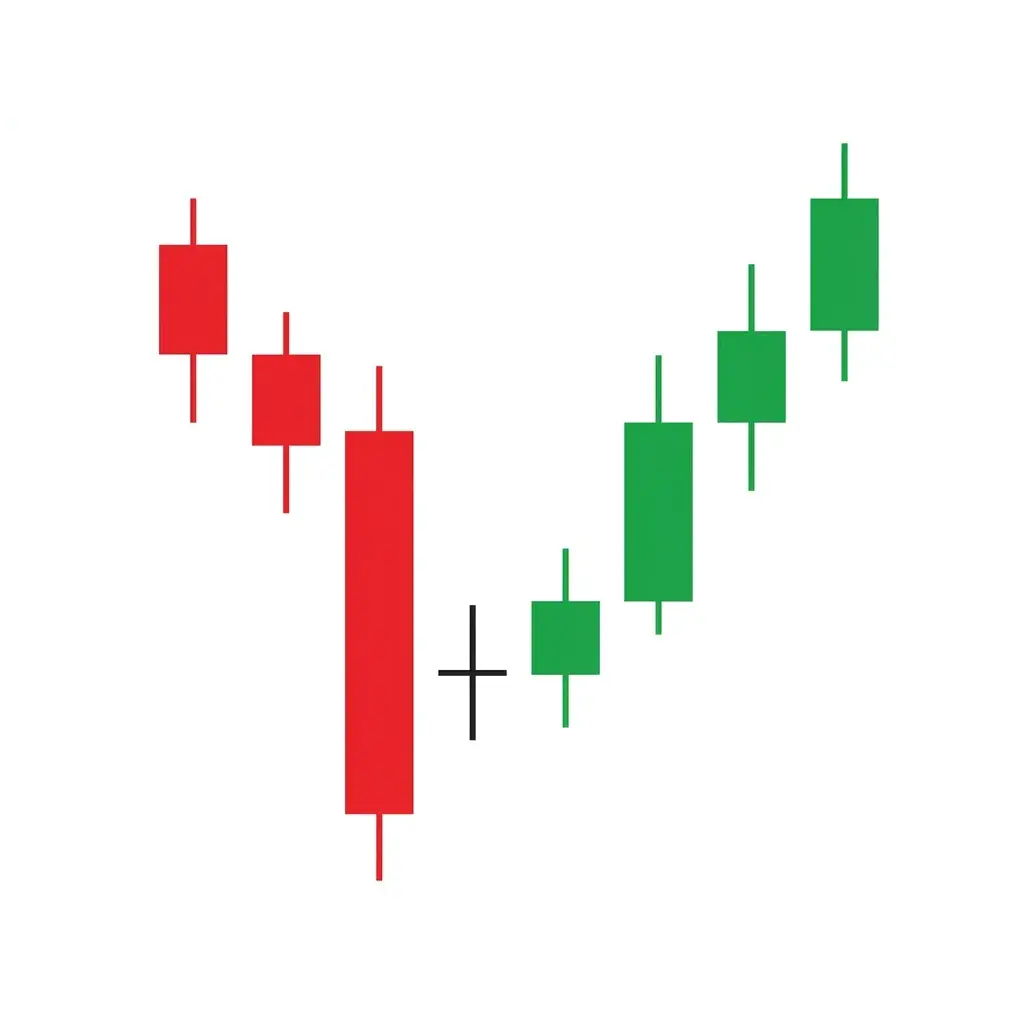
4. Morning Doji Star Pattern
What It Looks Like
The morning doji star is a variation of the morning star where the middle candle is a doji rather than a small-bodied candle. The doji's open and close are at virtually the same price, creating a cross or plus-sign shape. It is flanked by a large bearish candle before it and a large bullish candle after it. Gaps between each of the three candles strengthen the pattern, though in forex markets where gaps are rare, the doji alone at the lowest point of the formation is sufficient.
What It Signals
The doji represents a session of complete equilibrium between buyers and sellers. Coming after a strong bearish candle, this total indecision is a sign that the selling momentum has completely stalled. When the next session produces a powerful bullish candle, it confirms that the balance has tipped decisively in favor of buyers. Many traders consider the morning doji star more significant than the regular morning star because the doji represents a more extreme state of indecision.
How to Trade It
Trade it identically to the morning star: enter on the close of the third candle, stop below the doji's low, and target the next resistance zone. Because the doji adds an extra layer of confirmation, some traders are comfortable entering slightly larger positions on this pattern compared to a standard morning star. Always verify that the doji forms after a legitimate downtrend and not during sideways price action.
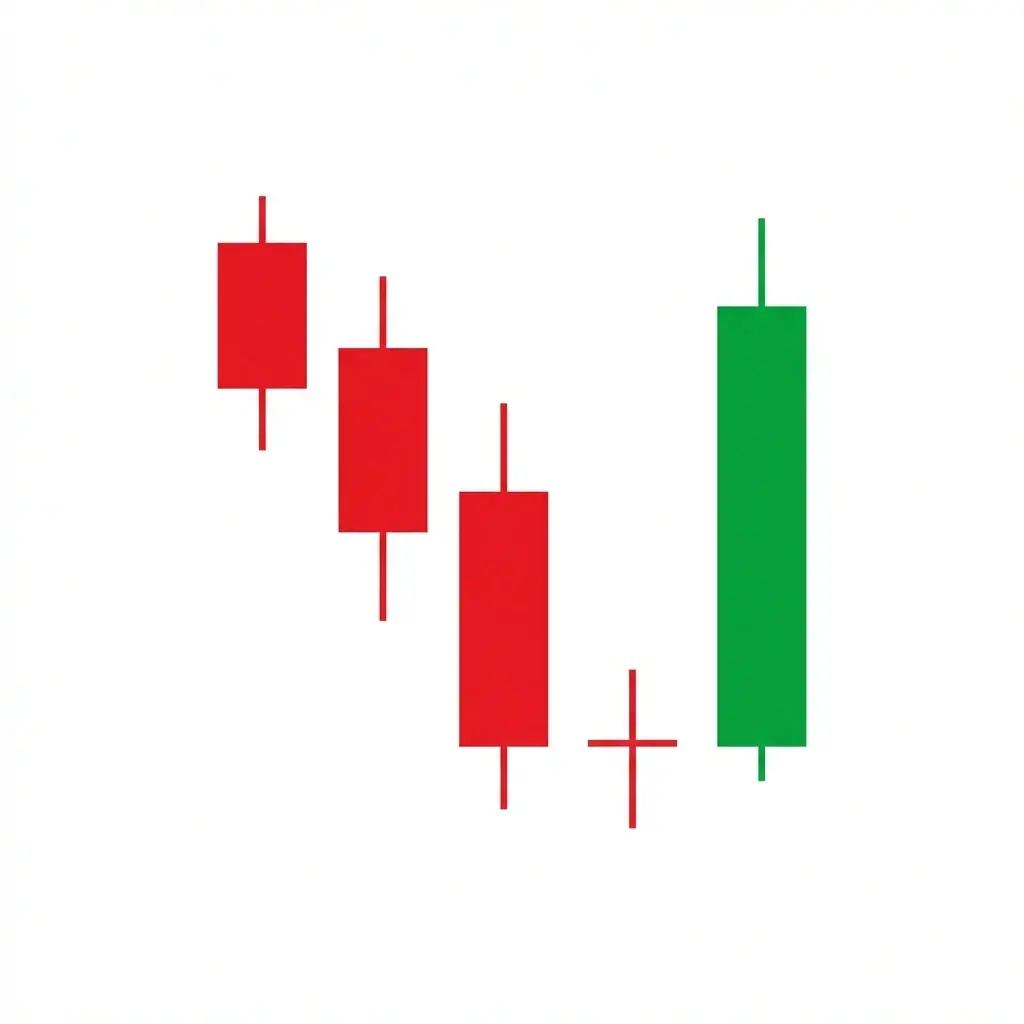
5. Piercing Line Pattern
What It Looks Like
The piercing line is a two-candle pattern. The first candle is a long bearish candle continuing the downtrend. The second candle opens below the low of the first candle (creating a gap down) and then rallies strongly to close above the midpoint of the first candle's body. The key rule is that the second candle must close above the 50% level of the first candle's body but not fully engulf it, otherwise it becomes a bullish engulfing pattern.
What It Signals
When price gaps down at the open, it initially looks like sellers are pressing their advantage. But the sharp recovery tells a different story: new buyers are entering at the lower prices and existing shorts are covering their positions. The fact that buyers pushed price past the midpoint of the previous day's range shows genuine strength, not just a minor bounce. This is often the kind of move that traps late shorts and triggers a short squeeze.
How to Trade It
Enter long above the high of the second candle with a stop below its low. The deeper the second candle closes into the first candle's body, the stronger the signal. A piercing line that closes at the 70-80% level of the first candle is nearly as powerful as a bullish engulfing. This pattern works especially well on daily charts in stock markets where gaps are common, but it can also be identified on forex charts where the open of the second candle is simply below the prior close.
6. Inverted Hammer Pattern
What It Looks Like
The inverted hammer has a small real body near the bottom of the candle with a long upper shadow at least twice the body length. The lower shadow is very small or absent. It is essentially the mirror image of the regular hammer. The body color can be green or red, though green is slightly preferred. Like all reversal patterns, it must appear at the bottom of a downtrend to be valid.
What It Signals
During the session, buyers attempted a rally and pushed price significantly higher, creating the long upper shadow. Although sellers managed to push price back down by the close, the fact that buyers even attempted such a move during a downtrend is noteworthy. It suggests that buying interest is growing and that the tide may be turning. Think of it as a warning shot from the bulls: they may have retreated this time, but they showed they have the firepower to fight.
How to Trade It
The inverted hammer requires next-day confirmation more than most patterns. Enter only if the next candle closes above the inverted hammer's body. Stop loss goes below the inverted hammer's low. Because this pattern has a lower reliability rate than the regular hammer, it works best when combined with other technical evidence such as oversold RSI readings, support zone proximity, or positive divergence on the MACD.
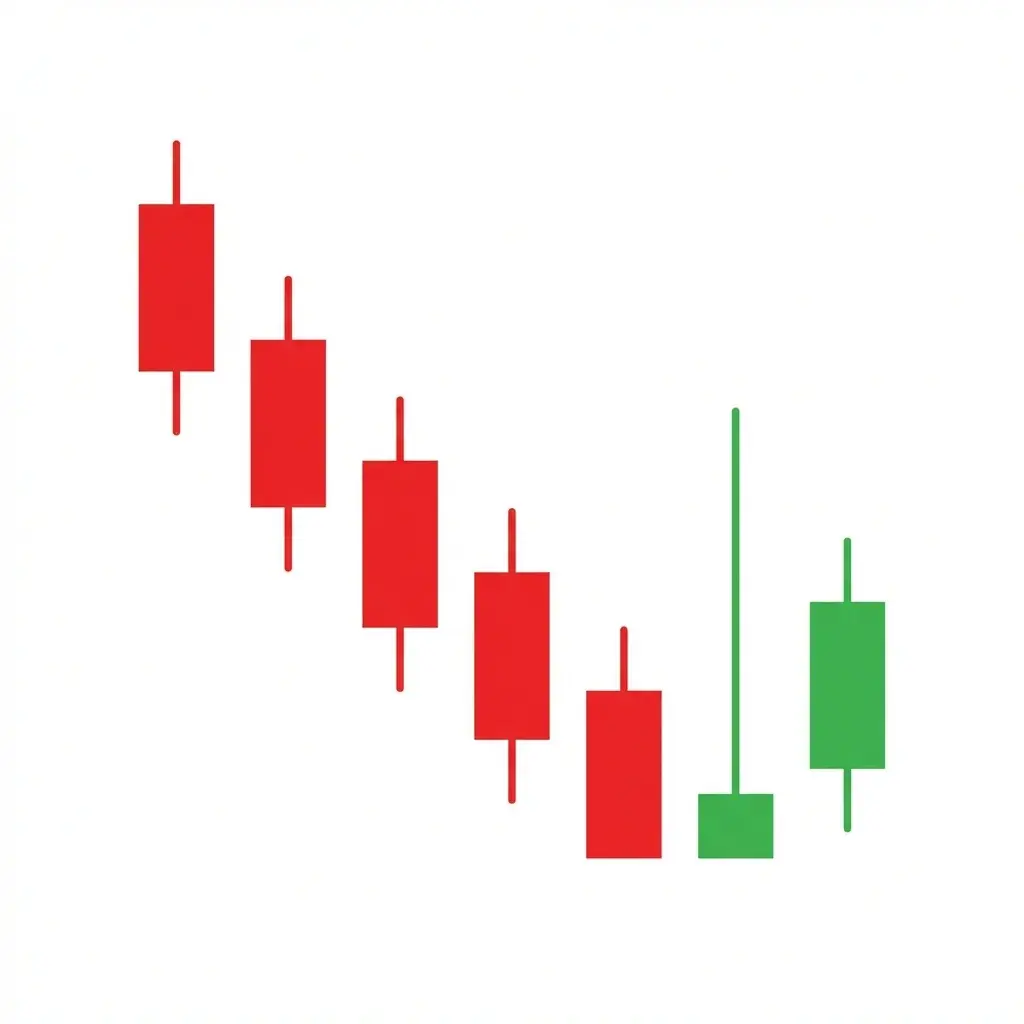
7. Dragonfly Doji Pattern
What It Looks Like
The dragonfly doji has its open, high, and close all at or very near the same price, creating a T-shaped candle with a long lower shadow and virtually no upper shadow. It resembles a hammer but with an even smaller body, as the open and close are at the exact same level. The longer the lower shadow, the more bullish the implications when it appears at the bottom of a downtrend.
What It Signals
The dragonfly doji is one of the most dramatic displays of buyer conviction you can find in a single candle. Sellers drove price sharply lower during the session, but buyers responded with such force that they pushed price all the way back to the opening level, completely erasing every tick of selling. At a support level during a downtrend, this kind of total rejection of lower prices is a powerful statement that the floor has been found.
How to Trade It
Enter long when the next candle confirms by closing above the dragonfly doji's open/close level. Stop loss goes below the lower shadow. The dragonfly doji is particularly effective at round number levels and previous support zones. If the lower shadow touches a key Fibonacci retracement or a moving average and gets rejected, the probability of a successful reversal increases significantly.
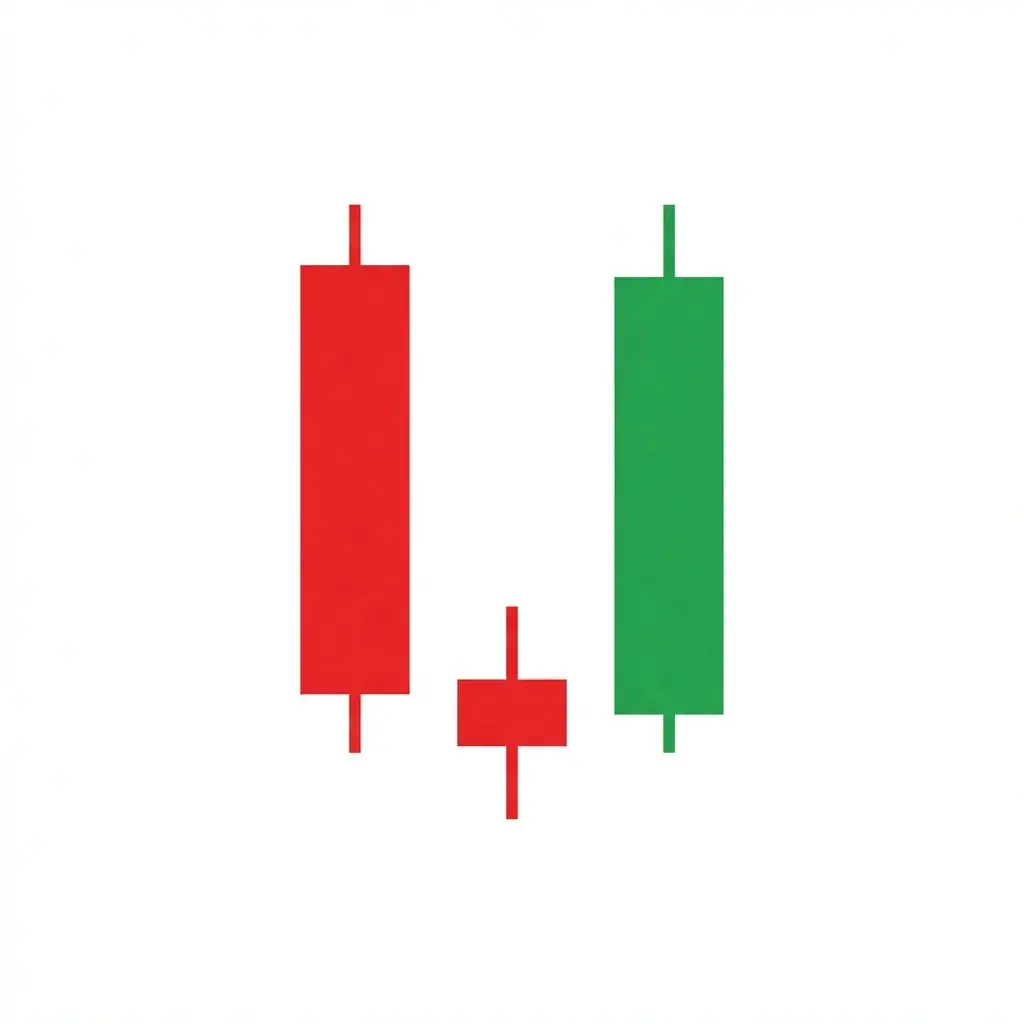
8. Bullish Harami Pattern
What It Looks Like
The bullish harami is a two-candle pattern and the visual opposite of the bullish engulfing. The first candle is a large bearish candle, and the second candle is a small bullish candle whose entire body fits within the body of the first candle. The word "harami" means "pregnant" in Japanese, describing how the small candle appears nested inside the larger one. The smaller the second candle relative to the first, the more significant the pattern.
What It Signals
After a large bearish candle shows strong selling, the small follow-up candle reveals that sellers have lost their momentum. The bears had every reason to continue pushing lower after such a decisive down candle, but instead the market barely moved. This contraction in range signals that supply is drying up and that sellers are exhausted. While the harami alone is not as strong as an engulfing pattern, it serves as an early warning that a trend change may be developing.
How to Trade It
Because the harami is a weaker signal on its own, wait for a third-candle confirmation that closes above the first candle's midpoint before entering long. Place your stop below the low of the formation. The harami works best as a setup rather than a standalone signal. Combine it with oversold oscillator readings, support levels, or trend line proximity. On higher timeframes like the daily and weekly charts, the harami carries more weight than on intraday charts.
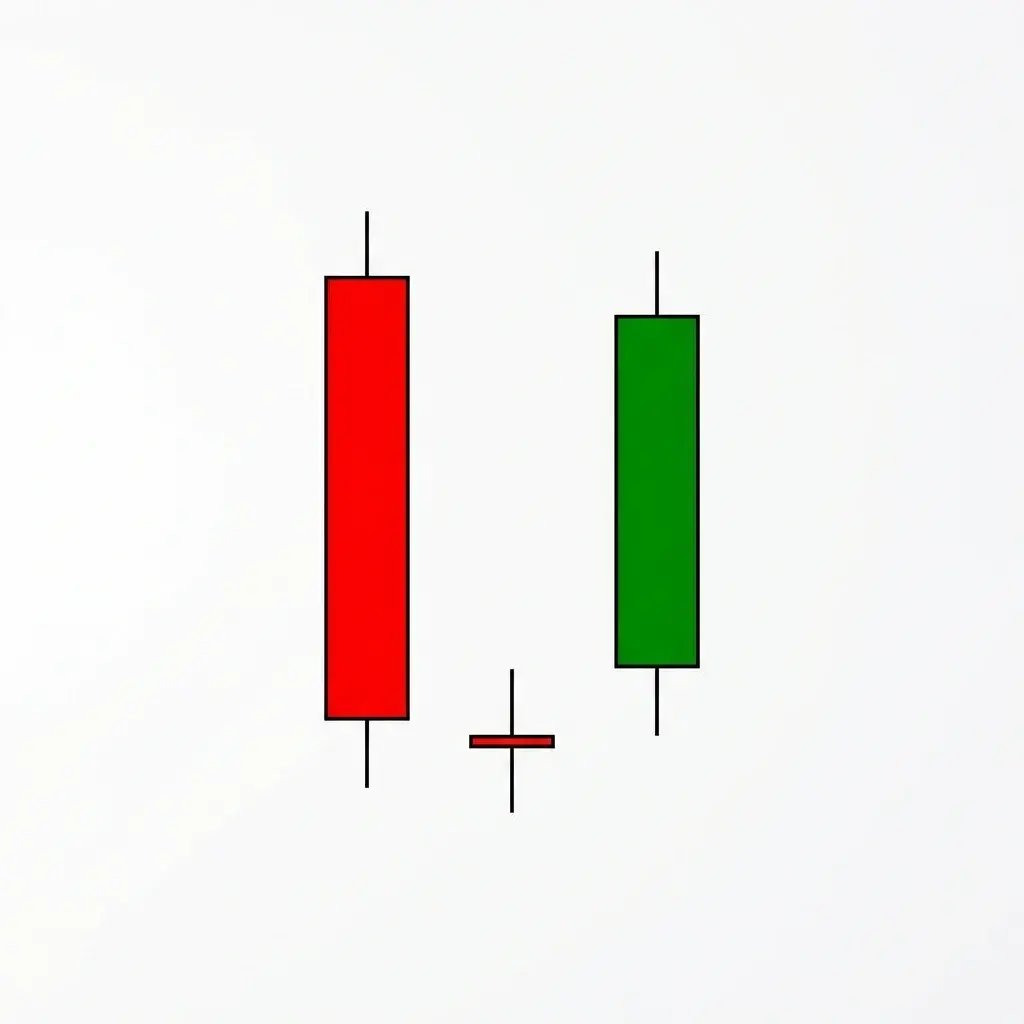
9. Bullish Harami Cross Pattern
What It Looks Like
The bullish harami cross is a variation of the bullish harami where the second candle is a doji instead of a small-bodied candle. The doji's cross shape sits entirely within the real body of the preceding large bearish candle. This creates a visually distinctive formation: a large red body with a tiny cross symbol nested in its center. The doji should ideally form in the lower half of the first candle's body for maximum bullish significance.
What It Signals
The harami cross is generally considered more significant than the regular harami because the doji represents complete indecision rather than just reduced momentum. After a strong selling session, the market reaches a point of perfect equilibrium where buyers and sellers are exactly matched. This dead stop in momentum is often the turning point of a trend. Institutional traders watch for this pattern at major support levels as a sign that the smart money is absorbing the selling pressure.
How to Trade It
Enter on a bullish confirmation candle that closes above the doji's high. Place your stop below the doji's low or the low of the entire formation for a wider stop. The harami cross at a key support level with a subsequent gap-up open on the third day is one of the most powerful setups in Japanese candlestick analysis. Risk management is straightforward because the doji provides a clear invalidation level.
10. Bullish Kicker Pattern
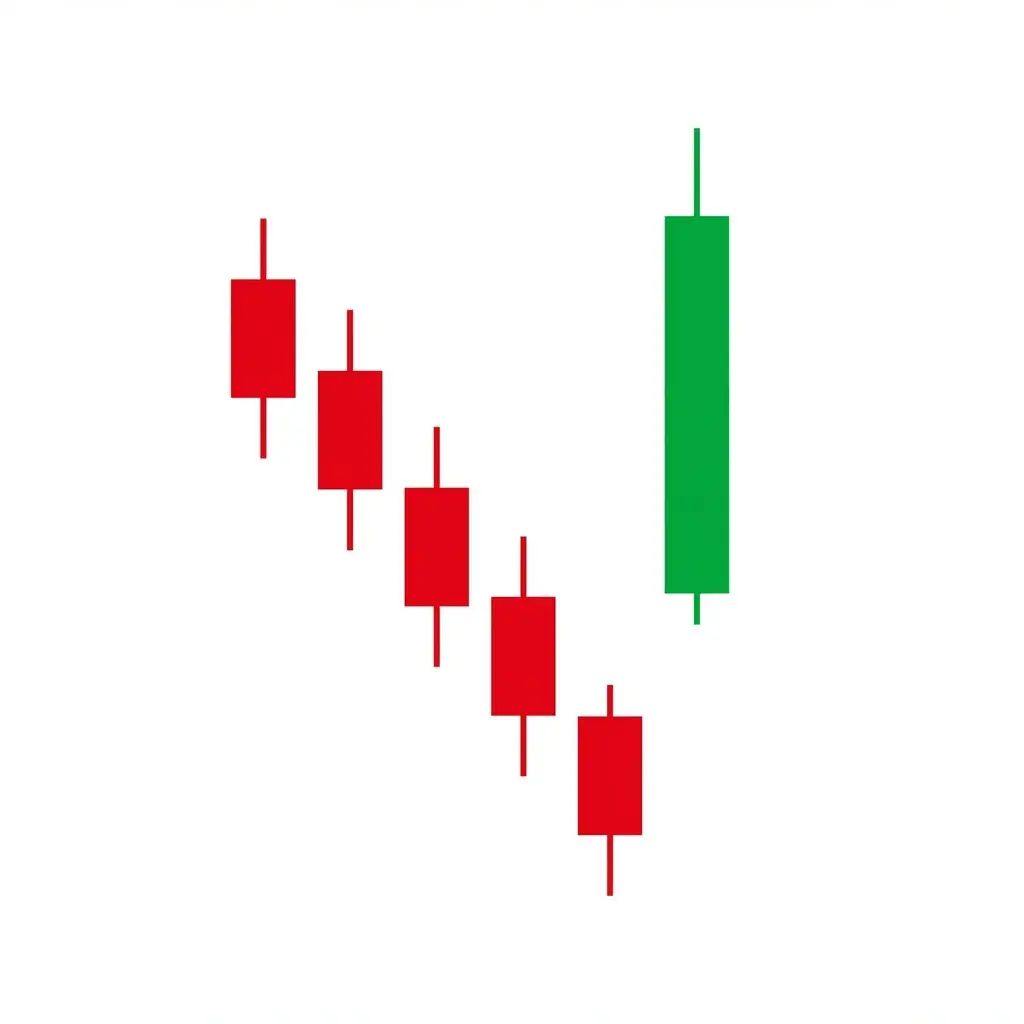
What It Looks Like
The bullish kicker is a two-candle pattern and one of the most explosive reversal signals in candlestick charting. The first candle is a bearish candle in line with the downtrend. The second candle opens at or above the first candle's open with a gap, creating a large bullish candle that never trades into the prior candle's range. The gap between the two candles is critical: it shows that sentiment shifted so dramatically overnight that the market could not even trade at the previous session's closing price.
What It Signals
The kicker pattern reflects a fundamental change in market perception, often triggered by unexpected news such as a positive earnings surprise, a policy change, or a geopolitical development. The gap represents trapped shorts who went home expecting continuation of the downtrend and woke up to find the market has moved against them. As these shorts cover, they add fuel to the rally. The kicker is considered one of the highest-probability reversal patterns because it represents a genuine shift in the underlying narrative.
How to Trade It
Enter on the close of the bullish kicker candle. Place your stop below the low of the bullish candle or, for a tighter stop, just below the gap. The gap should not be filled in subsequent sessions; if it is, the pattern has failed. Due to its rarity and reliability, many professional traders use a larger position size on kicker patterns compared to other reversal signals. Target a minimum 1:3 risk-to-reward ratio.
11. Bullish Abandoned Baby Pattern
What It Looks Like
The bullish abandoned baby is a three-candle pattern and one of the rarest formations in candlestick analysis. The first candle is a long bearish candle. The second candle is a doji that gaps below the first candle, meaning the doji's shadows do not overlap with the first candle's shadows. The third candle is a bullish candle that gaps above the doji, again with no shadow overlap. The doji sits isolated in space, "abandoned" between two gaps.
What It Signals
The abandoned baby represents an extreme sentiment shift. The first gap down shows bears at peak aggression. The doji shows the selling has completely exhausted itself with buyers and sellers reaching perfect balance. The second gap up shows that the market sentiment has reversed so completely that buyers now have overwhelming control. Because this pattern requires two gaps and a doji, it is exceptionally rare and exceptionally reliable when it does appear.
How to Trade It
Enter on the close of the third candle with a stop below the doji's low. Because this pattern is so rare, many traders treat it as a high-conviction setup and use a larger position size. The gap below and above the doji often acts as strong support going forward. This pattern is more common in stock markets due to overnight gaps and is very rare in 24-hour forex markets. When you do spot one, pay attention because it is one of the strongest reversal signals available.
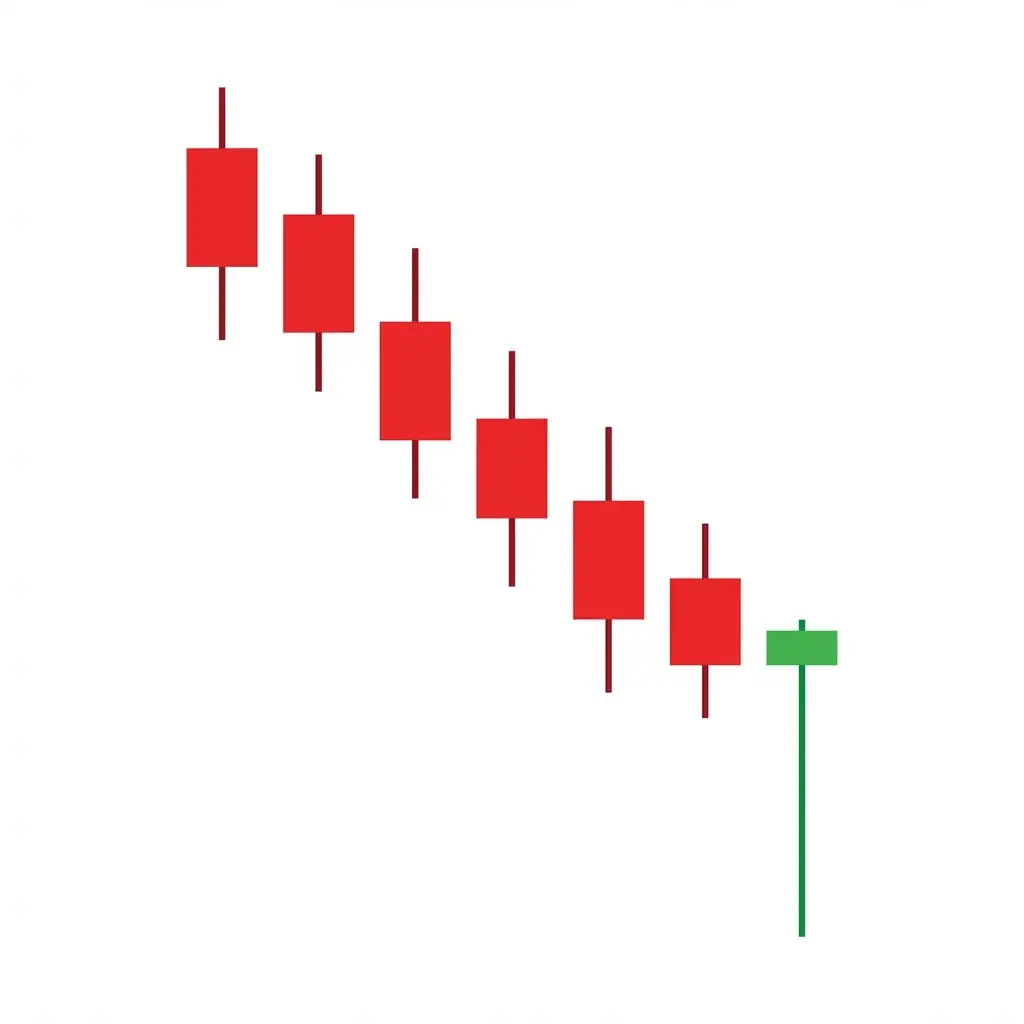
12. Bullish Belt Hold Pattern
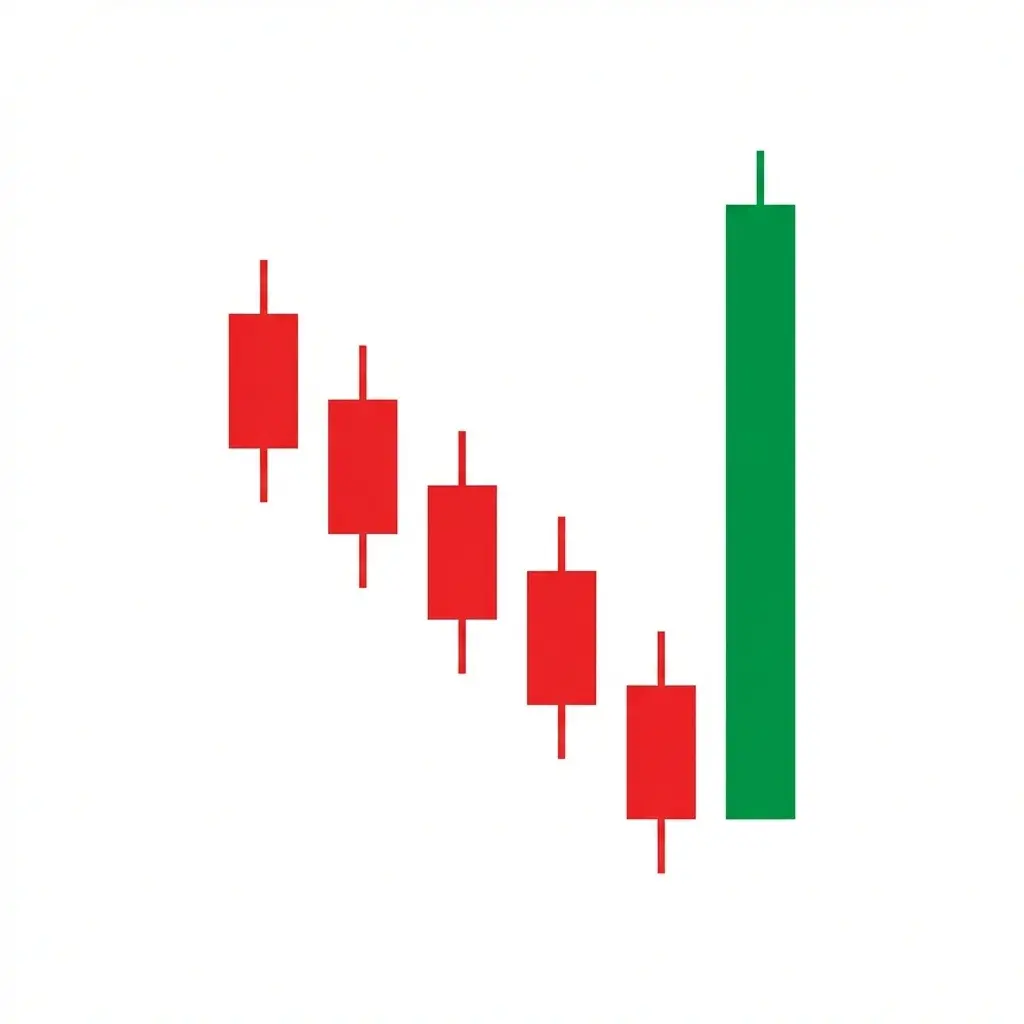
What It Looks Like
The bullish belt hold is a single long bullish candle that opens at or very near the session's low. It has little to no lower shadow, meaning price never traded below the opening level. The candle has a large real body and may have a small upper shadow. It gaps down from the prior candle's close, creating a lower open that immediately attracts buyers. The candle essentially opens at the worst possible price and spends the entire session rallying.
What It Signals
The belt hold shows that from the very first trade of the session, buyers were in complete control. There was no probing of lower prices, no testing of stops below the open. Buyers came in immediately and aggressively, driving price higher throughout the entire session. This is the kind of candle that forms when institutional buyers have identified a price level where they want to build positions, and they do not give the market a chance to go lower before they start accumulating.
How to Trade It
Enter on the close of the belt hold candle or on a slight pullback toward its midpoint if you want a better risk-to-reward ratio. Place your stop below the candle's open, which is the session low. The longer the candle relative to recent average ranges, the stronger the signal. If the belt hold candle's range is 1.5 to 2 times the average true range, it carries significant weight and often marks the beginning of a multi-session rally.
Tips for Trading Bullish Reversals
Knowing the patterns is only half the battle. How you use them in your trading plan determines whether they become a reliable edge or a source of false signals. Here are the principles that separate profitable reversal traders from those who get chopped up.
Always Require Context
A bullish reversal pattern is only valid at the bottom of a downtrend. A hammer in the middle of an uptrend is not a reversal signal. Always identify the prior trend before trading the pattern. The steeper and more extended the prior decline, the more reliable the reversal signal tends to be.
Volume Is Your Confirmation
A bullish reversal pattern on above-average volume is far more reliable than one on thin volume. High volume on the reversal candle shows real participation and conviction. If you trade forex where tick volume is the proxy, look for volume spikes relative to the prior 20 sessions.
Higher Timeframes Win
A bullish engulfing on the weekly chart is worth more than ten of them on the 15-minute chart. Higher timeframes reflect the decisions of more participants with more capital. Focus on daily and weekly patterns for the highest probability trades. Use intraday patterns only when they align with higher-timeframe levels.
Combine with Support Levels
The probability of a successful reversal increases dramatically when the pattern forms at a known support zone. Look for confluence with Fibonacci retracements, previous swing highs turned support, round numbers, moving averages, and volume profile value areas.
Manage Risk First
No pattern works 100% of the time. Always define your stop loss before entering the trade and never move it further away once set. Use position sizing that risks no more than 1-2% of your account per trade. The goal is to stay in the game long enough for the probability edge to play out over many trades.
Use AI to Scan and Confirm
Manually scanning charts for patterns across dozens of instruments is time-consuming and prone to subjective bias. Tools like ChartSnipe can automatically detect candlestick patterns and provide objective analysis, letting you focus on trade management and risk control.
Frequently Asked Questions
What is the most reliable bullish reversal candlestick pattern?
The bullish engulfing pattern and the morning star are widely considered the most reliable bullish reversal candlestick patterns. Both require strong volume confirmation and work best when they form at established support levels or after an extended downtrend. The bullish engulfing has a success rate above 60% when combined with support zones and rising volume, making it one of the most traded reversal setups among professional and retail traders alike.
How do you confirm a bullish reversal pattern is valid?
Confirm a bullish reversal pattern by checking for higher-than-average volume on the signal candle, the pattern forming at a known support level or after a significant downtrend, and a follow-through bullish candle closing above the pattern high on the next session. Additional confirmation from RSI divergence or MACD crossover strengthens the signal. Never trade a reversal pattern in isolation without at least one form of confirmation.
What is the difference between a hammer and an inverted hammer?
A hammer has a small real body at the top of the candle with a long lower shadow at least twice the body length, showing buyers rejected lower prices. An inverted hammer has a small real body at the bottom with a long upper shadow, showing initial buying pressure that was partially reversed. Both are bullish reversal signals at the bottom of downtrends, but the hammer is generally considered more reliable because it directly demonstrates buyer strength through the rejection of lower prices.
Can bullish reversal patterns work on any timeframe?
Yes, bullish reversal candlestick patterns appear on every timeframe from 1-minute charts to monthly charts. However, patterns on higher timeframes such as daily, weekly, and monthly are significantly more reliable than those on intraday charts. A morning star on the daily chart carries far more weight than one on the 5-minute chart because it reflects decisions by a larger pool of market participants with greater capital commitment.
How many candles does a morning star pattern have?
A morning star is a three-candle pattern. The first candle is a large bearish candle continuing the downtrend. The second candle is a small-bodied candle (spinning top or doji) that gaps down, showing indecision. The third candle is a large bullish candle that closes well into the body of the first candle. The gap between candles one and two is important for stocks but may not appear in 24-hour forex markets, where a lower open is sufficient.
Now What?
You don't need to memorize all 12 of these right now. Seriously. Just pick the engulfing and the hammer, get good at spotting them on real charts, and build from there. The rest will start jumping out at you naturally once your eye is trained.
Once you're comfortable with the bullish side, go learn the bearish reversal patterns too. You need both sides of the coin to trade properly.
Tired of staring at charts all day?
Upload a screenshot and let ChartSnipe find the patterns for you in seconds.
Try It FreeWritten by the ChartSnipe Team