
Currency Strength Meters Tell You the Past
Every mainstream strength meter is computed from price. That makes it circular, lagging and timeframe-dependent by construction — and it is still worth having open. Here is the maths, the four things it cannot do, and what has to sit beside it before the number points forward.
Open any strength meter right now and it will tell you which currency is strongest today. MarketMilk will. Your broker's widget will. The free TradingView script with 40,000 boosts will. They will disagree with each other by lunchtime, and every one of them will be correct.
That is not a bug in anyone's code. It is what happens when a whole product category computes the same thing from the same source. Strength meters take a currency's percentage change against the pairs it trades in and average them. That is the entire method. Some normalise by volatility, some rescale to a 0–10 axis, some add crosses to the basket — but underneath the presentation, every mainstream strength meter is price wearing a different hat.
Which means the output is a summary of what already happened, sitting mathematically downstream of the charts you are reading it against. It cannot confirm a move it was derived from. It cannot lead price it is calculated from. And it says nothing at all about why — which matters, because a currency is often at the top of the ranking precisely because its catalyst has finished, and that is the worst moment to buy it.
This post is not an argument for closing the meter. It is genuinely useful for a narrow set of jobs. If you want the how-to-use primer — what the scales mean, how to read the bars, the strong-versus-weak pairing rule — start with our currency strength meter guide, which covers all of that properly. This one picks up where that leaves off: what the tool structurally cannot do, and what has to sit next to it.
Key Takeaways
- →Strength meters are arithmetic on price. There is no forward-looking term anywhere in the formula.
- →Using a meter to confirm a pair is circular: that pair's own move is roughly 29% of the strength spread you are reading as confirmation.
- →The 1-hour and daily readings routinely disagree, and both are computing correctly. The window is a choice, not a fact.
- →Topping the ranking is often evidence a catalyst has finished repricing, not evidence of more to come.
- →What it is genuinely good for: pair selection, divergence, and checking whether your positions are secretly the same trade.
- →The number only points forward when a catalyst and a directional bias sit next to it. Most traders only ever look at the number.
1. The maths, worked through
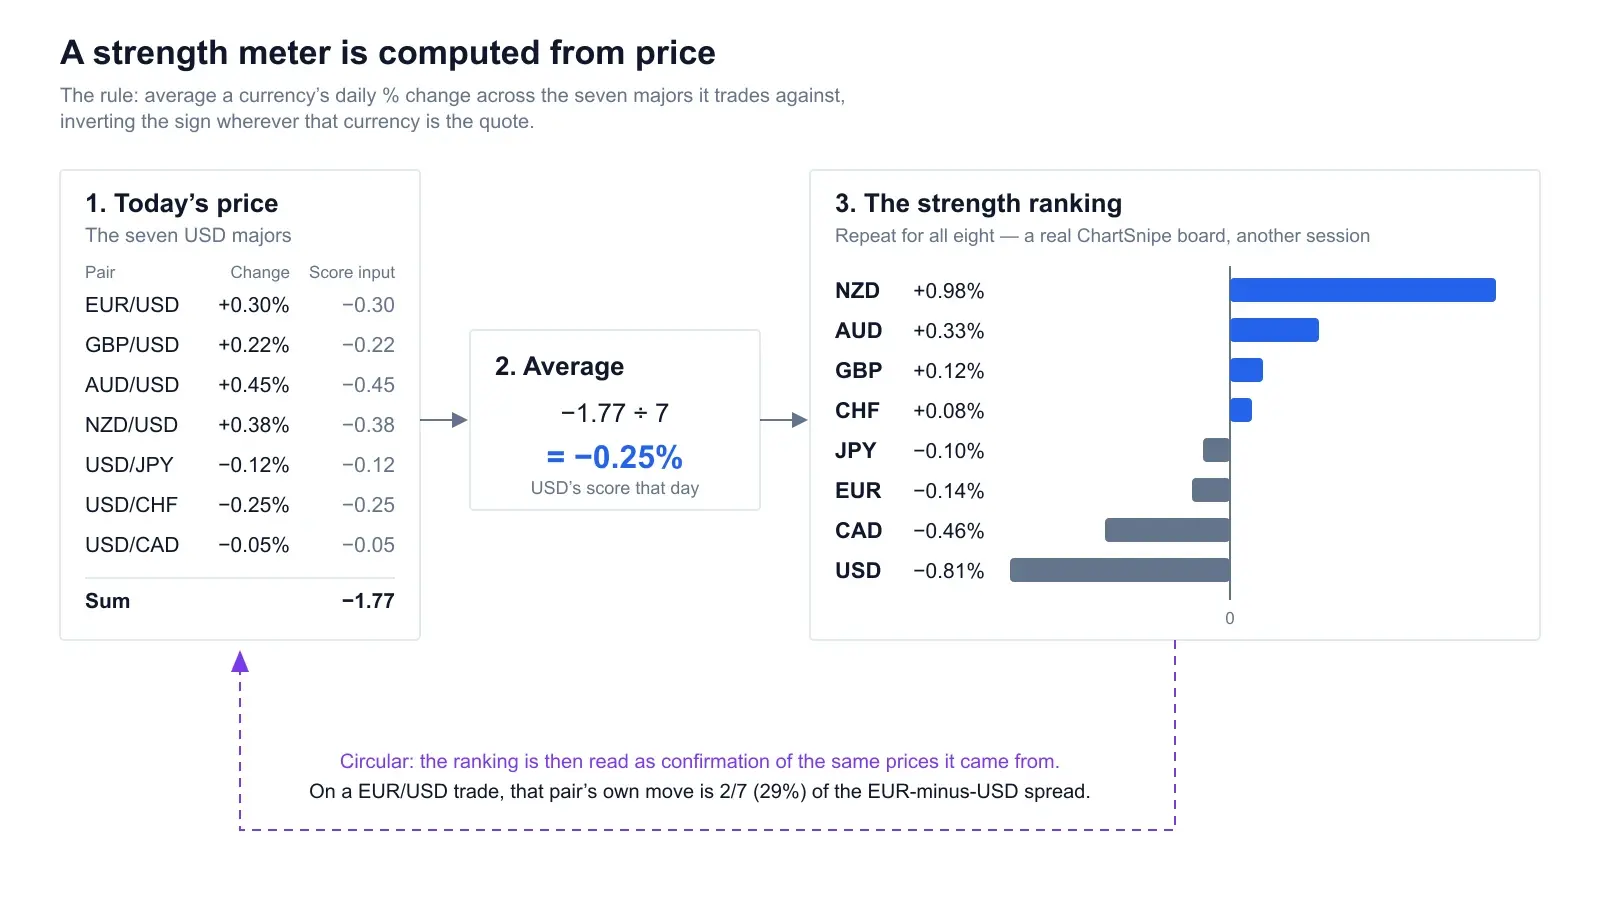
Nobody publishes this clearly, so here it is with numbers. Take the dollar. It has seven major counterparts, and it is the base currency in three of those pairs and the quote currency in four. To score it, you take each pair's daily percentage change, flip the sign wherever the dollar is the quote, and average the seven.
| Pair | Daily change | USD role | Contribution to USD |
|---|---|---|---|
| EUR/USD | +0.30% | quote | −0.30 |
| GBP/USD | +0.22% | quote | −0.22 |
| AUD/USD | +0.45% | quote | −0.45 |
| NZD/USD | +0.38% | quote | −0.38 |
| USD/JPY | −0.12% | base | −0.12 |
| USD/CHF | −0.25% | base | −0.25 |
| USD/CAD | −0.05% | base | −0.05 |
| Sum −1.77, divided by 7 | −0.25% | ||
USD scores −0.25%. Do the same for the other seven currencies and you have a ranking. That ranking is what every meter on the market is showing you, give or take a rescaling.
Notice what did not happen. No new information entered the calculation. Those seven percentages were already sitting on your watchlist before anyone averaged them. The meter did not observe anything you could not have observed; it reorganised numbers you already had. That is a real service — comparing eight currencies across 28 pairs in your head is genuinely hard — but it is a presentation service, not an information service.
One detail worth pausing on, because it is the sharpest version of the point. Spot FX is not the FX market. The BIS Triennial Survey for April 2025 puts global FX turnover at $9.6 trillion a day, up 28% from 2022 — and spot accounts for only $3 trillion of that, about 31%. Swaps and forwards, where the funding and hedging flow actually lives, are the majority of the market and never touch your strength number. The meter is an average of the visible third.
2. Problem 1 — it is circular
Here is the most common thing traders do with a strength meter, and it does not survive contact with the arithmetic above.
You are looking at a long setup on EUR/USD. You check the meter: EUR near the top, USD near the bottom. You take that as confirmation and enter. But EUR/USD contributes +1/7 to the euro's score and −1/7 to the dollar's score. So the gap between them — the exact thing you just read as confirmation — contains EUR/USD's own move at 2/7 weight, roughly 29%.
Nearly a third of your confirmation is the pair confirming itself. If EUR/USD ripped 80 pips this morning, the euro will look strong and the dollar will look weak, because that move is one of the seven inputs to each score. The meter did not agree with you. It restated your chart with extra steps.
The honest version of the check. The only non-circular information in a strength reading is the other six pairs. If the euro is top of the board and EUR/USD has barely moved, that is real news — the euro is being bought against everything else and the dollar is holding its own. If the euro is top of the board only because of EUR/USD, the ranking is one trade dressed as eight. Look at the breadth, not the rank.
This is why the meters that show you the constituent moves are more useful than the ones that show a single tidy bar. A bar hides whether the score came from broad participation or one outlier. Babypips MarketMilk does a decent job of exposing the underlying pair performance rather than only the aggregate, which is the right instinct.
3. Problem 2 — it lags by construction
Traders argue about whether indicators lag. For strength meters there is nothing to argue about: every input is a realised return over a window that has already closed. There is no forecast term, no expectation term, no lookahead of any kind. The formula is incapable of turning before price turns, in the same way an average is incapable of moving before its inputs do.
This is worth stating plainly because the marketing around these tools frequently implies otherwise. “Spot the next trend early.” “See which currency is about to move.” No formula built exclusively from past returns can do either. If a vendor sells you a strength meter as a leading indicator, they are either confused about their own product or counting on you not doing the arithmetic.
The practical consequence is about entry timing. By the time a currency has climbed to the top of the daily ranking, it has — definitionally — already made the move that put it there. You are reading the receipt.
4. Problem 3 — the window decides the answer
Ask a meter which currency is strongest and it will answer without telling you that the answer depends entirely on a setting you probably did not change.
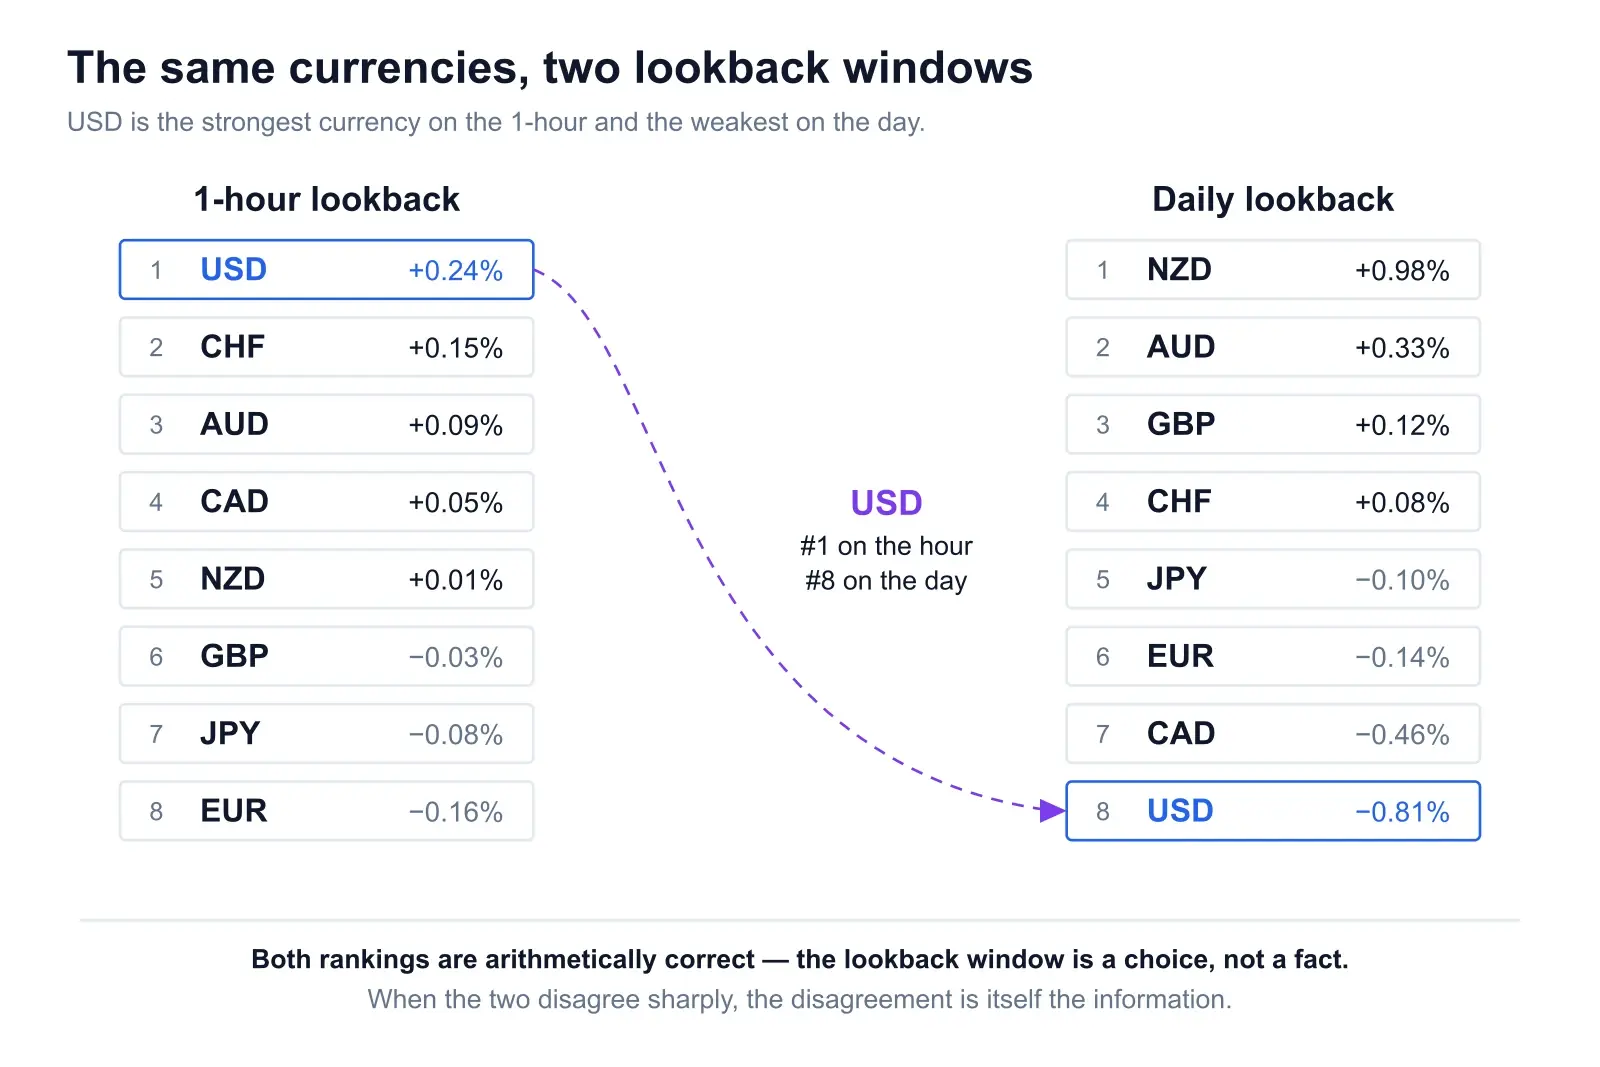
Take a currency that sold off hard on a bad inflation print at 13:30 and then ground steadily back for the rest of the session. On a 1-hour lookback it is the strongest thing on the board, because the last hour was all recovery. On a daily lookback it is the weakest, because the day started with a cliff. Both readings are arithmetically correct. They are answers to different questions, and the meter does not tell you which question it just answered.
It gets worse when you consider that there is no standard basket either. Some meters use the 7 majors per currency, some add crosses, some weight by turnover, some normalise returns by each pair's volatility so a 0.5% move in GBP/JPY does not overwhelm a 0.5% move in EUR/CHF. Every one of those decisions changes the ranking. Two people looking at two meters can have a genuine, unresolvable argument about which currency is strongest today, with both of them right.
What to do about it: pick one window that matches your holding period and stop cross-checking against others. A swing trader reading a 15-minute meter is collecting noise. A scalper reading a weekly meter is collecting history. And when the two windows disagree sharply on the same currency, that disagreement is itself the information — something happened inside the day that reversed the direction, and finding out what it was is more valuable than either reading.
5. Problem 4 — it never tells you why
This is the one that actually costs money, and it is the least discussed.
A currency can be at the top of the ranking for reasons that mean completely opposite things for the next session:
- A central bank surprised hawkishly this morning. The repricing has happened. The market has moved to the new rate path. Unless there is more to come, buying the close is buying after the event.
- A structural flow has been running for weeks. Reserve diversification, a terms-of-trade shift, a persistent yield gap. This one can continue, and the strength reading is a legitimate symptom of it.
- A crowded short got squeezed. Positioning unwound violently and the move has nothing to do with fundamentals. It stops when the pain stops, usually without warning.
- It is the least-bad option in a risk-off day. Safe-haven bid, not conviction. It reverses the moment risk appetite returns.
- Thin liquidity. A holiday session, a month-end fix, an option expiry. The move is mechanical and frequently gives itself back.
All five produce the same green bar at the top of your meter. The bar is identical. What happens next is not remotely identical. The meter has no vocabulary for the difference because the difference is not in the price data — it is in the calendar, the central bank language and the positioning data.
This is also why the search for a fundamental currency strength ranking keeps coming up empty. The inputs that would answer “why” — expected policy path, data surprise versus consensus, terms of trade, positioning — do not collapse into a single tidy number the way price does. Price-derived meters are popular precisely because they produce a clean ranking by declining to ask the harder question.
6. “Strongest today” is often the worst thing to buy
Put problems 2 and 4 together and you get the failure mode that hurts people. A currency reaches the top of the ranking because a catalyst has just finished playing out. The ranking is a record of the repricing. Buying the top of the list is systematically buying immediately after the news, at the worst available price, from the people who were positioned for it.
Rate decisions are the clearest case. The market does not trade the policy rate; it trades the gap between the path already priced and the path the central bank signals. Once a press conference has shifted expectations, the currency reprices in minutes to hours, and the strength meter records that repricing after the fact. What matters for tomorrow is whether there is still a gap between what is priced and what is likely — and that question lives in the Fed's own projections and statement calendar, not in a percentage change.
The Bank of England’s Monetary Policy Report press conference, 30 July 2026 — the primary source for sterling’s policy path. This hour is where the next few weeks of GBP strength get decided; the meter reports it afterwards.
The same logic applies to data. A currency that tops the board on the day of a hot CPI print has already absorbed that print. The tradeable question is what the next release does to the path, and our guide to high-impact forex news events covers which releases actually move rate expectations versus which ones only make noise.
None of this makes the top of the ranking untradeable. Trends persist, and a currency strong for structural reasons keeps being strong. It makes the ranking insufficient. You need to know which of the five reasons in the previous section put it there.
7. What strength readings are genuinely good for
Having spent five sections on the limitations, here is the fair half. There are three jobs a strength meter does better than anything else, and all three share a property: they are about selection, not prediction.
Job 1 — deciding which pair to trade
This is the strongest use and it is not close. There are 28 pairs across the 8 majors. Trading the strongest against the weakest gives you the widest divergence between the two legs, which in practice means fewer counter-trend whipsaws and cleaner structure than trading two currencies that are both drifting. If you have already decided you want to be long the dollar, the meter tells you what to be long against — and that choice is often worth more than the direction call. The pairing rule is covered in detail in the primer.
It is also a filter for the opposite case: two currencies sitting next to each other in the middle of the ranking will produce a range, and a lot of people lose money trying to trend-trade a pair whose two legs are doing the same thing. Our breakdown of which forex pairs the smart money actually trades goes into why liquidity concentrates where it does.
Job 2 — spotting divergence
When a pair goes sideways but the two currencies' scores are steadily separating on the broader board, something is building that the pair chart has not shown yet. This is the closest a strength meter gets to being early, and it is worth being precise about why: it is not predicting anything. It is telling you that the pressure is visible against six other counterparts before it becomes visible against this one. That is a breadth signal, and breadth genuinely does sometimes lead the single instrument.
The honest caveat: divergence resolves in both directions, and plenty of times the sideways pair is right and the breadth is noise. Treat it as a reason to put a pair on the watchlist, not a signal.
Job 3 — checking your positions are not the same trade
Long AUD/USD, long NZD/USD, short USD/CAD and long gold is not four positions. It is one dollar-short position wearing four costumes, and it will all go wrong on the same afternoon. A strength board makes that obvious in a way individual charts never do: if the whole commodity bloc is clustered at one end and the dollar is at the other, you are looking at a single macro bet.
It works the other way too. When AUD and NZD scores start pulling apart after months of moving together, the AUD/NZD correlation is breaking down and the cross becomes tradeable in its own right. Our forex correlation guide covers the pairings where this matters most.
8. What has to sit next to the number
Strength tells you where the money went. To get any sense of where it might go next you need two more things, and neither of them is derivable from price.
The catalyst
Which currency has a scheduled event in the next 24 hours, what is the consensus, and how far is the actual likely to land from it. A rate decision that is 32 of 32 economists on hold is fully priced and the reaction lives entirely in the statement language, not the number. A payrolls print with a wide forecast dispersion is a genuine coin flip with a large reaction. Those are different trades and only a calendar tells you which one you are in. Trading Economics publishes consensus and previous alongside each release, which is the minimum you need.
The policy path
Not the current interest rate — that is in the price. The expected path, and specifically the gap between what the market has priced and what the central bank is signalling. This is the single most durable driver of major FX and it is almost entirely absent from strength meters. Two currencies with identical policy rates and opposite trajectories will diverge for months, and the strength meter will report that divergence a day at a time, after each day is over.
Reading it means going to the primary sources: statements, minutes, projections and press conferences. For the dollar that is federalreserve.gov, and the same discipline applies to the ECB, BOE, BOJ, SNB, RBA, RBNZ and BOC. It is slow work, which is exactly why most retail traders skip it and look at a coloured bar instead.
The argument of this whole post, in one line: strength is the past, the catalyst and the policy path are the future, and almost every trader has the first one permanently open and the other two permanently closed.
9. How we do it, stated honestly
It would be convenient to end a critique of price-derived strength meters by announcing that ours is different. It is not, and here is the disclosure in our own words, taken verbatim from the product:
“Currency percentages shown are our ChartSnipe Strength Index — calculated by averaging the daily % change across all 7 major pairs each currency is traded against, inverting the sign when the currency is the quote.”
That is the exact calculation in section 1. It is price-derived. It is backward-looking. It carries every one of the four problems above, and anyone claiming their strength index escapes the lag is selling you something that cannot exist.
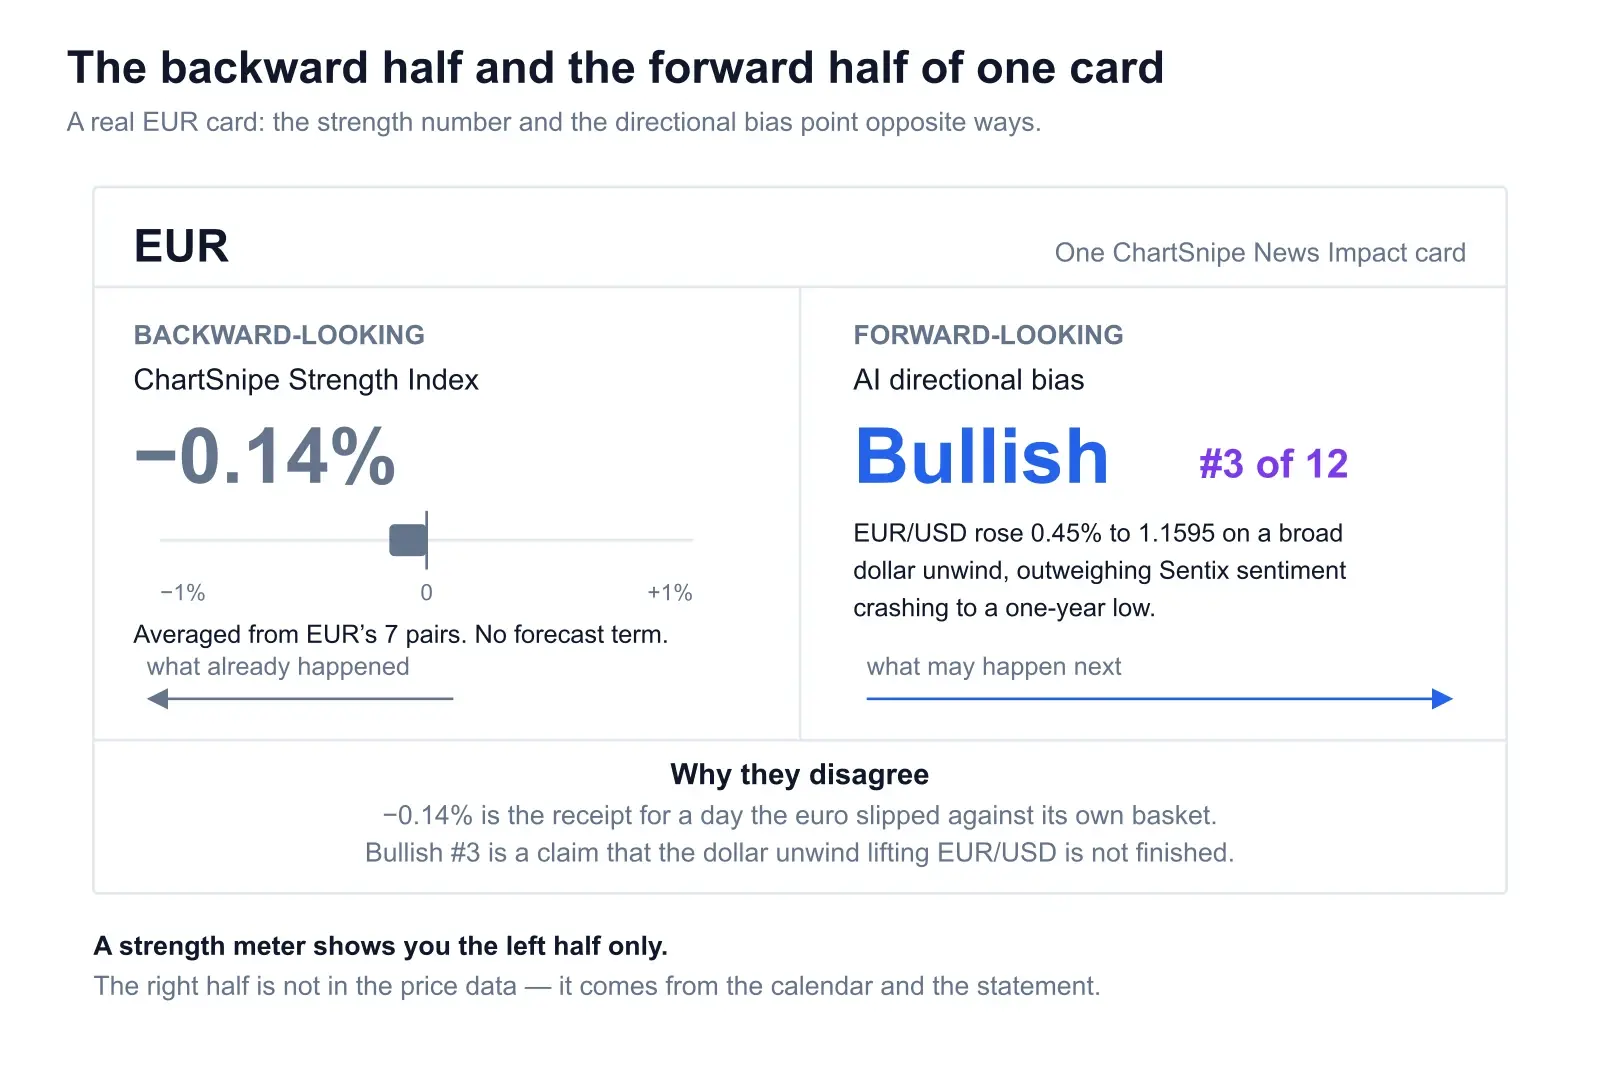
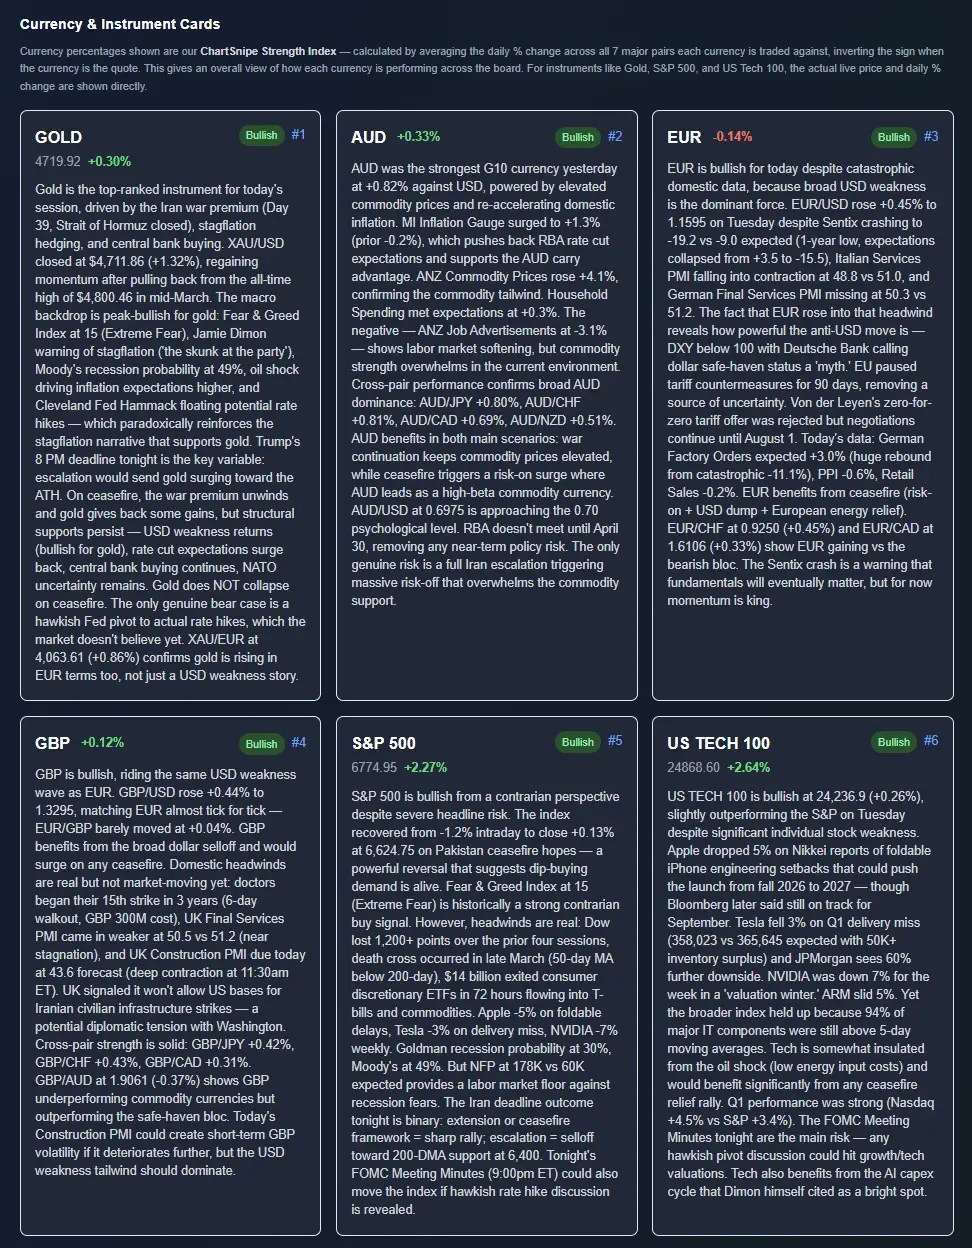
What is different is where the number sits. In the News Impact instrument cards, the strength percentage is printed on the same card as an AI-generated directional bias, a placement from #1 to #12, and several paragraphs of written reasoning citing the actual releases, central bank quotes and cross-pair behaviour behind it. The backward-looking number and the forward-looking argument are in one place, and you cannot read one without seeing the other disagree with it.
That EUR card is the whole argument in one screenshot. A strength meter alone would have shown you a small red bar and left you to guess. The card shows the red bar, then explains that EUR/USD rose 0.45% to 1.1595 despite Sentix crashing to a one-year low, that the anti-dollar move is powerful enough to overwhelm catastrophic domestic data, and — usefully — ends with a caveat that the sentiment crash is a warning fundamentals will eventually matter.
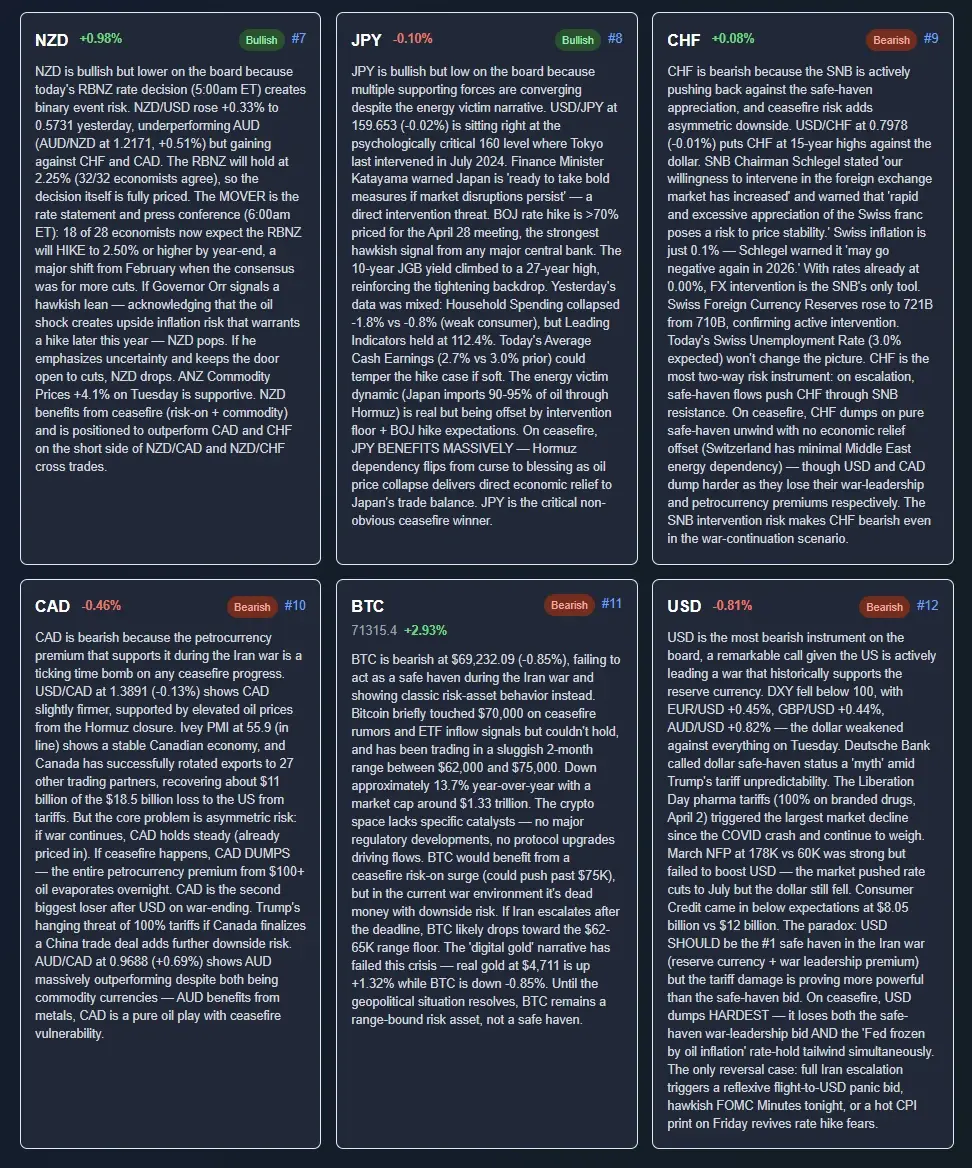
Count the disagreements across those two screenshots. Of the eight major currencies on that board, three have a strength sign pointing the opposite way to their bias — EUR negative but bullish, JPY negative but bullish, CHF positive but bearish. And the single strongest number on the board, NZD at +0.98%, places seventh of twelve. If you had traded that day's ranking, you would have been long the kiwi into a rate decision and short the euro into a dollar unwind.
For FX currencies the card shows the Strength Index percentage; GOLD, BTC, the S&P 500 and US TECH 100 show live price and daily change instead, since averaging across seven majors is meaningless for them. Twelve cards, one board, published Monday to Friday between 20:00 and 23:00 UTC for the session ahead. Full analysis is Pro or Premium; free accounts see an admin-featured past-day preview rather than the current board.
There is also an 8-currency Strength Index bar graph on the same page, and it is worth saying that the bar graph is the least important thing there. It is the part every competitor already has. The reasoning paragraph next to it is the part that answers “why”.
10. A five-minute routine that uses strength correctly
Order matters here. Most traders run these steps backwards, which is how the strength reading ends up doing a job it cannot do.
- Calendar first, before you look at any prices. Which currencies have a scheduled release or speaker in the next 24 hours, and what is the consensus. Doing this first stops the ranking from anchoring you.
- Now open the strength board. Note the extremes and, more importantly, the breadth — is the leader strong against everything or against one pair.
- Ask which of the five reasons applies to the top and bottom of the list. Finished catalyst, structural flow, squeeze, safe-haven bid, or thin liquidity. If you cannot answer, you do not have a trade yet.
- Build the pair from the extremes, but only where the reasoning supports the direction. Strongest against weakest is a shortlist, not an entry.
- Check you are not stacking one macro bet. Look at your open positions against the board and count how many are really the same dollar trade.
- Take the entry from the chart, not from the meter. Structure, level, invalidation. You can drop a screenshot into the Chart Snipe tool for a pattern, trend and probability read plus risk guidance if you want a second opinion on the level.
Steps 1 and 3 are the ones people skip, and they are the only two that point forward. Everything else in the routine is bookkeeping on what already happened.
Frequently asked questions
Are currency strength meters accurate?
They are exactly accurate at the thing they measure, which is not the thing most traders think they measure. A meter averages a currency's percentage change across the pairs it trades against, so it reports what already happened over a chosen window. That arithmetic is precise. What it cannot be is predictive, because there is no forward-looking term anywhere in the formula.
Do currency strength meters work?
For pair selection, divergence spotting and correlation sanity checks, yes. As confirmation or a standalone signal, no. The reason is structural: a strength reading is computed from the same prices you are looking at, so using it to confirm a chart is confirming a number with itself.
Which currency is strongest today?
Any live meter answers that, and the answer changes with the window you choose. The more useful question is why it is strongest and whether the catalyst that made it strong has already finished. A currency frequently tops the daily ranking because a central bank surprised hawkishly that morning, which means the repricing is behind you rather than in front of you.
Is there such a thing as an AI currency strength meter?
Not in the sense the phrase implies. The strength calculation is arithmetic, and there is nothing for a model to add to an average. Where AI genuinely helps is beside the number — reading the day's releases, central bank language and cross-pair behaviour, then writing a directional bias for each currency. That is a different output sitting next to the strength reading, not a smarter version of it.
Why do two currency strength meters disagree?
There is no standard formula. Meters differ on lookback window, pair basket, whether crosses are included, whether returns are normalised by volatility, and whether the output is a raw percentage or a rescaled index. Change any one and the ranking changes. Two meters showing different leaders on the same afternoon are usually both computing correctly.
Is there a fundamental currency strength ranking?
Not as a single agreed number, and be suspicious of anything sold as one. What exists is a set of inputs you rank by hand or with a model: expected policy path rather than current rate, the surprise gap between data and consensus, terms of trade, and positioning. They do not collapse into one tidy score, which is precisely why price-derived meters dominate.
Is a currency strength meter a lagging indicator?
Yes, by construction and without exception. Every input is a realised return over a window that has already closed. A meter cannot turn before price turns because it is arithmetic performed on price. This is not a flaw in a particular implementation — it is what the category is.
Should you buy the strongest currency and sell the weakest?
As a way of choosing which pair to trade, yes — pairing the extremes gives the widest divergence and usually the cleanest trend. As a reason to enter, no. Strong-versus-weak tells you where to look, not whether to buy, and it says nothing about how much is already priced.
Is the ChartSnipe Strength Index different from other meters?
The calculation is not. It averages each currency's daily percentage change across the 7 major pairs it trades against, inverting the sign when the currency is the quote — the same price-derived, backward-looking method as everyone else, with the same lag. What differs is placement: it is printed on the same instrument card as an AI directional bias, a #1 to #12 ranking and written reasoning, so the backward number and the forward argument are read together.
Sources & further reading
- BIS — Triennial Central Bank Survey, April 2025Global FX turnover of $9.6 trillion per day, up 28% from 2022, with spot at $3 trillion or 31% of the total. The context for how much of the market a spot-derived strength reading actually sees.
- Federal Reserve — Monetary PolicyStatements, minutes, projections and press conferences. The primary source for the dollar's policy path, which is the input no strength meter contains.
- Trading Economics — Economic CalendarConsensus, previous and actual for scheduled releases across every major economy. The surprise gap is what moves rate expectations.
- Babypips MarketMilkA free strength dashboard that exposes constituent pair performance rather than only the aggregate bar — the right way to build a price-derived meter.
- ChartSnipe — Currency Strength Meter GuideThe how-to-use primer this post builds on: scales, reading the bars, the strong-versus-weak pairing rule and timeframe selection.
See the number and the reason on the same card
Twelve instrument cards, published every trading day for the session ahead. Each one carries the ChartSnipe Strength Index percentage — backward-looking, and we say so — next to an AI directional bias, a #1 to #12 placement and the written reasoning behind it. Full analysis is on Pro and Premium.