Trend Continuation Patterns: Ride the Momentum
Master 13 candlestick and price action patterns that signal trend strength, momentum continuation, and high-probability entries in the direction of the prevailing move.
There is a saying every successful trader lives by: the trend is your friend. It sounds simple, yet most retail traders ignore it. They spend their time trying to call tops and bottoms, fighting the momentum that professional traders are riding for consistent profits. The truth is, trading with the trend is the single highest-probability approach you can take in any market.
Continuation patterns are the heartbeat of a trend. They represent brief pauses where traders take profits, late entrants hesitate, and the market takes a breath before the dominant force reasserts itself. Learning to recognize these pauses and trade them confidently is what separates trend followers who compound their gains from traders who constantly get shaken out. In this guide, we break down 13 essential continuation patterns with real chart examples, entry strategies, and the psychology behind each one.
Whether you trade forex, stocks, crypto, or commodities, these patterns appear on every timeframe and every instrument. Combined with tools like ChartSnipe's AI pattern recognition, you can spot them faster and trade them with greater precision.
1. Rising Three Methods
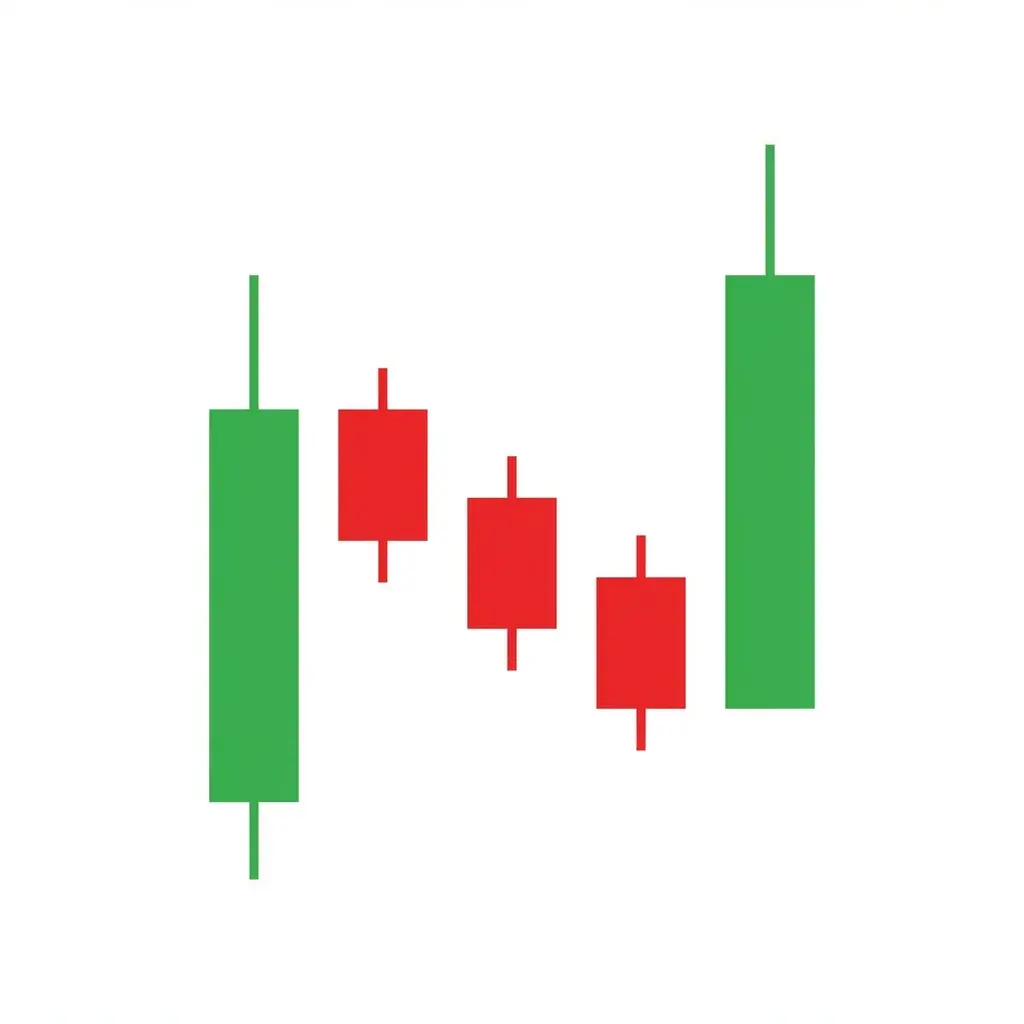
What It Looks Like
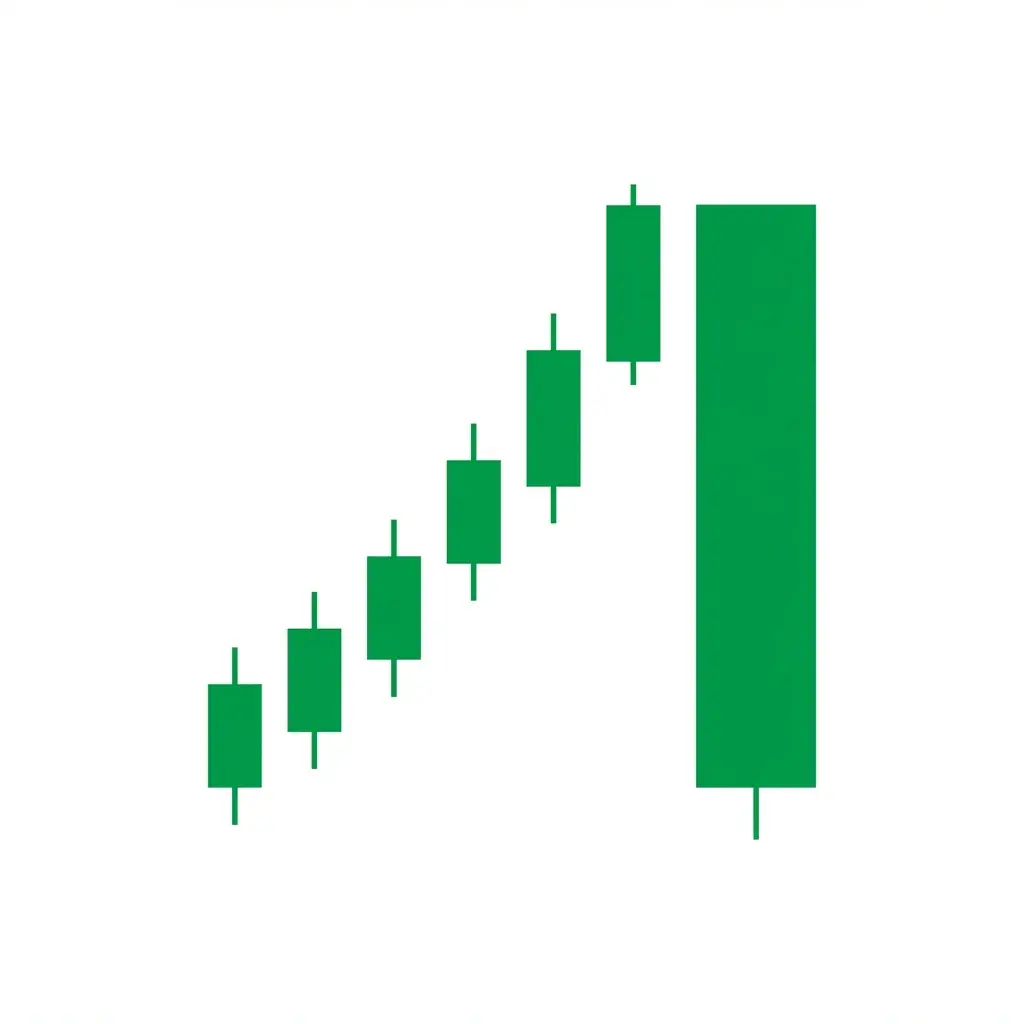
The rising three methods is a five-candle formation that appears during an established uptrend. It begins with a tall bullish candle that represents strong buying pressure. This is followed by three small-bodied candles, typically bearish, that drift lower but remain entirely within the range of the first candle. The pattern completes with another strong bullish candle that closes above the high of the first candle, confirming the continuation.
What It Signals
This pattern reveals a market where bears attempted a counterattack but lacked the conviction to push price below the support established by the initial bullish candle. The three small candles represent profit-taking by short-term traders, not a genuine shift in sentiment. When the final bullish candle breaks above the consolidation range, it confirms that the buyers have regained control and the uptrend is resuming with fresh momentum.
How to Trade It
Enter a long position on the close of the fifth candle or on a break above its high. Place your stop loss below the low of the three consolidation candles, which gives the trade enough room to breathe without excessive risk. Target a move equal to the height of the first bullish candle projected from your entry, or trail your stop to ride the trend further. This pattern is particularly powerful on the daily and 4-hour timeframes.
2. Falling Three Methods
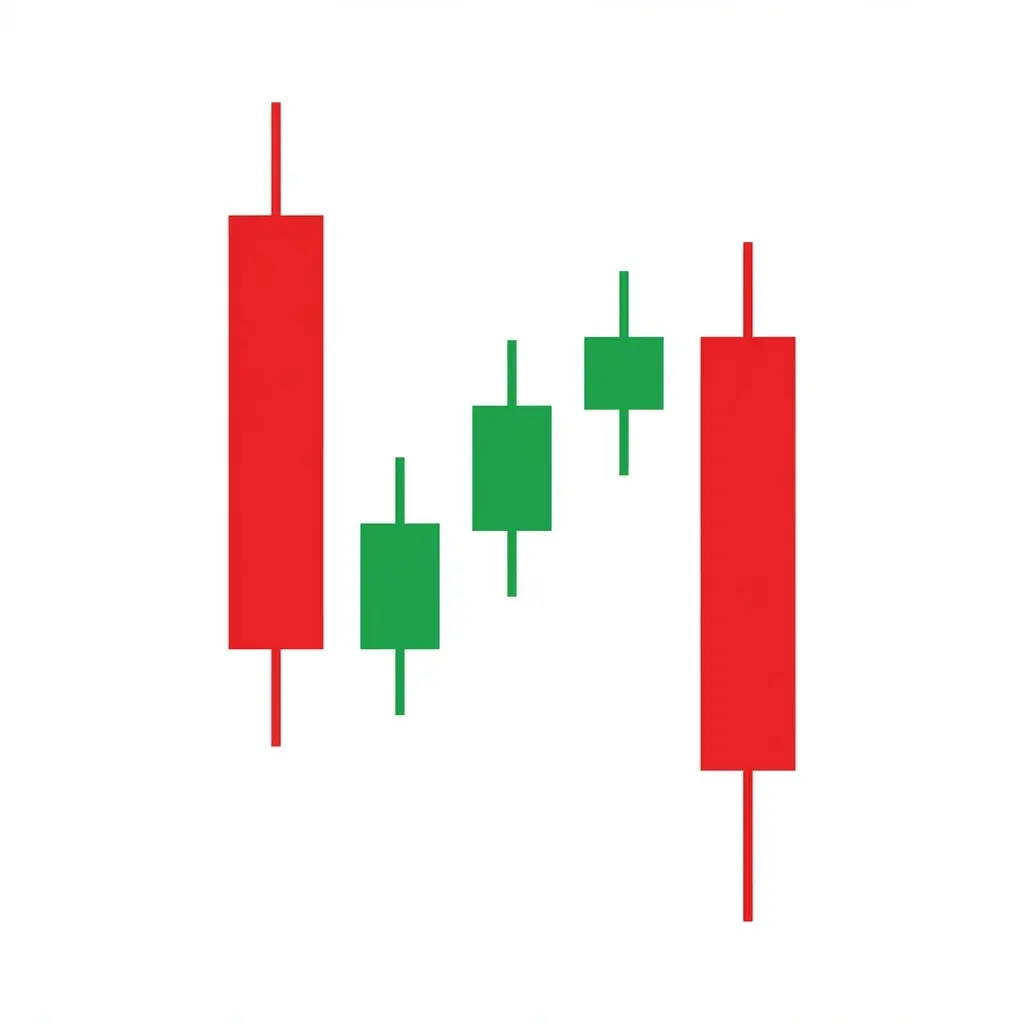
What It Looks Like
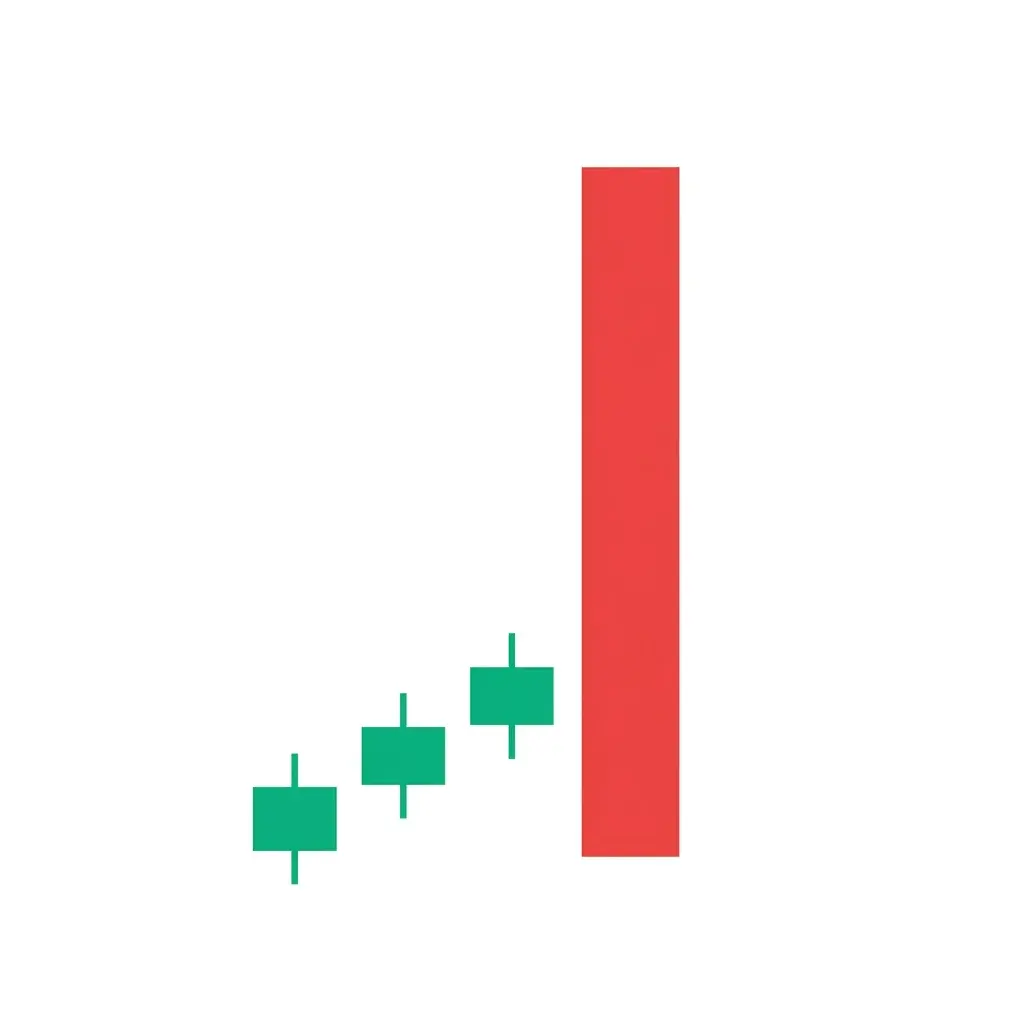
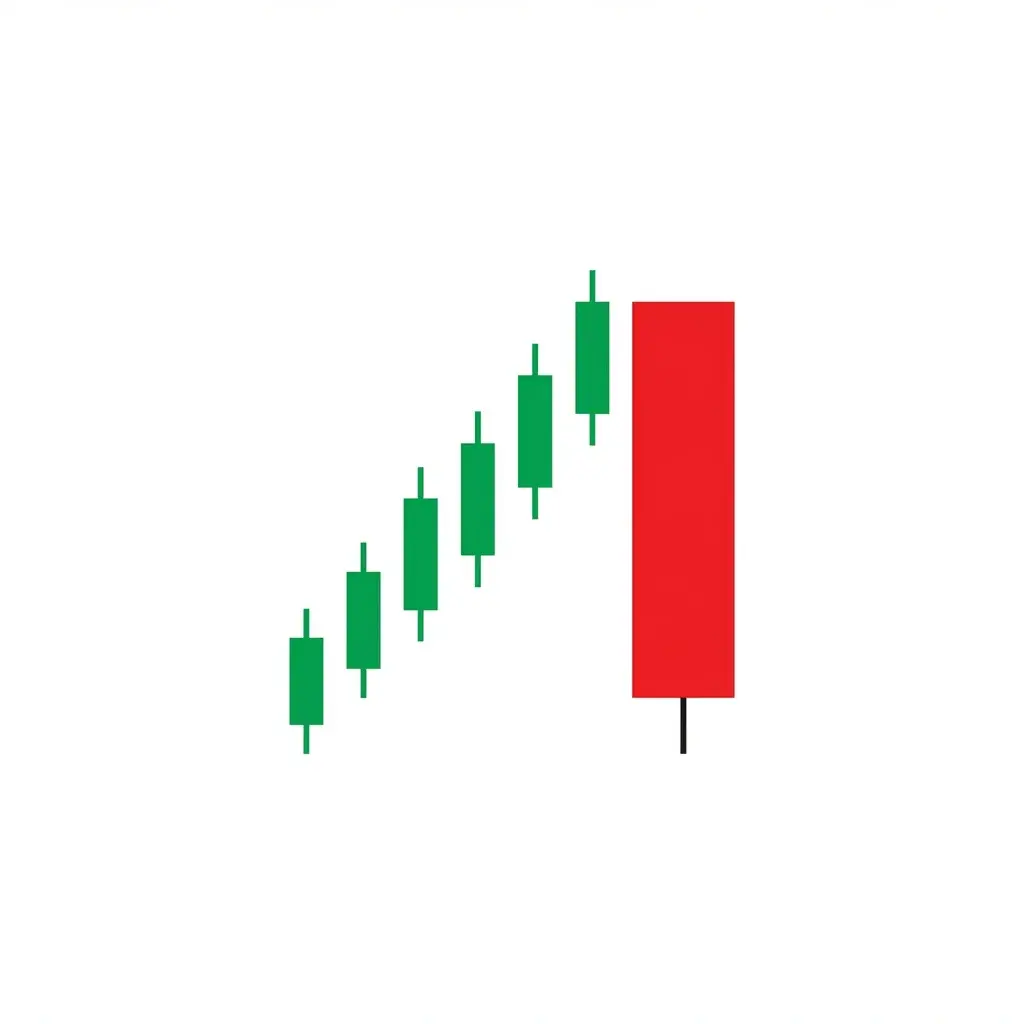
The falling three methods is the bearish mirror of the rising three methods. It starts with a long bearish candle showing aggressive selling, followed by three small bullish candles that retrace upward but stay within the range of the first candle. The fifth candle is another strong bearish candle that closes below the low of the initial candle, confirming the downtrend's resumption.
What It Signals
The three small bullish candles are a dead cat bounce, a temporary relief rally driven by short covering and bargain hunters. The key observation is that these buyers could not push the price above the resistance set by the first bearish candle. When sellers drive the price to new lows on the fifth candle, it confirms overwhelming bearish conviction and usually triggers a fresh wave of selling as stops below the consolidation get hit.
How to Trade It
Enter short on the close of the fifth candle or on a break below its low. Set your stop loss above the high of the three consolidation candles. Your initial target should be the measured move of the first bearish candle projected downward from entry. In strong downtrends, consider trailing your stop using the 20-period EMA to capture extended moves.
3. Bullish Marubozu
What It Looks Like
The bullish marubozu is a single candle with a large real body and no upper or lower wicks whatsoever. The opening price equals the session low and the closing price equals the session high. This creates a clean, tall green or white candle that stands out immediately on any chart. It is one of the most visually distinctive candles in all of candlestick analysis.
What It Signals
A bullish marubozu represents total buyer dominance from open to close. At no point during the session did sellers manage to push the price below the opening level. This kind of one-sided price action typically occurs after a major catalyst, breakout above resistance, or when institutional buyers are aggressively accumulating. When it appears within an existing uptrend, it signals that momentum is accelerating rather than fading.
How to Trade It
In an uptrend, enter long on a pullback to the midpoint of the marubozu candle or on any subsequent bullish candle that holds above the marubozu's open. Place your stop below the marubozu's low, which should equal its open. Target a measured move of one to two times the marubozu's height. Avoid chasing the entry at the close of the marubozu itself, as a brief retracement often follows before the trend resumes.
4. Bearish Marubozu
What It Looks Like
The bearish marubozu is a full-bodied red or black candle with no upper or lower shadow. The open is at the session high and the close is at the session low. Sellers controlled every moment of the session without a single meaningful bounce. This candle typically has a noticeably larger body than surrounding candles, making it easy to spot on the chart.
What It Signals
A bearish marubozu appearing within a downtrend is a powerful confirmation that sellers are in complete control and there is no meaningful buying interest at current levels. It often occurs when a key support level breaks, triggering cascading stop losses and panic selling. The absence of any lower wick means there was zero attempt by buyers to defend the price at any point during the session.
How to Trade It
Enter short on a retracement to the midpoint or the open of the bearish marubozu. Place your stop above the marubozu's high. Target the measured move of the candle's body projected downward. If volume was significantly above average on the marubozu, the continuation is more likely to be aggressive and you can consider a wider target of 1.5 to 2 times the candle height.
5. Bullish Opening Marubozu

What It Looks Like
The bullish opening marubozu has no lower shadow but may have a small upper wick. The open is exactly at the session low, meaning buyers were in control from the very first trade. The small upper shadow indicates some minor profit-taking near the close, but the overwhelming sentiment throughout the session remained bullish. The body is still significantly larger than the upper wick.
What It Signals
This pattern shows that buyers were eager from the open and never allowed sellers to push the price below the opening level. The small upper wick is merely end-of-session profit-taking, not a sign of weakness. Within an existing uptrend, it confirms that buyers remain committed at higher prices and are willing to step in aggressively at the start of each session. It is slightly less forceful than a pure marubozu but still a strong continuation signal.
How to Trade It
Enter long on the next candle if it holds above the opening marubozu's midpoint. Your stop loss goes below the open of the marubozu, which is also the session low. Target the previous swing high or a 1:2 risk-to-reward ratio. The small upper shadow makes this a slightly better entry opportunity than a full marubozu because you can often enter on a small pullback toward the close.
6. Bearish Opening Marubozu
What It Looks Like
The bearish opening marubozu has no upper shadow, meaning the open equals the session high. It may have a small lower wick where some buyers stepped in briefly near the close, but the body dwarfs this minor shadow. Sellers were in command from the opening trade and maintained pressure throughout the entire session. The candle has a decisively bearish appearance.
What It Signals
This pattern signals aggressive selling from the moment the market opens. There was no attempt by bulls to push price above the opening level, indicating overwhelming supply. The small lower wick represents minor short covering near the close, which is normal and does not diminish the bearish signal. In a downtrend, this confirms that sellers remain firmly in control and the path of least resistance continues lower.
How to Trade It
Enter short on a pullback into the upper half of the candle's body on the following session. Place your stop above the open of the marubozu. Target the next support level or use a measured move equal to the candle's body. The small lower wick actually provides a slightly better risk-to-reward because you know buyers will briefly attempt a bounce that you can fade.
7. Bullish Closing Marubozu
What It Looks Like
The bullish closing marubozu has no upper shadow, meaning the close equals the session high. It may have a small lower wick where sellers briefly pushed the price below the open early in the session. The defining characteristic is that buyers drove the price relentlessly higher throughout the session and closed at the absolute peak. No profit-taking occurred at the close, which is a powerful sign of commitment.
What It Signals
Closing at the high of the session is one of the strongest bullish signals in candlestick analysis. It means that even at elevated prices, buyers saw no reason to take profits. This typically indicates that institutional traders are building positions and expect significantly higher prices ahead. The lower wick shows an early test by sellers that was quickly and decisively rejected, which actually strengthens the bullish case.
How to Trade It
Enter long at the open of the next candle since the close at the high suggests immediate follow-through. Place your stop below the lower wick of the closing marubozu. Because the candle closed at its high, the next session often gaps up or opens with immediate buying pressure, making this one of the most actionable continuation entries. Target a 1:2 or 1:3 risk-to-reward ratio.
8. Bearish Closing Marubozu
What It Looks Like
The bearish closing marubozu closes at its session low with no lower shadow. It may have a small upper shadow from an early attempt by buyers to push the price higher, but sellers overwhelmed them and drove the price down to close at the absolute bottom of the range. The body is large and decisively bearish, leaving no ambiguity about who controlled the session.
What It Signals
Closing at the low is the bearish equivalent of maximum conviction. Sellers did not cover their shorts or take profits at the close, which means they expect even lower prices in the next session. This pattern frequently precedes gap-down opens and panic selling. The small upper wick shows that the market gave buyers a brief opportunity, and they failed to capitalize, which reinforces the bearish thesis.
How to Trade It
Enter short at the open of the next session or on any pullback that stays below the midpoint of the closing marubozu. Stop loss goes above the upper shadow. Target the next major support level or use a measured move. Because the close was at the low, you can often expect immediate follow-through selling, so market orders at the next open work well for this pattern.
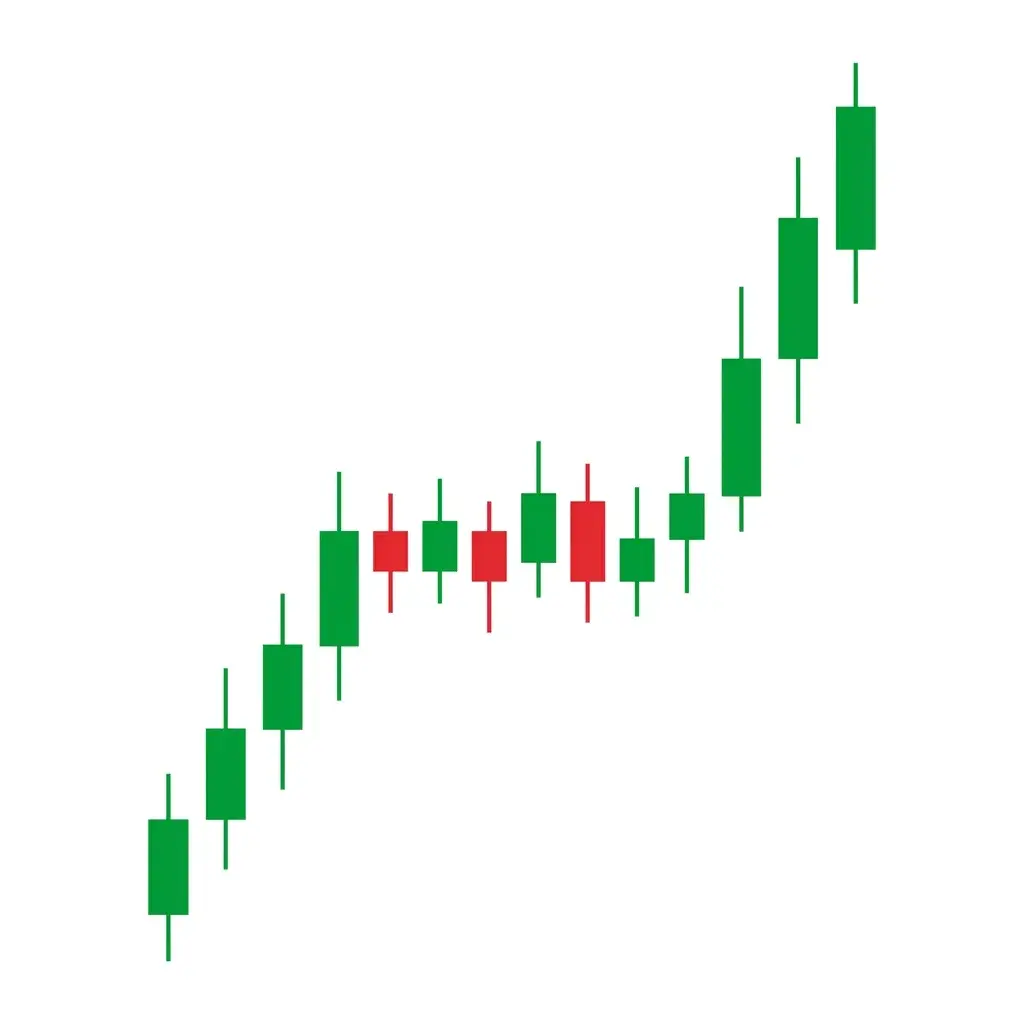
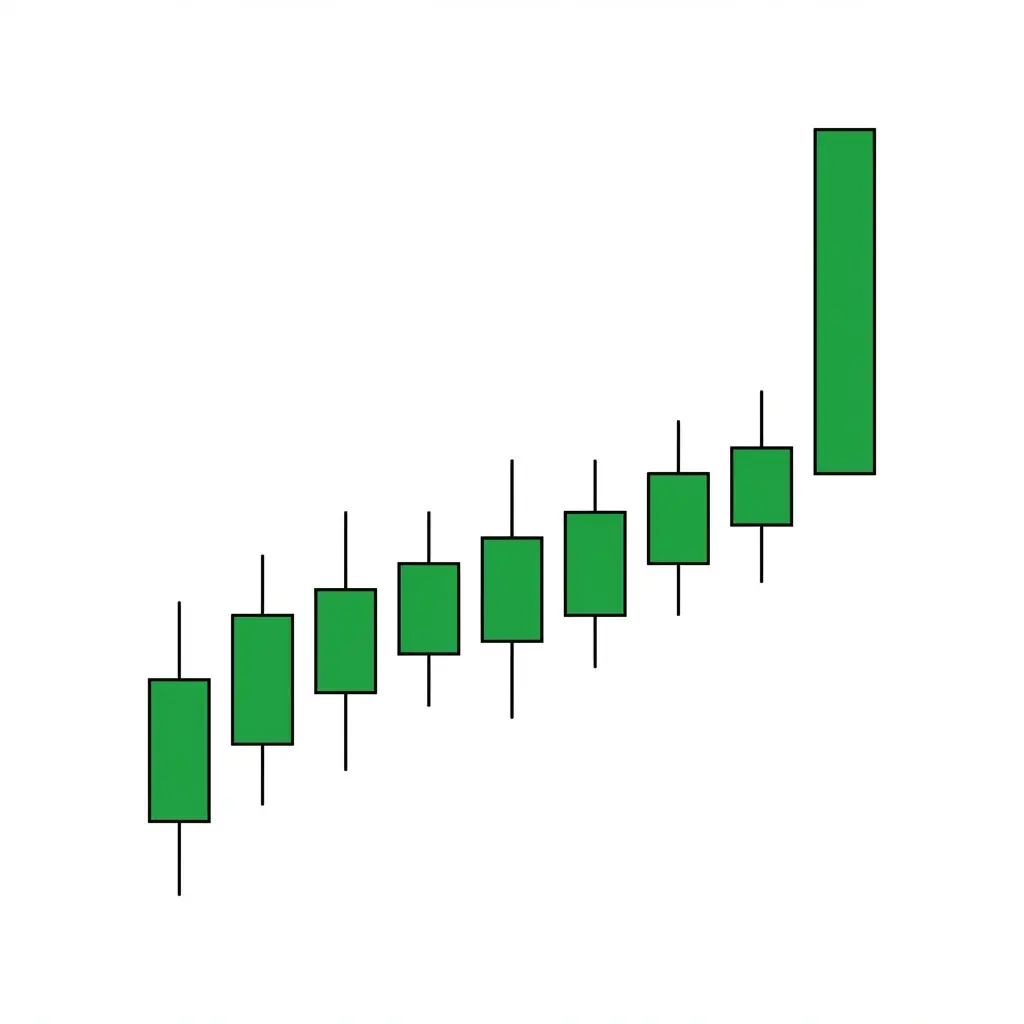
9. Staircase Up
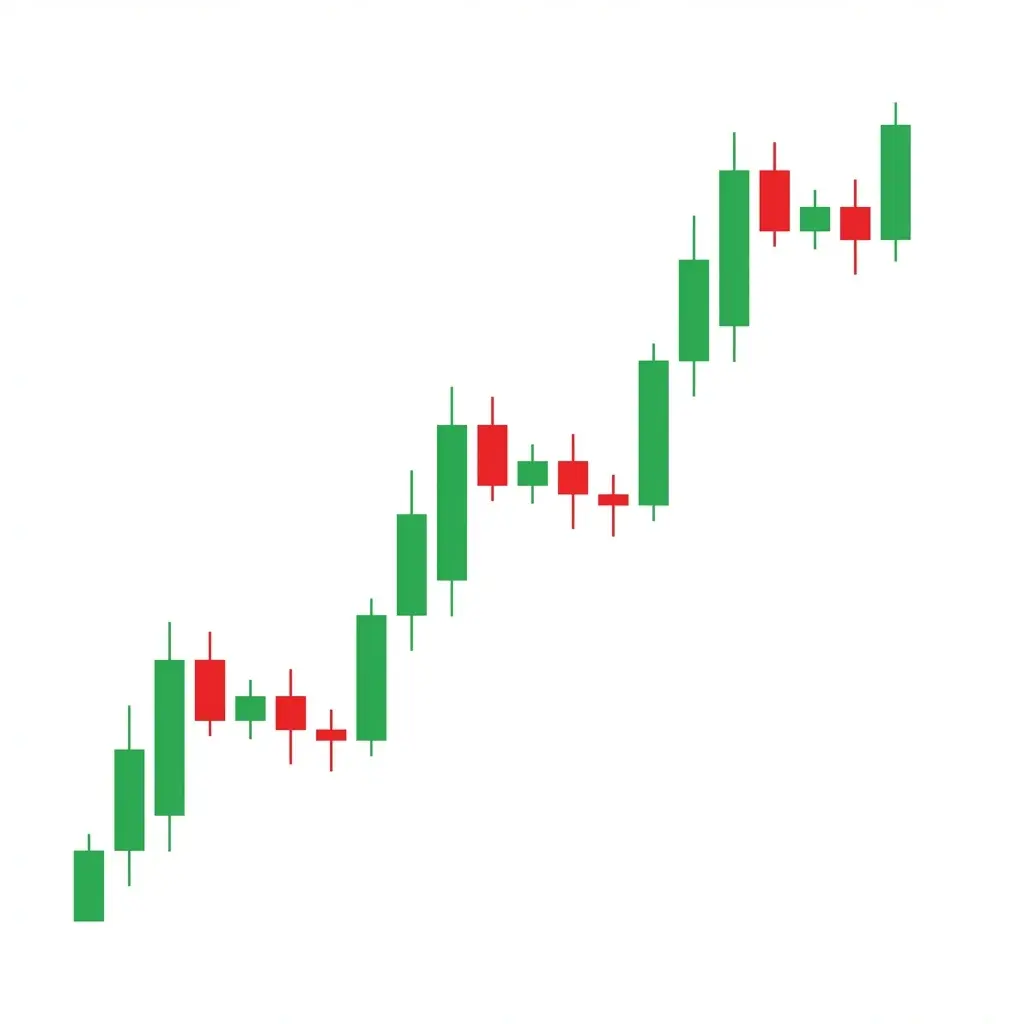
What It Looks Like
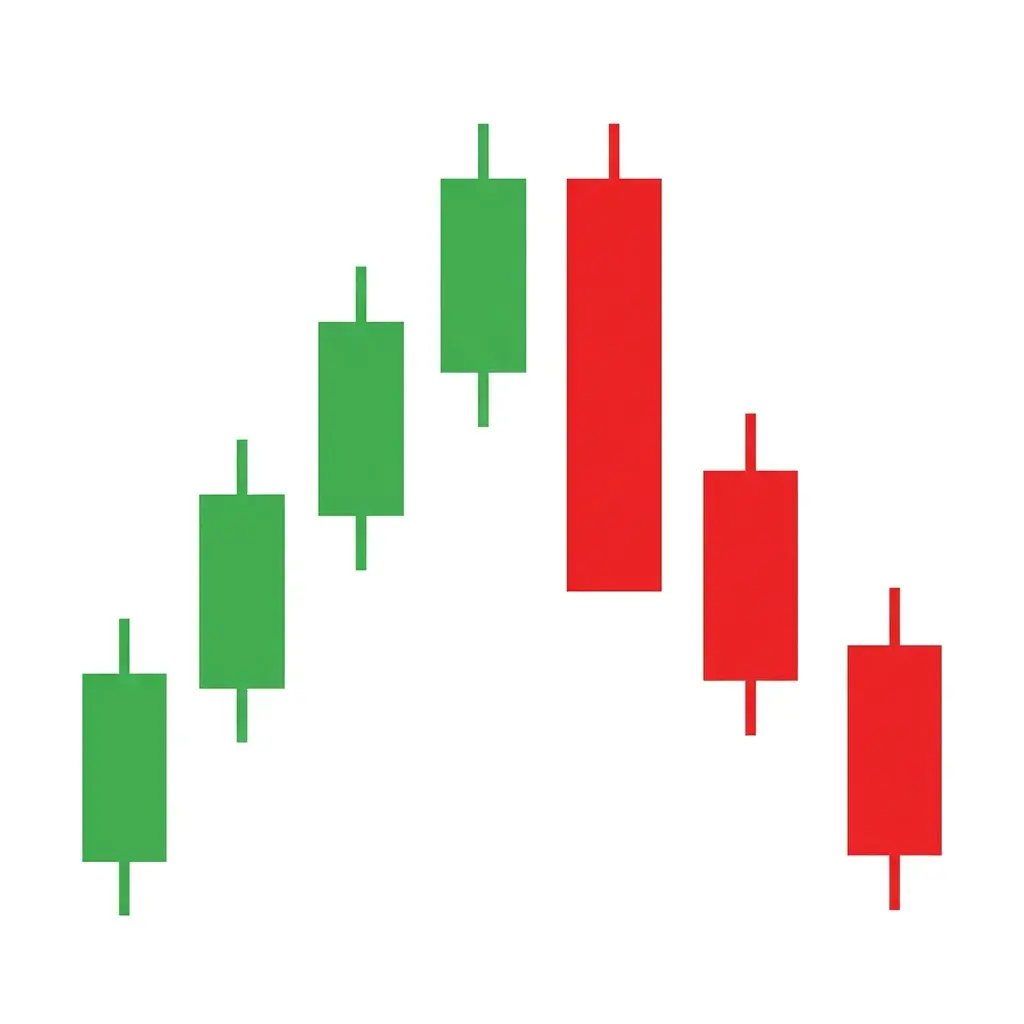
The staircase up pattern is a series of candles that form a step-like progression higher. Each candle or group of candles makes a higher high and a higher low than the previous set, creating a visual resemblance to steps climbing upward. The candles are typically moderately sized with bodies in the upper portion of their range. There are no violent spikes or erratic movements, just a steady, methodical climb.
What It Signals
The staircase up is the healthiest form of an uptrend. It shows that buying pressure is consistent and orderly rather than driven by panic or FOMO. Institutional traders love staircase trends because they allow for gradual position building without pushing price too far too fast. Each "step" represents a mini-consolidation where supply is absorbed before the next leg higher. This is the type of trend that can persist for weeks or months.
How to Trade It
Enter long at each "step" level when price pulls back to the previous high, which now acts as support. Place your stop below the most recent step low. The beauty of staircase patterns is that they allow you to add to winning positions at each step, compounding your exposure as the trend proves itself. Trail your stop below each new step low to lock in profits while staying in the trade.
10. Staircase Down
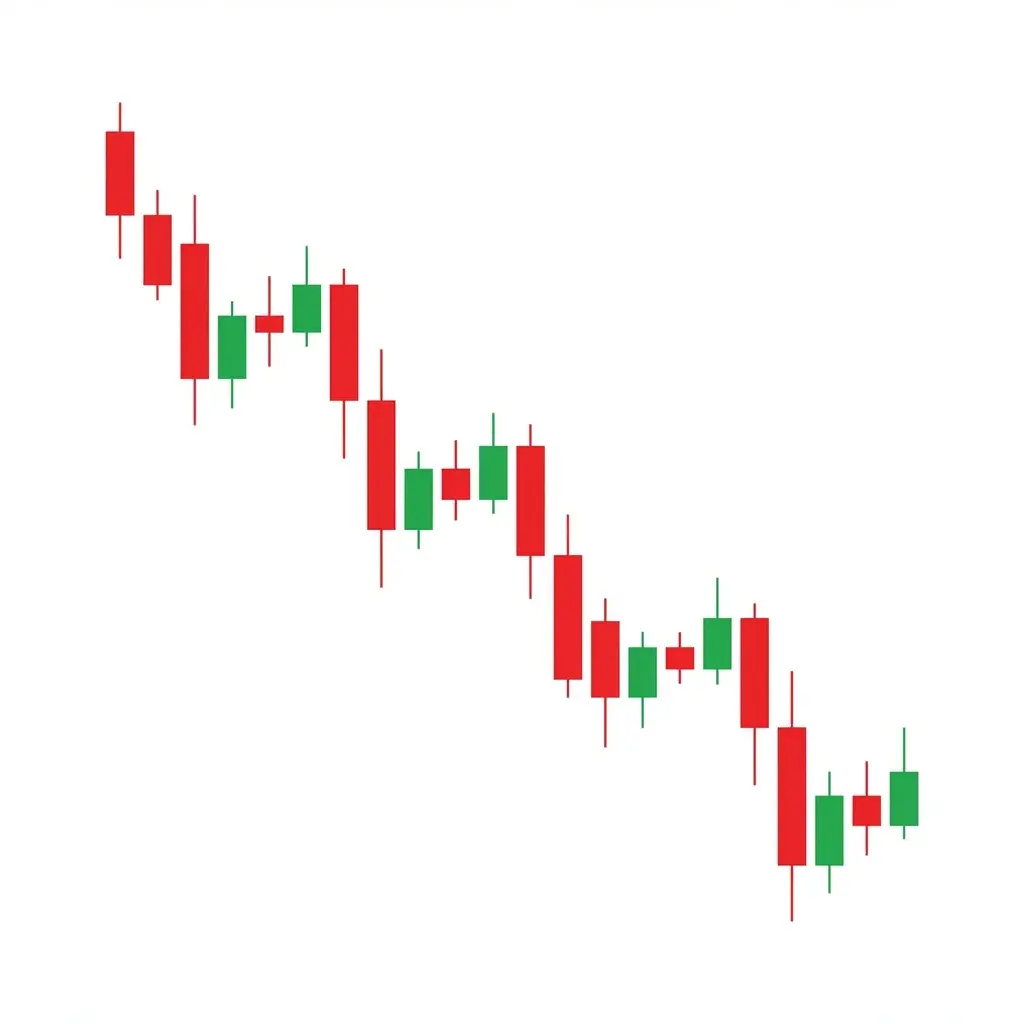
What It Looks Like
The staircase down is the bearish counterpart, showing a methodical step-like descent. Each group of candles makes a lower low and a lower high than the previous group. The progression is orderly, not panicked, with moderate-sized candles and no extreme wicks. The visual effect is unmistakable: a staircase leading progressively lower.
What It Signals
A staircase down shows that sellers are in no rush because they are confident the trend will continue. This is institutional distribution at its most disciplined. Each small bounce is met with fresh selling, and each new low is accepted as the new normal. Unlike panic-driven selloffs that often snap back violently, staircase downtrends can persist for extended periods because they are driven by conviction rather than fear.
How to Trade It
Enter short on bounces to the previous step low, which now acts as resistance. Stop above the most recent step high. Like its bullish counterpart, you can pyramid into positions by adding at each new step, keeping your risk controlled by trailing stops above recent step highs. This approach captures the full extent of methodical downtrends while keeping your initial risk small.
11. Higher Lows
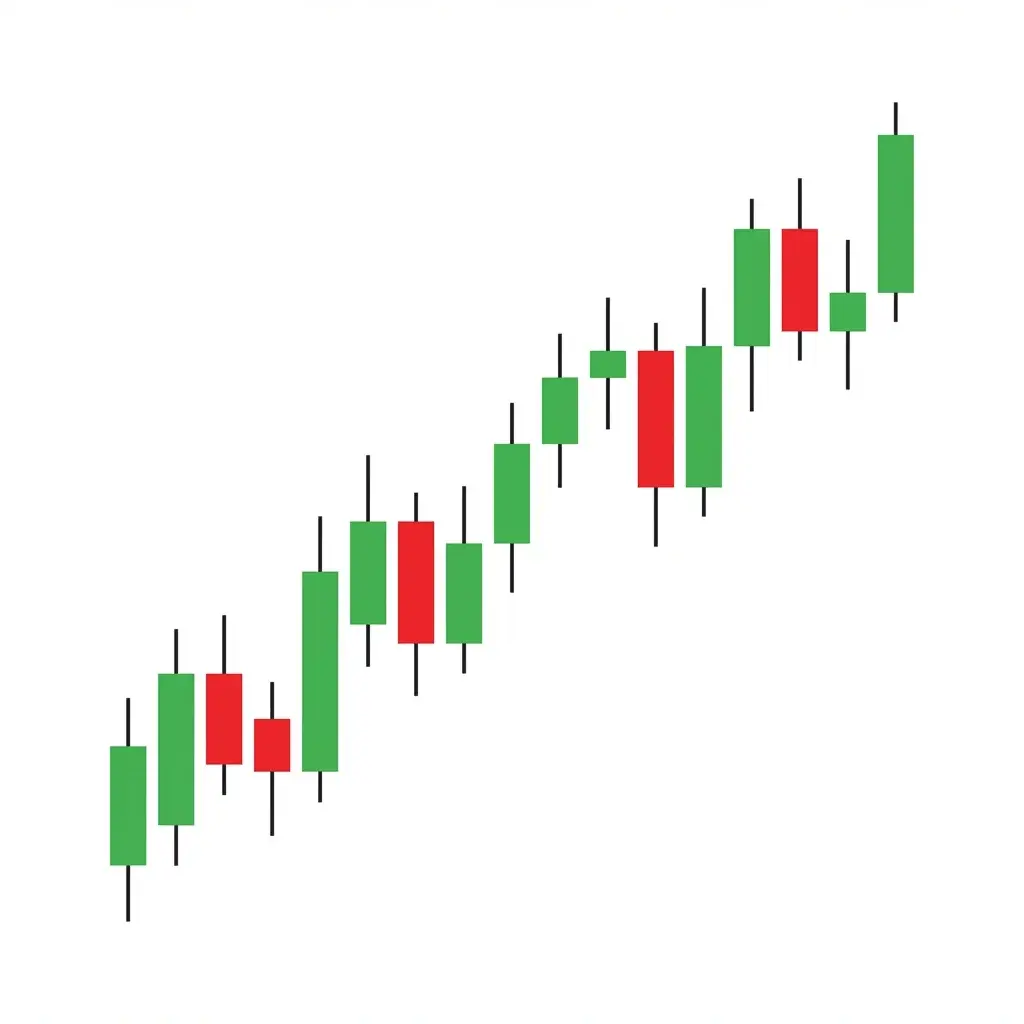
What It Looks Like
The higher lows pattern is identified by connecting two or more swing lows that are progressively higher. Each time the price pulls back, it finds support at a higher level than the previous pullback. Drawing a trendline across these lows creates an ascending support line. The pattern can span several candles or several weeks depending on the timeframe, and it is one of the most fundamental concepts in trend analysis.
What It Signals
Higher lows are the clearest expression of increasing demand. Each time sellers try to push the price down, buyers step in earlier and at higher prices than before. This willingness to buy at progressively higher levels demonstrates growing bullish conviction. Traders who missed the initial move are eager to enter on any dip, which creates the ascending support structure. As long as the series of higher lows remains intact, the uptrend is healthy.
How to Trade It
Enter long when price bounces off the ascending trendline connecting the higher lows. Place your stop loss just below the most recent higher low. Target the previous swing high for a conservative exit or hold for a new high using a trailing stop. The key to this pattern is patience: wait for the price to touch or approach the trendline before entering. Buying in the middle of a leg up gives you a worse risk-to-reward ratio.
12. Lower Highs
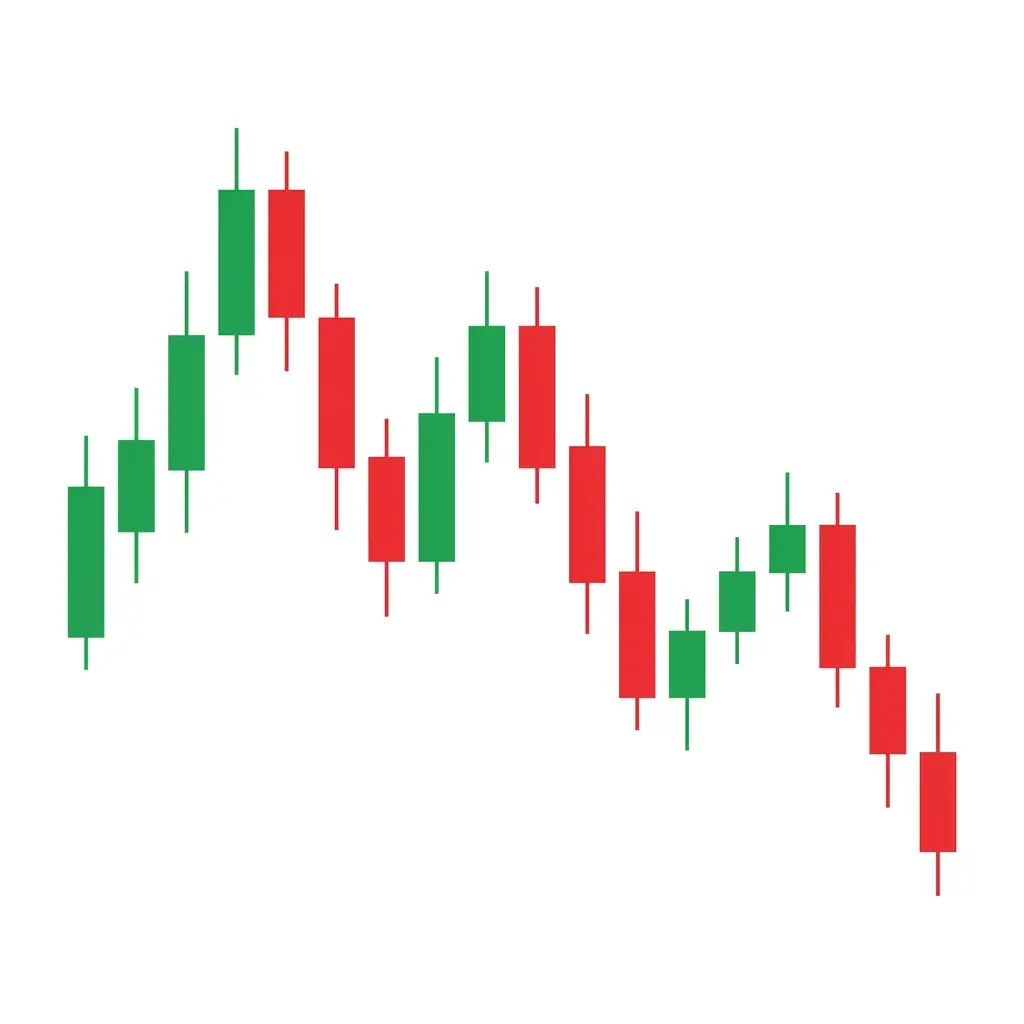
What It Looks Like
The lower highs pattern is the bearish counterpart to higher lows. Each rally attempt peaks at a lower level than the previous rally, creating a descending resistance line when you connect the swing highs. The bounces get weaker and shorter over time, with sellers becoming more aggressive at each successive lower high. This pattern is easily visible on any timeframe and is a cornerstone of downtrend identification.
What It Signals
Lower highs reveal that sellers are growing more confident while buyer conviction is fading. Each bounce attracts fewer buyers and faces heavier selling resistance at progressively lower levels. This creates a self-reinforcing cycle: traders who bought the dip see their positions turn red quickly, adding to selling pressure. Institutional traders use lower highs as confirmation that their short thesis is playing out and often add to positions on each lower high.
How to Trade It
Enter short when price rallies into the descending trendline connecting the lower highs. Your stop goes above the most recent lower high. Target the previous swing low or use a measured move based on the distance between the last two lower highs. This is one of the safest continuation entries because you are selling at resistance with the trend at your back. The pattern invalidates only if price breaks above the most recent lower high.
13. Mat Hold
What It Looks Like
The mat hold is a variation of the rising three methods but with a subtle and important difference. It starts with a long bullish candle, followed by a gap up and then two to three small-bodied candles that drift slightly lower. Unlike the rising three methods where the small candles stay tightly contained, the mat hold candles may trade slightly above the first candle's close. The pattern completes with a strong bullish candle that closes at a new high, confirming the continuation.
What It Signals
The mat hold is considered even more bullish than the rising three methods because the consolidation candles do not retrace as deeply. The gap up after the first candle shows eagerness from buyers, and the subsequent small candles represent only mild profit-taking that does not give back much ground. The market is essentially "holding the mat" at elevated levels, refusing to retrace. This signals that demand far exceeds supply and the trend has significant energy remaining.
How to Trade It
Enter long on the close of the final bullish candle or on a break above its high. Place your stop below the lowest point of the consolidation candles. Because the mat hold signals exceptionally strong momentum, consider using a wider target of 1.5 to 2 times the initial candle height. This pattern is relatively rare but highly reliable, making it one of the most valuable continuation signals for trend followers. Combine it with breakout patterns like flags and pennants for confluence.
Why Trend Continuation Beats Reversal Trading
Every trader faces a fundamental choice: do you trade with the trend or try to pick reversals? The data overwhelmingly favors continuation trading, and here is why.
Higher Win Rate
Continuation setups typically produce win rates between 60% and 70% because you are trading in the direction of the dominant force. Reversal trades often succeed only 30% to 40% of the time because trends persist far more often than they reverse. The math alone makes continuation the superior strategy for most traders.
Better Risk-to-Reward
When you trade pullbacks within a trend, your stop loss is naturally tight because you are entering near support or resistance. Your target is open-ended because the trend can extend far beyond your initial projection. Reversal traders often need wide stops to survive the volatility around turning points, which skews the risk-to-reward against them.
Psychological Edge
Trading with the trend feels natural and reduces psychological stress. You are not fighting the market or hoping for a turn that may never come. Your winners tend to run smoothly, and your losers are usually small and quick. This creates a positive feedback loop that builds confidence and discipline over time.
Compounding Opportunities
Continuation patterns allow you to add to winning positions at each new signal. Patterns like the staircase and higher lows let you pyramid in with risk-controlled entries, amplifying your returns on strong trends. Reversal trading offers no such compounding advantage because you are always entering at points of maximum uncertainty.
This is not to say reversal patterns like morning stars and evening stars are without value. They serve an important role in identifying exhaustion and potential turning points. But the majority of your trading capital and focus should be directed toward continuation setups. Professional trend followers like hedge fund managers and CTAs have built their entire careers around this principle, and the long-term track records speak for themselves.
The bottom line: trends are born from fundamental shifts in supply and demand. Continuation patterns are the market's way of telling you that the fundamental shift is still in play. Learn to read these signals, and you will always be on the right side of momentum.
Frequently Asked Questions
What are trend continuation patterns in trading?
Trend continuation patterns are candlestick formations that signal a temporary pause within an existing trend before price resumes moving in the original direction. Examples include rising three methods, marubozu candles, staircase patterns, higher lows, and the mat hold pattern. They indicate that the prevailing trend is likely to continue rather than reverse.
Why is trading with the trend more profitable than reversal trading?
Trading with the trend is statistically more profitable because trends persist more often than they reverse. Continuation setups typically offer a higher win rate of 60% to 70% versus 30% to 40% for reversals, better risk-to-reward ratios since momentum is already on your side, and less psychological stress because you are aligned with the dominant market force rather than fighting it.
What is the rising three methods candlestick pattern?
The rising three methods is a five-candle bullish continuation pattern. It consists of a strong bullish candle, followed by three small-bodied bearish candles that stay within the range of the first candle, and a final strong bullish candle that closes above the first candle's high. It signals that bears attempted a pullback but failed, and the uptrend is resuming with conviction.
What is a marubozu candle and what does it signal?
A marubozu is a candlestick with little to no wicks, meaning the open and close are at or near the high and low of the session. A bullish marubozu opens at the low and closes at the high, showing total buyer dominance. A bearish marubozu opens at the high and closes at the low, showing total seller control. Marubozu candles signal strong momentum and conviction in the current trend direction.
How do you identify a higher lows pattern for trend confirmation?
A higher lows pattern is identified by connecting two or more swing lows where each successive low is higher than the previous one. This creates an ascending support line showing that buyers are stepping in at progressively higher prices, which confirms bullish trend strength. Traders enter long positions on bounces from the ascending support with stop losses placed below the most recent higher low.
Trend following is the closest thing to "easy mode" in trading. Not because it's easy, but because the math is on your side. These 13 patterns are your toolkit for finding re-entries when everyone else is panicking about pullbacks. The trend is doing the hard work - you just have to hop on and manage your risk.
See also: breakout patterns for when the trend kicks off, and triple candle patterns for stronger confirmation signals.
ChartSnipe can scan your charts for continuation patterns, reversals, and breakouts automatically. Give it a try.