Doji Candlestick Patterns: Complete Trading Guide
Master every type of doji candle, understand what market indecision really means, and learn how professional traders use doji patterns to time entries and exits.
A doji candlestick forms when the opening and closing prices are virtually the same, creating a candle with little to no body. It represents the ultimate standoff between buyers and sellers: both sides pushed hard during the session, but neither could gain a lasting advantage. The result is a draw, and the market pauses to reconsider its direction.
But here is the critical insight most traders miss: a doji by itself is not a trading signal. Doji patterns only become actionable when you combine them with trend context, support and resistance levels, and volume confirmation. A doji at the top of an extended uptrend near a major resistance level tells a completely different story than a doji in the middle of a sideways consolidation.
In this guide, we cover all 12 types of doji and indecision candles, explain the psychology behind each pattern, and show you exactly how to trade them. Whether you are trading forex, stocks, or crypto, understanding these patterns will sharpen your ability to identify turning points before they happen. If you are also interested in reversal setups, check out our guides on bullish reversal candlestick patterns and bearish reversal candlestick patterns.
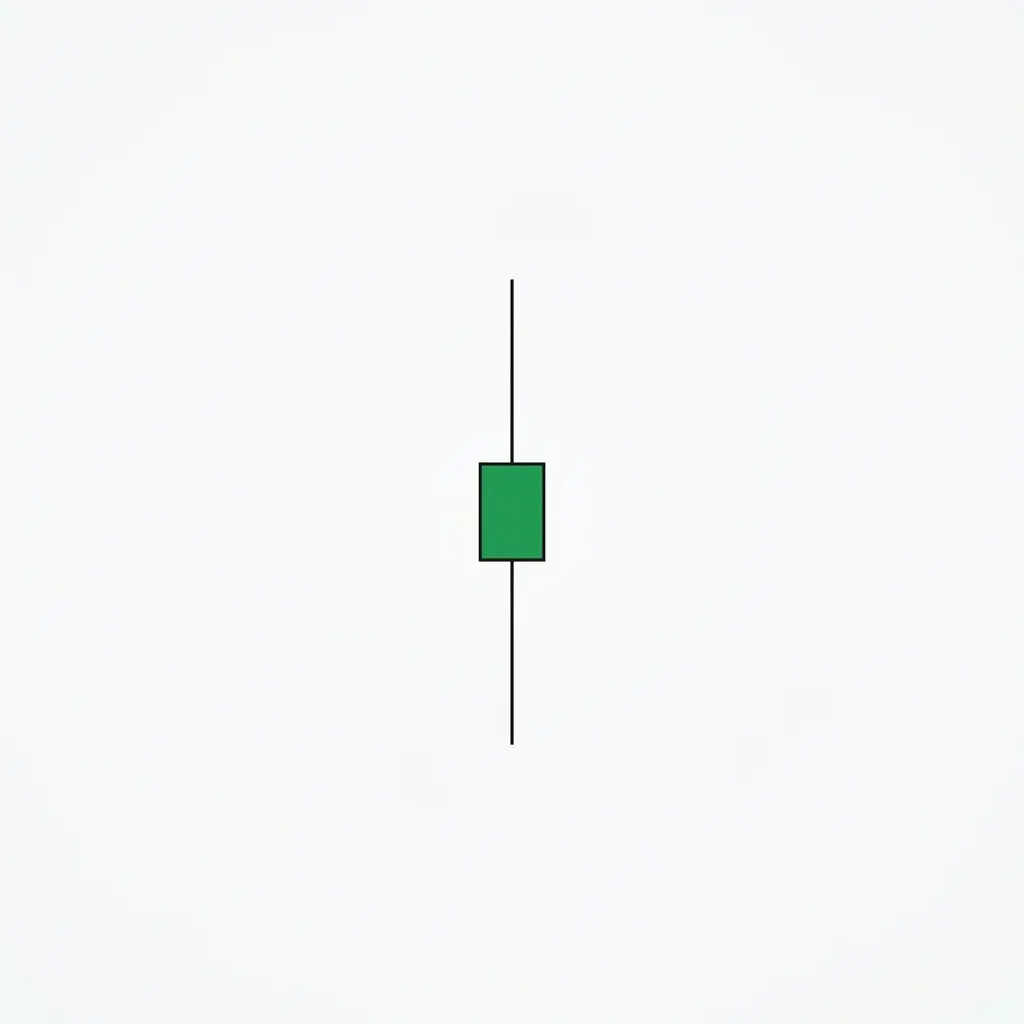
1. Standard Doji
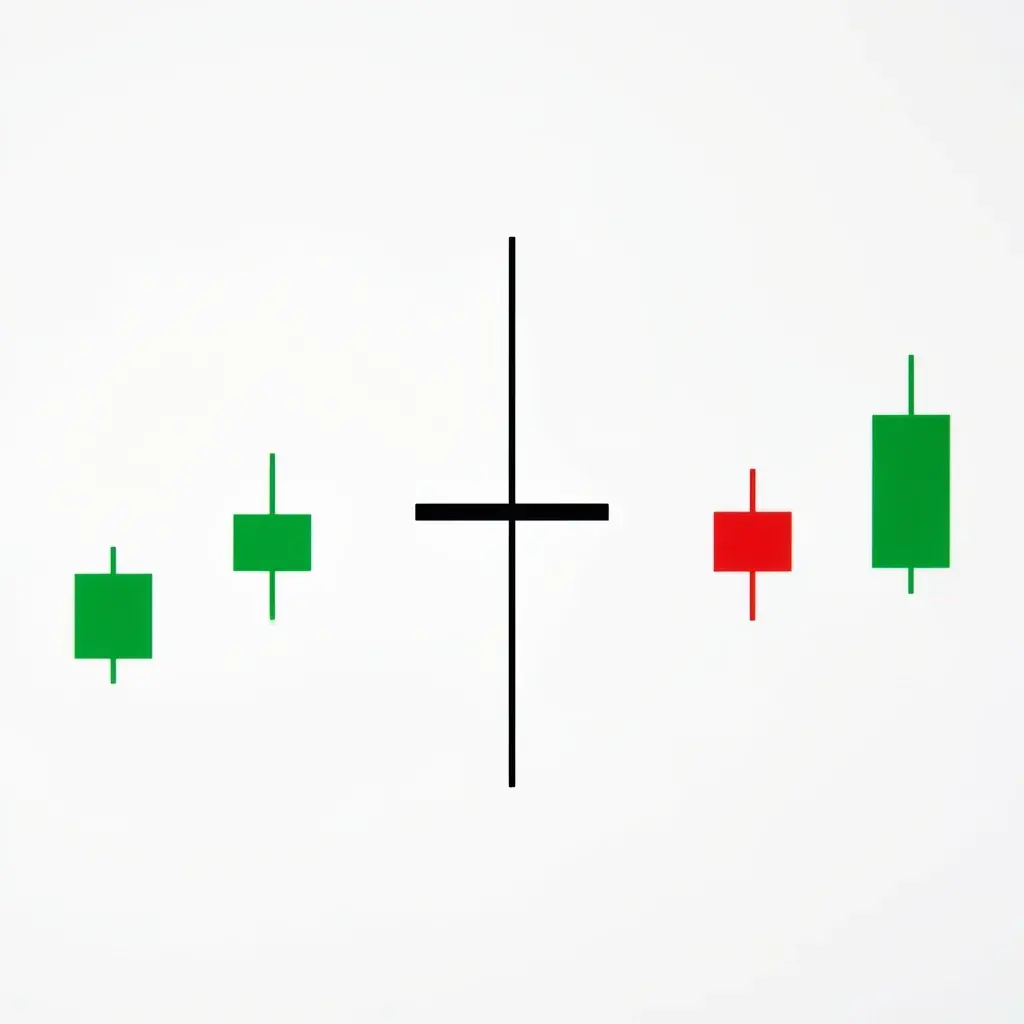
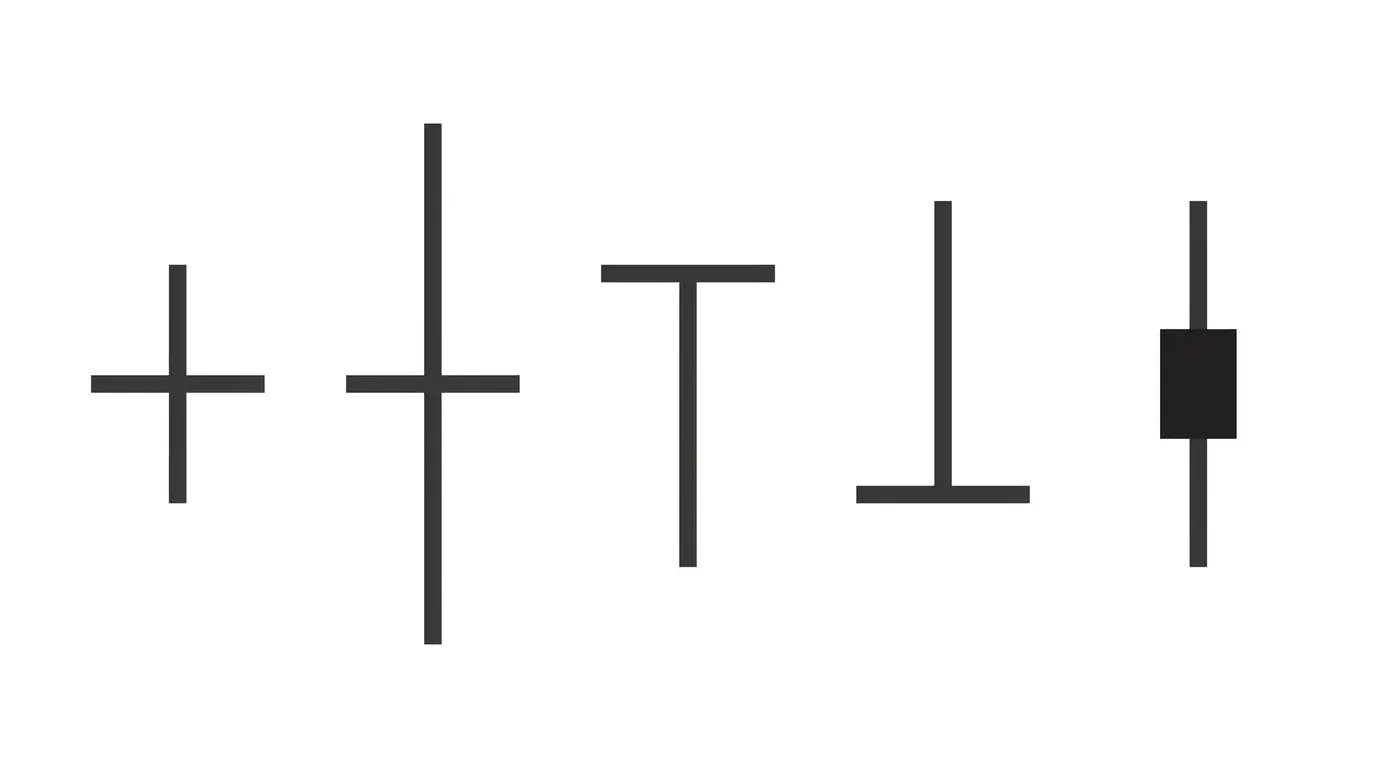
What it looks like: The standard doji has a virtually nonexistent body, with the open and close at the same price or within a few ticks of each other. The upper and lower shadows are roughly equal in length and relatively modest in size. It resembles a plus sign or a cross on the chart.
What it signals: This is the purest expression of market indecision. Buyers pushed the price higher during the session and sellers pushed it lower, but ultimately the market returned to its starting point. When a standard doji appears after a strong trend, it suggests that the dominant side is losing momentum and the opposing side is gaining strength.
How to trade it: Never trade a standard doji in isolation. Look for it at key support or resistance levels after an extended move. Wait for the next candle to confirm direction: a strong bullish close after a doji at support is your entry signal for a long position, while a bearish close after a doji at resistance confirms a short. Place your stop-loss beyond the doji's shadow on the opposite side of your trade.
2. Long Legged Doji
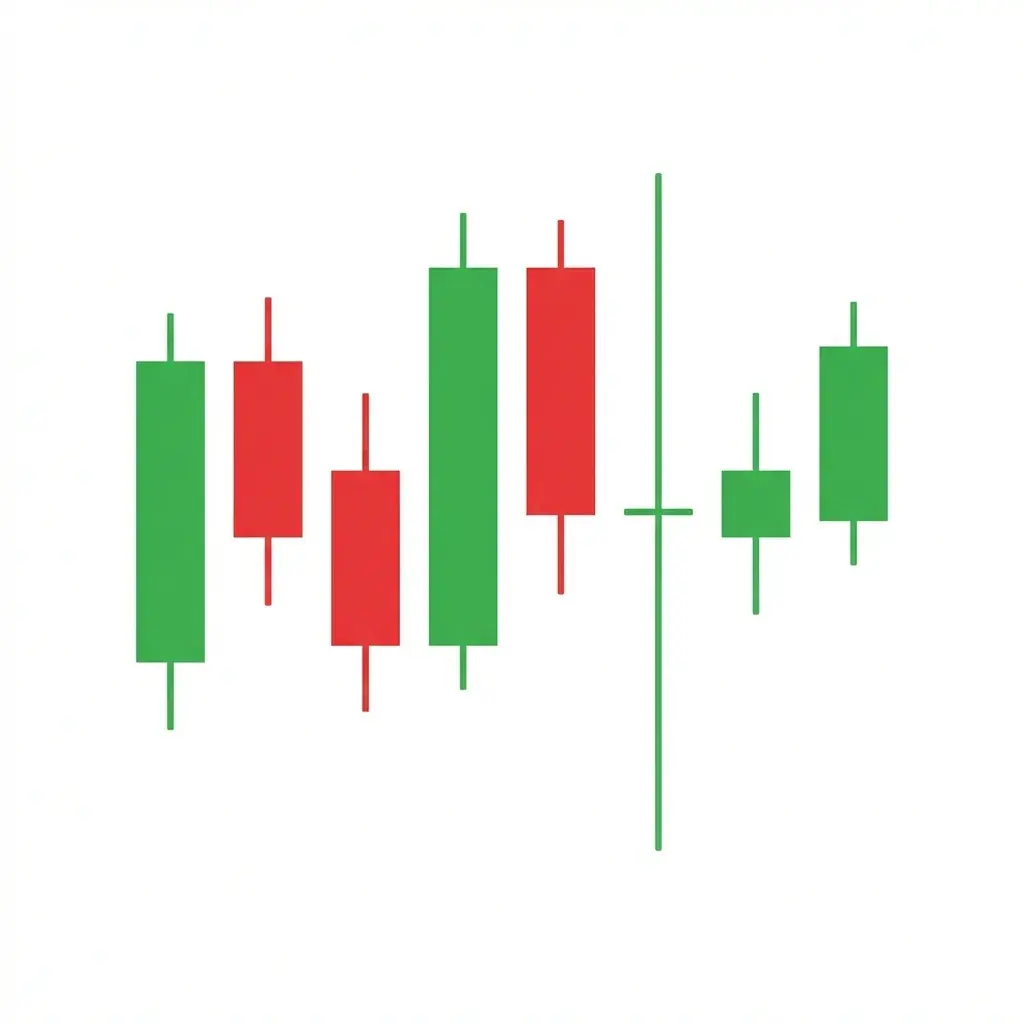
What it looks like: The long legged doji features exceptionally long upper and lower shadows that dwarf the candles around it, with a tiny body positioned near the midpoint. The overall range of the candle is significantly wider than the average session, indicating that the price traveled a great distance in both directions before closing near the open.
What it signals: This pattern reveals extreme volatility and confusion in the market. Both bulls and bears made aggressive moves during the session, creating wide price swings. The fact that the price ended where it started despite all that activity is a powerful sign that neither side has conviction. Long legged dojis often appear at major turning points where the market is deciding on a new direction.
How to trade it: The long legged doji is one of the more reliable doji variants because the extreme range signals that a significant decision is being made. Wait for a confirmation candle that closes beyond one of the shadows. If the next candle closes above the high of the doji, the bulls have won the battle and a rally is likely. If it closes below the low, the bears are in control. The wide range of the candle also provides natural stop-loss placement at the opposite extreme.
3. Four Price Doji

What it looks like: The four price doji is the rarest doji variant. It appears as a single horizontal line on the chart because the open, high, low, and close are all at the exact same price. There are no shadows whatsoever. It is a literal dash on the chart.
What it signals: This pattern indicates absolute zero participation in the market. Neither buyers nor sellers made any meaningful move during the session. The four price doji typically appears in very illiquid markets, during pre-holiday sessions, or in thinly traded instruments. It can also appear just before a major news event when all participants are sitting on the sidelines waiting.
How to trade it: The four price doji itself is rarely tradable because it reflects a lack of market activity rather than a meaningful battle between buyers and sellers. However, it can serve as a valuable warning signal. When you see one, pay attention to what comes next. The subsequent candle often kicks off a sharp directional move as liquidity returns to the market. Trade the breakout from the session following the four price doji, using the prior candle's range for context.
4. Hammer Doji (Dragonfly Doji)
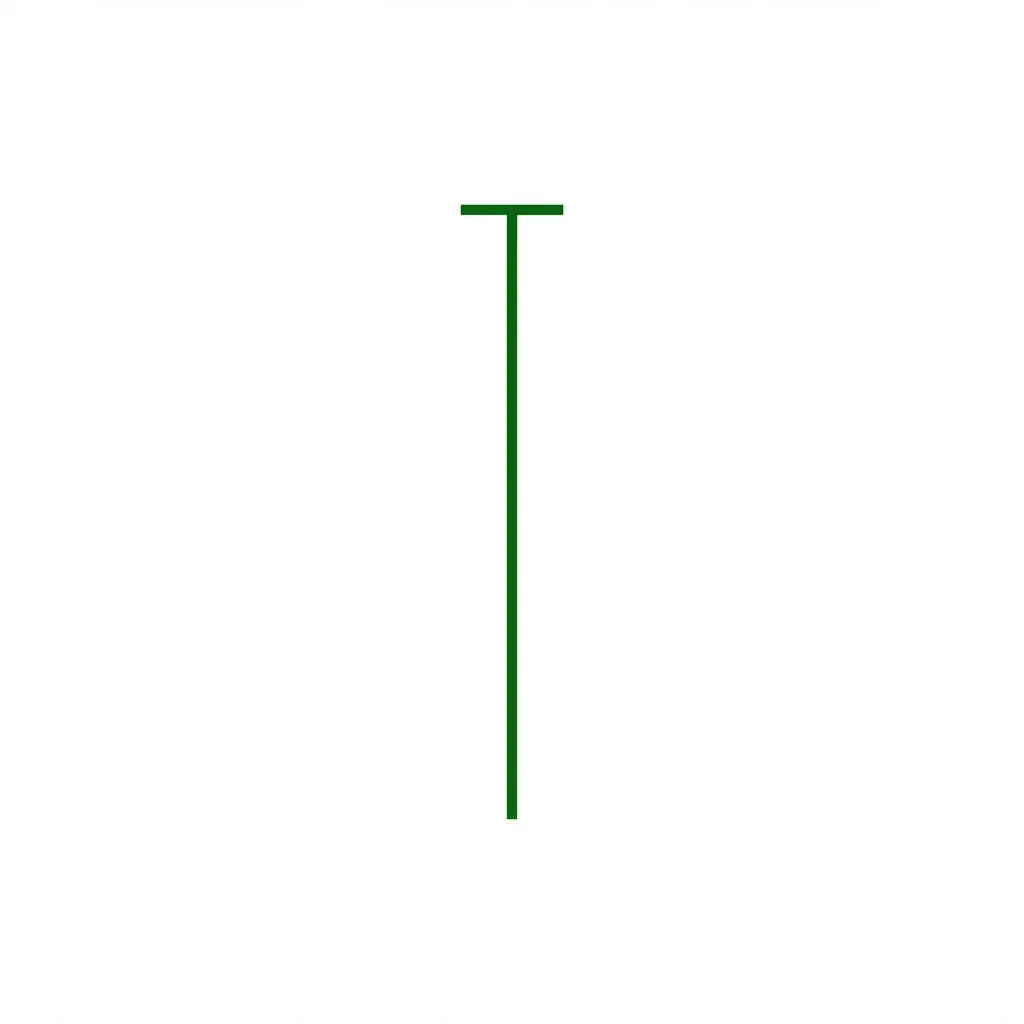
What it looks like: The hammer doji, also known as the dragonfly doji, has a long lower shadow and little to no upper shadow. The open, close, and high are all at or near the same price at the top of the candle. It looks like a capital letter T. The lower shadow should be at least two to three times the length of any visible body.
What it signals: Sellers drove the price significantly lower during the session, but buyers stepped in aggressively and pushed the price all the way back up to the opening level. This shows that despite selling pressure, there is strong demand at lower prices. When the hammer doji appears at the bottom of a downtrend, it indicates that sellers are running out of steam and buyers are ready to take over.
How to trade it: The hammer doji is most powerful at the end of a downtrend, especially when it forms at a known support level or near a moving average. Enter long on the next candle if it closes above the hammer doji's high. Set your stop-loss below the long lower shadow. The risk-to-reward on this setup is often favorable because the shadow defines a clear invalidation level. If the hammer doji appears in an uptrend, it is less meaningful and should be treated as simple continuation indecision.
5. Shooting Star Doji (Gravestone Doji)
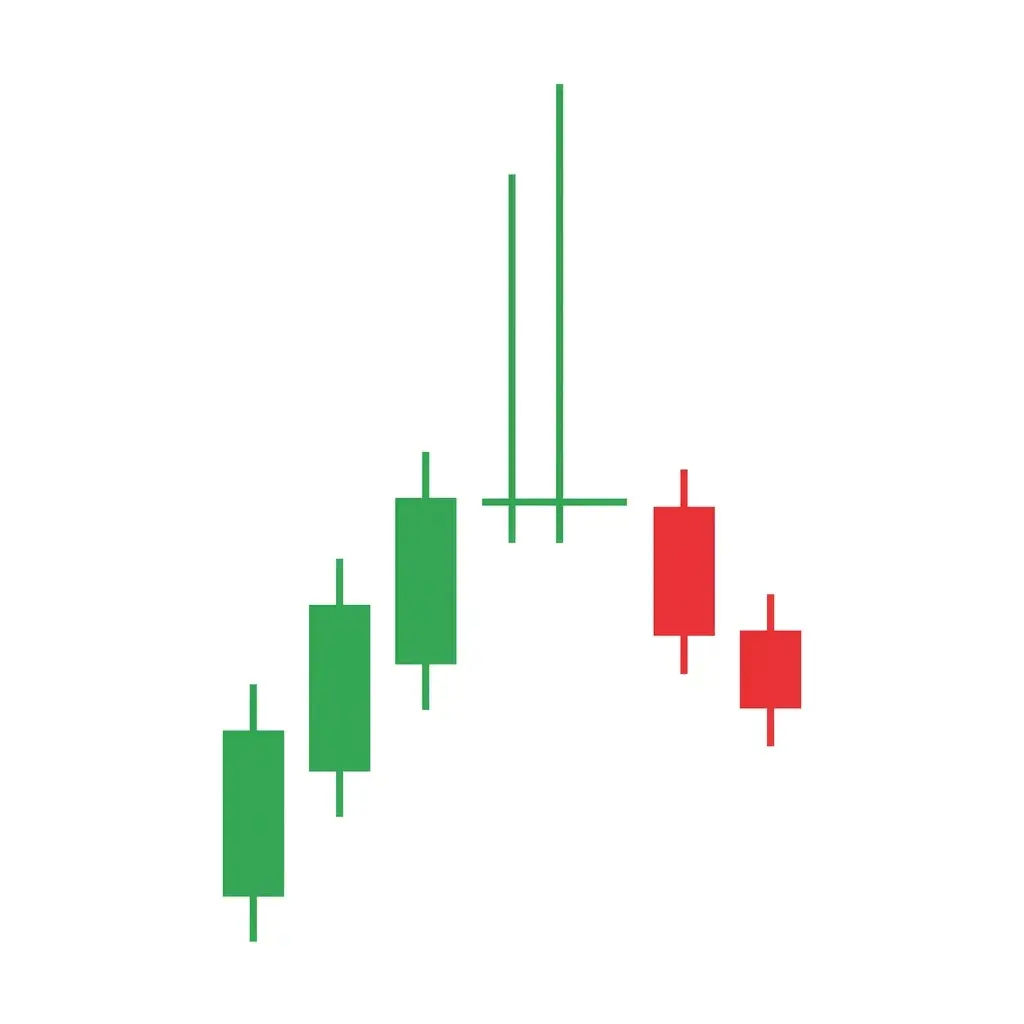
What it looks like: The shooting star doji, also called the gravestone doji, is the mirror image of the hammer doji. It has a long upper shadow and little to no lower shadow. The open, close, and low are all at or near the same price at the bottom of the candle. It looks like an inverted T. The upper shadow should extend at least two to three times the length of any visible body.
What it signals: Buyers pushed the price significantly higher during the session, but sellers overwhelmed them and drove the price all the way back down to the opening level. This demonstrates that despite buying interest, there is heavy supply at higher prices. When the shooting star doji appears at the top of an uptrend, it is a warning that the rally may be exhausting itself and a reversal could follow.
How to trade it: The gravestone doji is most effective at the top of an uptrend, particularly when it forms at a resistance level or psychological price point. Enter short on the next candle if it closes below the gravestone doji's low. Place your stop-loss above the long upper shadow. This pattern works especially well when accompanied by high volume, as it shows that many buyers were trapped at higher prices and are now sitting on losing positions.
6. Northern Doji
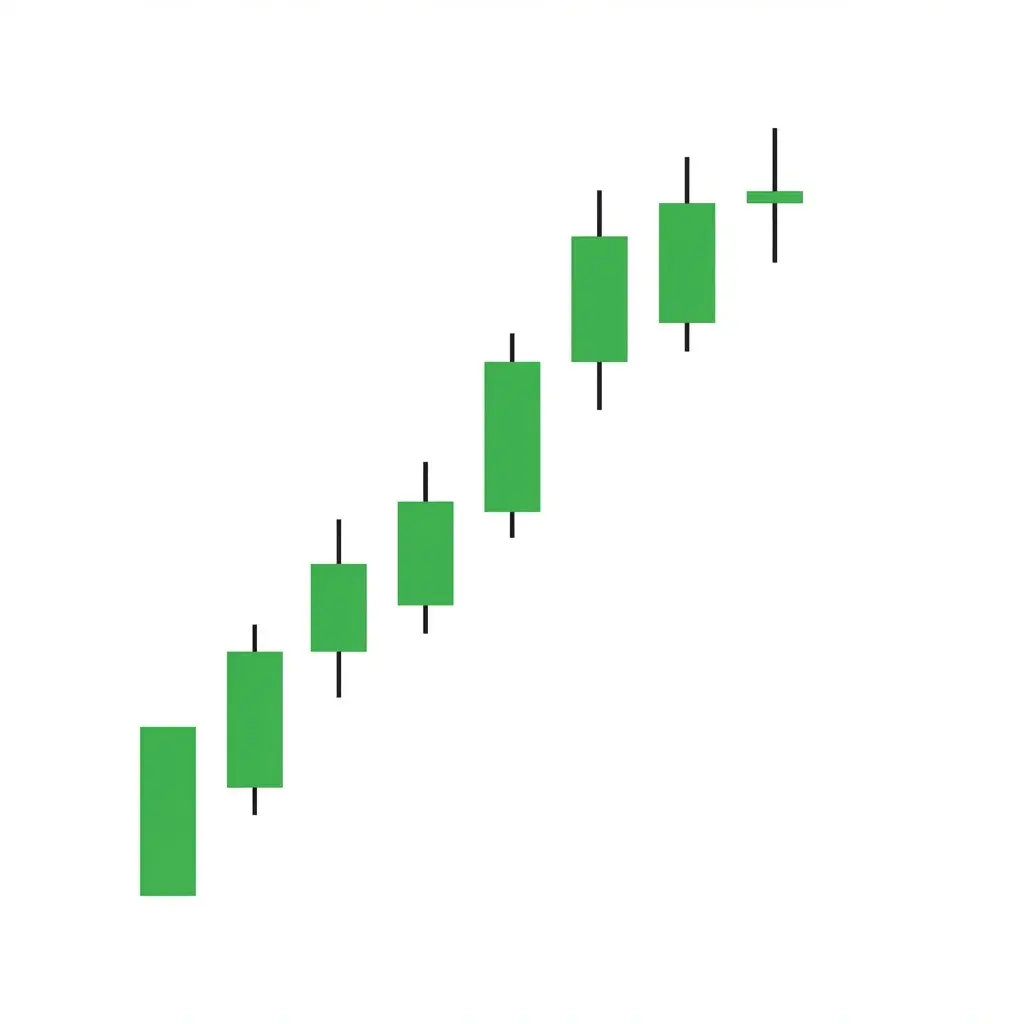
What it looks like: The northern doji is not defined by its shape alone but by its position. It is any doji that forms at the top of an uptrend or near the highs of a price swing. It can be a standard doji, a long legged doji, or even a variant with slightly uneven shadows. The defining characteristic is its location: it sits in "northern" territory, at elevated price levels relative to recent action.
What it signals: A northern doji signals that bullish momentum is fading. After a sustained advance, the appearance of indecision at the highs suggests that buyers are struggling to push prices further while sellers are beginning to emerge. It is a classic early warning of a potential trend reversal or at minimum a significant pullback. The longer the preceding uptrend, the more significant the northern doji becomes.
How to trade it: When you spot a northern doji, tighten your stop-losses on existing long positions. For new short entries, wait for a bearish confirmation candle on the following session. Combine this signal with overbought readings on the RSI or stochastic oscillator for higher probability setups. The northern doji is particularly powerful when it forms at a Fibonacci extension level or a prior resistance zone.
7. Southern Doji
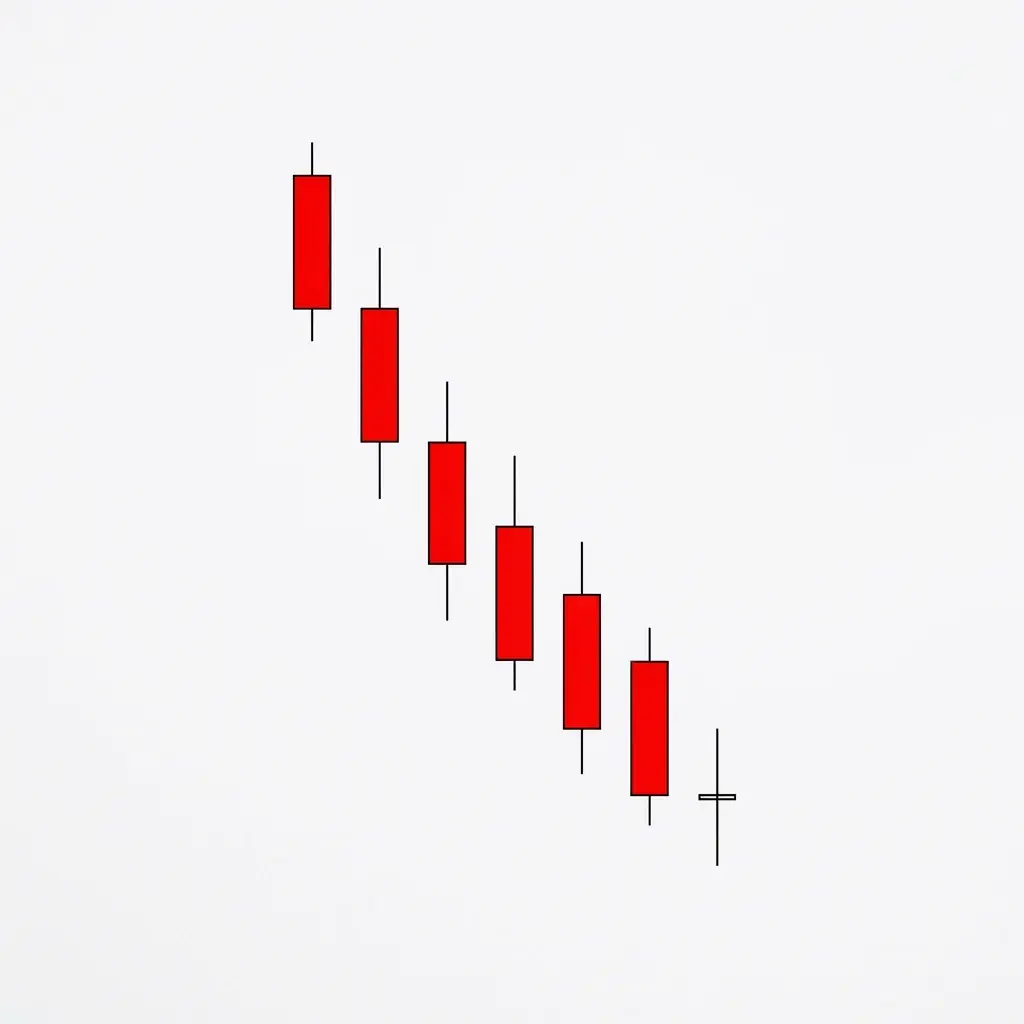
What it looks like: The southern doji is the opposite of the northern doji. It is any doji that forms at the bottom of a downtrend or near the lows of a price swing. Like the northern doji, its shape can vary, but its location is what defines it. It appears in "southern" territory, at depressed price levels after a sustained decline.
What it signals: A southern doji indicates that selling pressure is diminishing. After a prolonged decline, the emergence of indecision at the lows means sellers are running out of ammunition and buyers are beginning to step in. It suggests the downtrend may be approaching its end. The deeper the preceding sell-off and the more oversold the conditions, the more weight a southern doji carries.
How to trade it: Use the southern doji as a signal to start looking for long entries. Wait for a bullish confirmation candle that closes above the doji's high. This pattern works best when it coincides with a strong support level, a rising trendline, or an oversold condition on momentum indicators. Consider scaling into a position rather than going all in, as downtrends can persist even after indecision signals appear.
8. Rickshaw Man
What it looks like: The rickshaw man is a specific variant of the long legged doji where the body sits precisely at the midpoint of the candle's range. The upper and lower shadows are nearly identical in length, and both are significantly longer than average. The symmetry is what distinguishes it from a regular long legged doji, where the body might sit slightly above or below center.
What it signals: The rickshaw man represents the most balanced form of market indecision possible. The price traveled equal distances above and below the opening level, and neither side gained even the slightest edge. This perfect equilibrium often appears at critical inflection points where the market is genuinely torn between continuation and reversal. It is a sign that volatility is high but directional conviction is zero.
How to trade it: The rickshaw man is a strong signal that a decisive move is coming, but it provides no directional clue on its own. The best approach is to set a breakout trap: place a buy order above the high of the rickshaw man and a sell order below the low, with stop-losses on the opposite side. Alternatively, wait for a confirmation candle and trade in the direction of the close. This pattern is most reliable on higher timeframes like the daily or weekly chart.
9. Doji Cluster
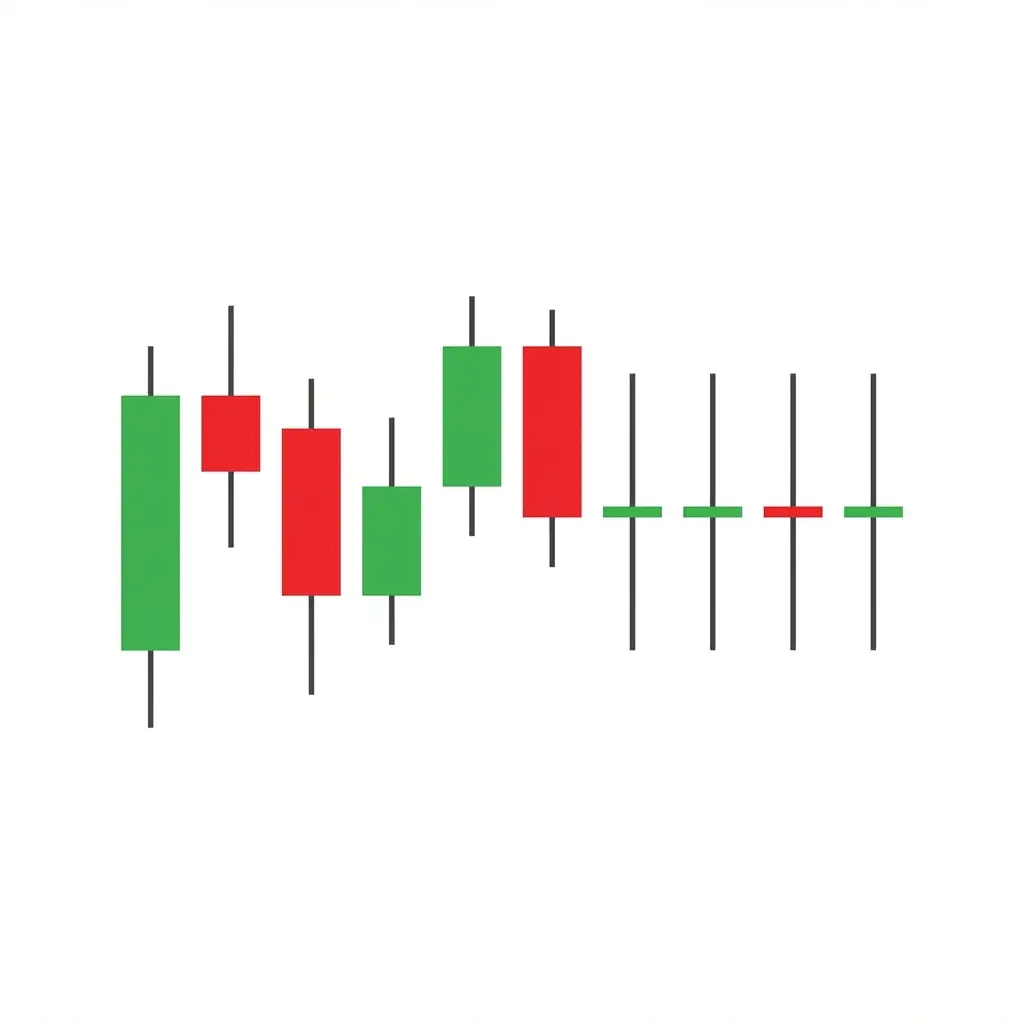
What it looks like: A doji cluster occurs when two or more doji candles appear in consecutive sessions, forming a tight consolidation zone. The candles may be standard dojis, spinning tops, or a mix of doji variants. What matters is that multiple sessions in a row have produced small bodies and relatively contained ranges, creating a visible squeeze or compression on the chart.
What it signals: While a single doji shows one session of indecision, a doji cluster reveals sustained indecision across multiple sessions. This is significant because markets cannot stay indecisive forever. The compression of volatility into a tight range acts like a coiled spring: the longer it compresses, the more explosive the eventual breakout tends to be. Doji clusters often precede the most powerful moves in any market.
How to trade it: Identify the range of the doji cluster by marking the highest high and lowest low across all the doji candles. Trade the breakout when the price closes decisively beyond either boundary. Volume is especially important here: a breakout on high volume has a much greater chance of following through. This pattern is a favorite among breakout traders and works across all timeframes and markets.
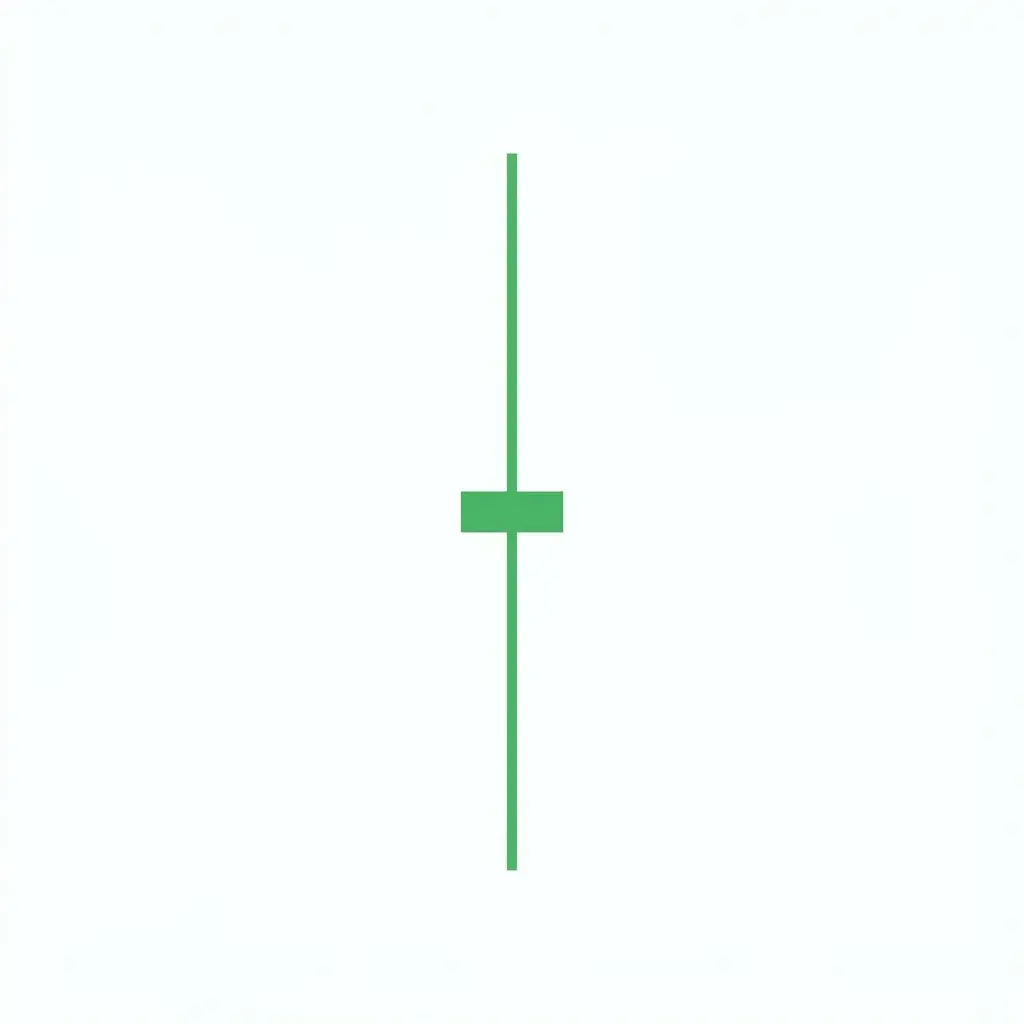
10. Spinning Top
What it looks like: The spinning top is a close relative of the doji. It has a small real body, either bullish or bearish, with upper and lower shadows that are longer than the body itself. Unlike a true doji where the open and close are identical, the spinning top has a visible but small difference between them. The shadows are moderate in length and roughly symmetrical.
What it signals: The spinning top signals indecision that is similar to but slightly less intense than a true doji. The small body indicates that while one side did manage to edge ahead by the close, the victory was marginal and unconvincing. In the context of a strong trend, a spinning top suggests the trend is losing momentum. In a sideways market, it confirms the continued lack of directional commitment.
How to trade it: Treat the spinning top similarly to a standard doji. At the end of a trend near a key level, it warns of potential reversal. The color of the spinning top body can provide a slight directional bias: a bearish spinning top at resistance is more concerning than a bullish one. Always wait for the next candle to confirm before entering. Combine with volume analysis for best results, as spinning tops on declining volume in an uptrend are a strong warning sign.
11. High Wave Candle
What it looks like: The high wave candle features very long upper and lower shadows with a small real body that can be either bullish or bearish. It looks similar to a long legged doji or rickshaw man but has a visible small body rather than a single line. The overall range of the candle is dramatically larger than surrounding candles, making it stand out immediately on the chart.
What it signals: The high wave candle represents extreme confusion and volatility in the market. It forms during sessions where the price whipsawed violently, trapping both buyers and sellers at unfavorable levels before settling near the open. This pattern is often triggered by unexpected news events, earnings surprises, or central bank decisions that create uncertainty. It signals that market participants are reacting emotionally rather than rationally.
How to trade it: High wave candles demand caution. The extreme range means that volatility is elevated and whipsaws are likely in the following sessions. Reduce position sizes when you see this pattern. If trading it, use the same breakout approach as the rickshaw man: let the market resolve the indecision and trade in the direction of the breakout. Be aware that the wide range creates a large stop-loss distance, so adjust your position size accordingly to maintain proper risk management.
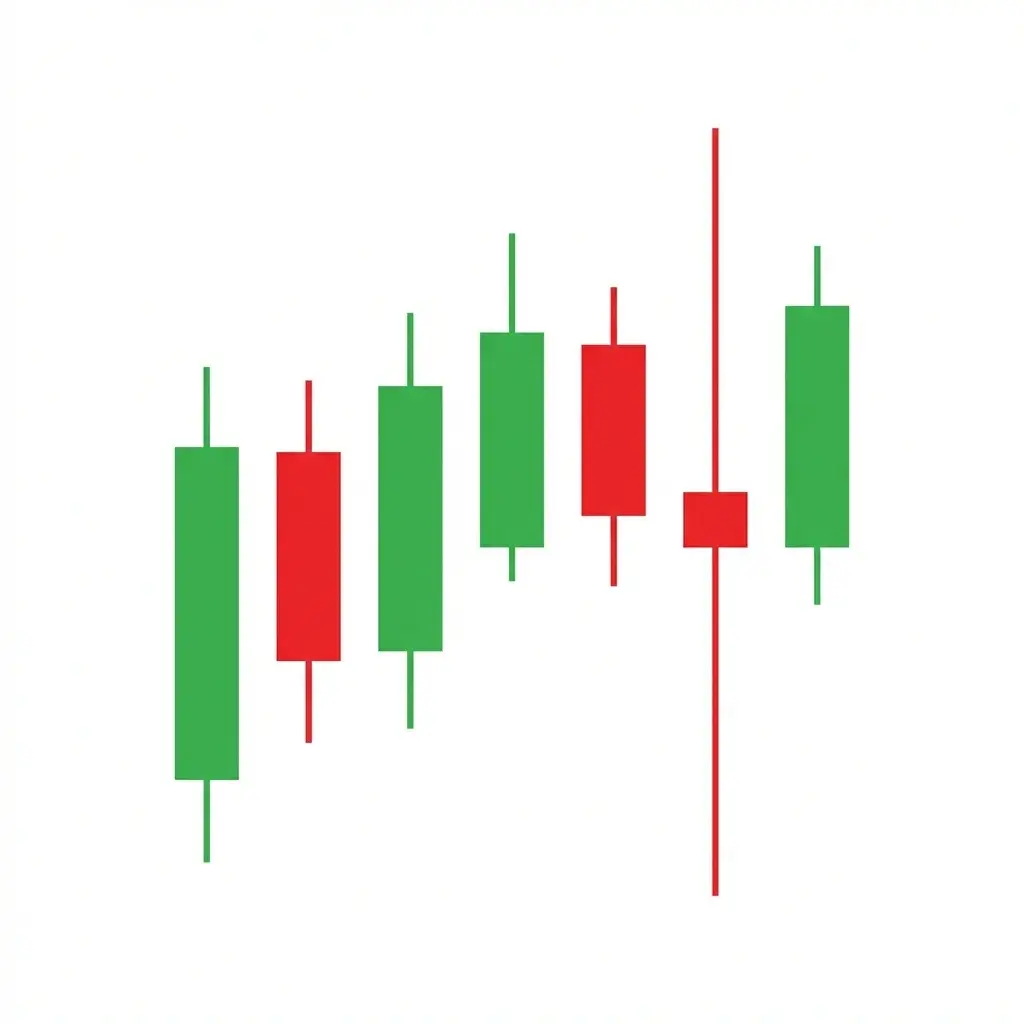
12. Bullish Doji Star
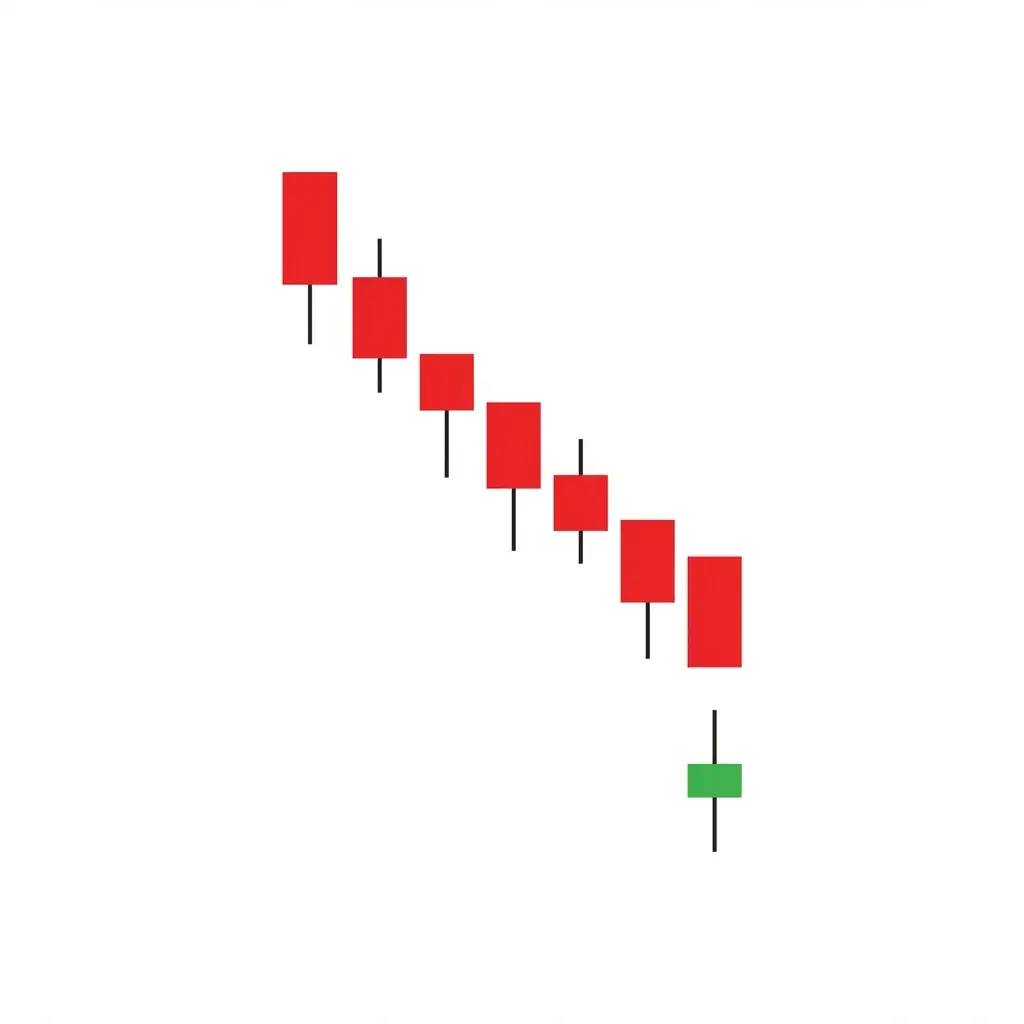
What it looks like: The bullish doji star is a two-candle pattern. First, a strong bearish candle confirms the existing downtrend. Then, a doji forms that gaps below the first candle's close. The gap between the bearish candle and the doji is what creates the "star" formation. The doji can be any variant: standard, long legged, or even a spinning top with a very small body.
What it signals: The bullish doji star is a powerful early reversal signal. The large bearish candle shows that sellers were firmly in control, but the gap-down doji reveals that sellers could not sustain their momentum even after pushing prices lower. The indecision following such a strong bearish move suggests that the selling climax may have occurred. This pattern often forms the first two candles of a morning doji star, one of the most reliable three-candle reversal patterns in technical analysis.
How to trade it: For the highest probability trade, wait for a third candle that closes bullishly above the midpoint of the first bearish candle, completing the morning doji star formation. If the third candle is strong and closes on high volume, enter long with a stop-loss below the doji's low. More aggressive traders may enter on the confirmation of a bullish candle immediately after the doji, but the three-candle completion provides a more reliable signal. This pattern is especially powerful at support levels and after oversold conditions.
When Doji Patterns Actually Matter
The biggest mistake traders make with doji patterns is treating every doji as a signal. In reality, most dojis that appear on a chart are meaningless noise. A doji in the middle of a sideways range tells you nothing you did not already know: the market is going nowhere. To separate high-value doji signals from noise, focus on three contextual filters.
After an Extended Trend
A doji that appears after five or more consecutive candles in the same direction carries far more weight than one in a choppy market. The longer the trend has run, the more significant the indecision signal becomes. After an extended rally, a doji means buyers are exhausted. After a deep sell-off, it means sellers are running out of supply.
At Key Technical Levels
A doji that forms at a well-defined support level, resistance zone, trendline, or moving average is telling you that the market is reacting to that level. These are areas where institutional orders tend to cluster, so indecision at these points often precedes a significant directional move. A doji at a random price level in the middle of a range is meaningless.
With a Volume Spike
A doji on above-average volume is far more significant than one on low volume. High volume means that many participants were active during the session and still could not move the price. This represents a genuine battle between well-capitalized buyers and sellers. Low volume dojis often just reflect a lack of interest and are unreliable as reversal signals.
Pro tip: When all three conditions align, a doji after an extended trend, at a key level, on elevated volume, you have one of the highest probability reversal setups in candlestick analysis. These are the dojis worth trading. Everything else is just noise.
It is also worth noting that doji patterns are more reliable on higher timeframes. A doji on a daily or weekly chart represents hours or days of indecision and carries genuine significance. A doji on a 1-minute chart may just be a few seconds of pause before the trend continues. As a general rule, use the 4-hour chart or above for doji-based trading decisions, and save lower timeframes for entry timing only.
Finally, always remember that a doji is a warning, not a command. It tells you to pay attention and prepare for a potential change in direction, but you should never enter a trade based solely on a doji. The confirmation candle is not optional. The single most important discipline in candlestick trading is patience: wait for the market to show you its hand before you commit your capital.
Frequently Asked Questions
What does a doji candlestick pattern mean?
A doji candlestick pattern signals market indecision. It forms when the opening and closing prices are virtually identical, meaning buyers and sellers fought during the session but neither side won. The shape of the shadows reveals whether bulls or bears had temporary control before the session ended in a draw.
Is a doji candle bullish or bearish?
A doji candle is neither bullish nor bearish on its own. It is a neutral indecision pattern. However, its meaning depends entirely on context. A doji appearing after a prolonged downtrend at a support level can signal a bullish reversal, while a doji after an uptrend at resistance may signal a bearish reversal. Always wait for a confirmation candle before trading.
What is the difference between a dragonfly doji and a gravestone doji?
A dragonfly doji (hammer doji) has a long lower shadow and no upper shadow, showing sellers pushed the price down but buyers recovered it completely. A gravestone doji (shooting star doji) is the opposite: it has a long upper shadow and no lower shadow, showing buyers pushed the price up but sellers drove it back down. Both signal potential reversals depending on the trend context.
How do you trade a doji candlestick pattern?
To trade a doji pattern, first identify the prevailing trend and whether the doji appears at a key level such as support, resistance, or a moving average. Never trade a doji in isolation. Wait for confirmation from the next candle: a strong bullish candle after a doji at support confirms a long entry, while a bearish candle after a doji at resistance confirms a short entry. Use the doji high or low as your stop-loss level.
What is a long legged doji and why is it significant?
A long legged doji has extremely long upper and lower shadows with a tiny body near the center. It is significant because it shows extreme volatility and indecision: the price swung dramatically in both directions during the session before closing near the open. Long legged dojis often appear at major turning points and indicate that a big move may follow as the market resolves its indecision.
"A doji is the market holding its breath. What matters is what comes next."
That's really all you need to remember. Dojis at random spots in the middle of nowhere? Ignore them. Doji at a level where price has bounced three times before on huge volume? Now you're onto something. Context is king with these.